. 2020 Feb 19;6(8):eaay9209.
doi: 10.1126/sciadv.aay9209. eCollection 2020 Feb.

Engineering light-controllable CAR T cells for cancer immunotherapy

Affiliations

Engineering light-controllable CAR T cells for cancer immunotherapy

Ziliang Huang et al. Sci Adv. .

Abstract

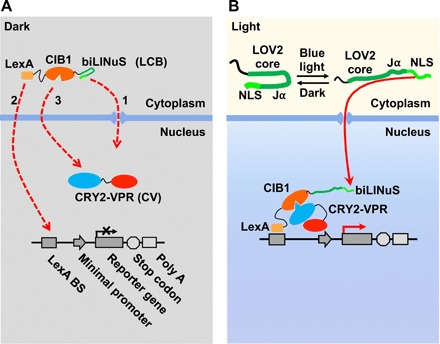
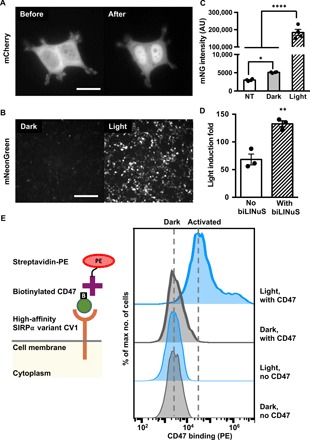
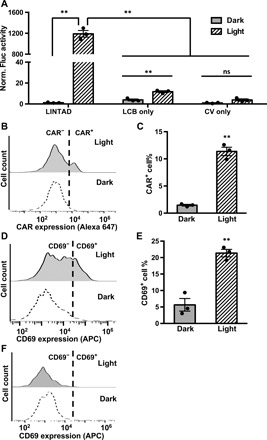
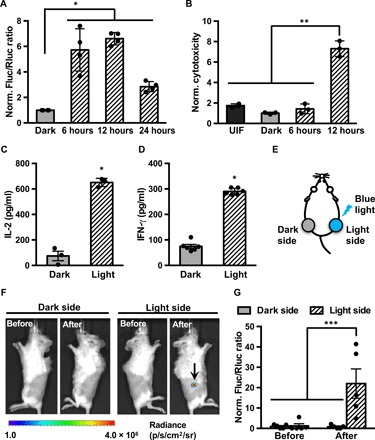
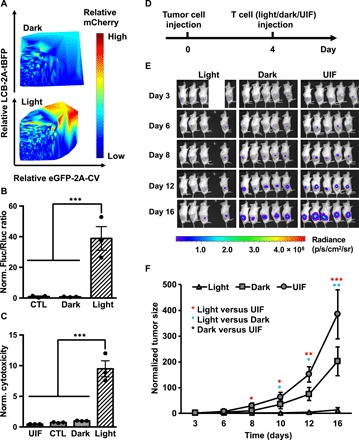
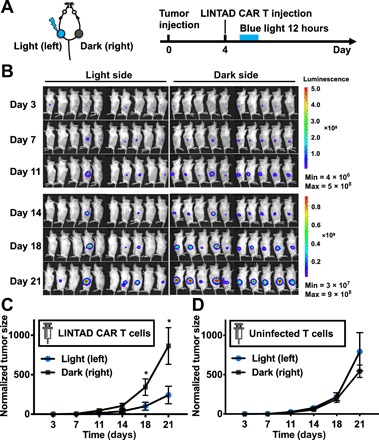
T cells engineered to express chimeric antigen receptors (CARs) can recognize and engage with target cancer cells with redirected specificity for cancer immunotherapy. However, there is a lack of ideal CARs for solid tumor antigens, which may lead to severe adverse effects. Here, we developed a light-inducible nuclear translocation and dimerization (LINTAD) system for gene regulation to control CAR T activation. We first demonstrated light-controllable gene expression and functional modulation in human embryonic kidney 293T and Jurkat T cell lines. We then improved the LINTAD system to achieve optimal efficiency in primary human T cells. The results showed that pulsed light stimulations can activate LINTAD CAR T cells with strong cytotoxicity against target cancer cells, both in vitro and in vivo. Therefore, our LINTAD system can serve as an efficient tool to noninvasively control gene activation and activate inducible CAR T cells for precision cancer immunotherapy.


Figures

Fig. 1
Fig. 1. Schematics of the LINTAD gene activation system.
(A) The three components of the LINTAD system. LexA-CIB1-biLINuS (LCB): LexA fused with CIB1 and the bipartite light-inducible NLS (biLINuS); CRY2PHR-VPR (CV): CRY2PHR fused with VPR; light-inducible reporter: LexA binding sequence (LexA BS) fused with a minimal promoter and a target gene. In the dark state, LCB stays in the cytoplasm and CV in the nucleus. (B) Upon blue light stimulation, the Jα helix of the LOV2 domain in biLINuS is unfolded to expose the NLS peptide [top part in (B)], which leads to LCB translocation into the nucleus [red dashed line 1 in (A)]. LexA then binds to LexA BS on the light-inducible reporter [red dashed line 2 in (A)]. Meanwhile, CRY2PHR binds to CIB1 upon blue light stimulation [red dashed line 3 in (A)], thus targeting VPR to the minimal promoter region to trigger the reporter gene expression.
Fig. 2
Fig. 2. Characterization of LINTAD gene activation in HEK 293T cells.
(A) HEK 293T cells were transfected with LexA-CIB1-mCherry-biLINuS (LCmB) to track the nuclear localization of LCB before and after light stimulation. Scale bar, 20 μm. (B) Light-inducible mNeonGreen expression. HEK 293T cells were cotransfected with LCB, CV, and the light-inducible mNeonGreen reporter. Dark, without light stimulation; Light, with 24-hour light stimulation. Scale bar, 200 μm. (C) Comparison of mNeonGreen (mNG) intensity of cells transfected with LINTAD and mNeonGreen reporter with (light) or without light stimulation (dark). NT, HEK 293T without transfection. AU, arbitrary unit. Results were quantified by flow cytometry (n = 4 independent experiments, with 20,000 cells per experiment). (D) Comparison of light-inducible systems with or without the light-inducible NLS (biLINuS). HEK 293T cells were cotransfected with LCB (with biLINuS) or LexA-CIB1 (no biLINuS), CV, the light-inducible Fluc reporter, and a constitutive Rluc as an internal reference to normalize the induced Fluc expression in each group (n = 3 independent experiments). Light induction fold in each group is defined as the ratio of the normalized Fluc activities in the light condition to that in the dark condition. (E) Comparison of CD47 binding of cells transfected with LCB, CV, and the light-inducible CV1 reporter with or without light stimulation. Left: Schematics of the CV1-CD47 binding assay. Right: Representative flow cytometry histograms of PE staining (streptavidin-PE) of CD47 under different conditions. SIRPα, signal regulatory protein α. Dark, without light stimulation; Light, with 24-hour light stimulation; no CD47, cells without CD47 ligand incubation before PE staining; with CD47, cells incubated with CD47 before PE staining. **P < 0.01; ****P < 0.0001; two-tailed Student’s t test. Error bar, SEM.
Fig. 3
Fig. 3. LINTAD system can induce target gene expression upon light stimulation in Jurkat cells.
(A) Characterization of LINTAD system with light-inducible Fluc reporter. Jurkat cells were transfected with (i) both LCB and CV components (LINTAD), (ii) only the LCB component (LCB only), or (iii) only the CV component (CV only). All groups were also cotransfected with the light-inducible Fluc reporter. Fluc activities were measured using the same number of cells in each group, and all values were normalized to that of “CV only (dark).” n = 3 independent experiments. (B) Representative flow cytometry charts showing light-inducible CD19CAR expression in Jurkat cells (transfected with LINTAD regulators LCB and CV, and the light-inducible CD19CAR reporter; the whole live cell population is shown in each chart). CAR expression was quantified by staining of the Myc tag fused to the extracellular domain of CD19CAR. The gating threshold for CAR+ cells was based on the Myc tag staining of nontransfected Jurkat cells and was indicated in the figure with dotted line. (C) Comparison of CAR+ cell percentage of the dark and light groups shown in (B). n = 3 independent experiments. (D) Representative flow cytometry charts showing CD69 levels of the light and dark groups. Jurkat cells were transfected with LINTAD regulators and the CD19CAR-YPet reporter, cocultured with CD19-expressing Toledo cells after light/dark treatment, and stained with anti-CD69 antibody for flow cytometry analysis. The gating threshold for CD69+ cells was based on the staining of nontransfected Jurkat cells and was indicated in the figure with a dotted line. The YPet+ populations of the cocultured cells were used for CD69 comparison to exclude Toledo cells and Jurkat cells not containing all the three plasmids. See fig. S3D for the CAR-YPet expression profiles of the light and dark groups. APC, allophycocyanin. (E) Comparison of CD69+ cell percentage of the dark and light groups shown in (D). n = 3 independent experiments. (F) Representative CD69 expression profiles of Jurkat cells hosting light-inducible headless CAR reporter after coculture with CD19-expressing target cells and anti-CD69 antibody staining. The YPet+ populations were used for CD69 comparison. The gating threshold for CD69+ cells was based on the staining of nontransfected Jurkat cells and was indicated in the figure with a dotted line. **P < 0.01. ns, not significant. Two-tailed Student’s t test with Bonferroni correction was used for (A); two-tailed Student’s t test was used for (C) and (E). In all panels: light, with 24-hour light stimulation; dark, without light stimulation. In all bar graphs, data represent mean values ± SEM.
Fig. 4
Fig. 4. Light-inducible cytotoxicity of engineered primary human T cells in vitro and light-inducible gene activation in vivo.
(A) Characterization of LINTAD-mediated Fluc induction in primary human T cells. T cells infected with LINTAD regulators and Fluc reporter (with constitutive Rluc as internal reference) were (i) kept in the dark (dark) or stimulated by blue light for (ii) 6, (iii) 12, or (iv) 24 hours. The gene induction level was represented by the ratio of Fluc to Rluc luminescence in each group and normalized to the mean value of the dark group. n = 4 independent experiments. (B) In vitro light-inducible cytotoxicity of T cells with CD19CAR reporter. Engineered T cells were either without light stimulation (dark) or stimulated with blue light for 6 or 12 hours, followed by coculture with Fluc+ Nalm-6 tumor cells for 24 hours. Uninfected T cells (UIF) were used as control following the same procedures. The Fluc activities of the remaining live Nalm-6 cells after coculture were quantified, and the inverses of the Fluc readings were calculated as the cytotoxicity values and normalized to that of the dark group. n = 3 independent experiments. (C and D) Cytokines IL-2 and IFN-γ secretion from T cells engineered with LINTAD and CD19CAR reporter after coculture with Nalm-6 cells were quantified by ELISA. Dark, without light stimulation; Light, with 12 hours of blue light stimulation. N ≥ 3 biological repeats. (E to G) Light-inducible Fluc activation in vivo. (E) Mouse model used for in vivo light-inducible gene activation. Engineered light-inducible Nalm-6 cells infected with LINTAD and Fluc reporter (with constitutive Rluc as internal reference) were subcutaneously injected into both flanks of NSG mice. One side of the mouse received blue light stimulation (light side), while the other side served as the dark control (dark side) as described in Materials and Methods. (F) Representative bioluminescence images showing the induced Fluc expression by blue light (at the region highlighted by the arrow). (G) Statistical comparison of light-inducible Fluc activation in mice. Induction level was indicated by Fluc/Rluc ratio at the same site. All Fluc/Rluc values were normalized to that of “Before, Dark side.” n = 5 mice. *P < 0.05; **P < 0.01; ***P < 0.001. Two-tailed Student’s t test with Bonferroni correction was applied in (A) and (B). Two-tailed Student’s t test was applied in (C) and (D). One-way analysis of variance (ANOVA) with Fisher’s least significant difference multiple comparison test was applied for (G). Bar graphs, data represent mean values ± SEM.
Fig. 5
Fig. 5. In vivo cytotoxicity of light-activated primary human T cells.
(A) Gene induction efficiency of LINTAD strongly depends on concentrations of regulators. Primary human T cells were infected with LCB-2A-tBFP and eGFP-2A-CV to indicate the expression levels of LINTAD regulators. Light-inducible mCherry reporter was used to determine the gene induction level. The intensity (and hence induction level) of mCherry is color coded, with cold and hot colors representing low and high levels. Dark, without light stimulation; Light, with 12 hours of blue light stimulation. (B) Light-inducible gene expression using WW-LINTAD in primary T cells. Light and Dark: T cells infected with lentiviral WW-LINTAD (LWWCB and WP1CV) and Fluc reporter (with constitutive Rluc as internal reference) were stimulated with (light) or without (dark) for 12 hours. CTL, control T cells infected with only the LWWCB component and reporter. Fluc/Rluc ratios represent gene induction levels and are normalized to that of the dark group. (C) Cytotoxicity of T cells engineered with WW-LINTAD, light-inducible Cre reporter, and loxP-ZsGreen-stop-loxP-CD19CAR (see fig. S9). UIL, uninfected T cells. CTL, control T cells infected with only the LWWCB component of WW-LINTAD, Cre reporter, and loxP-ZsGreen-stop-loxP-CD19CAR. Dark, without light stimulation; Light, with 12 hours of light stimulation. Different groups of T cells were cocultured with Fluc+ Nalm-6 cells for 24 hours. Fluc activities of the remaining live Nalm-6 cells after coculture were quantified. Cytotoxicity values were calculated as 1/Fluc and normalized to that of the dark group. Data represent mean values ± SEM (n = 3 independent experiments). (D to F) In vivo cytotoxicity of light-inducible T cells after in vitro light stimulation. NSG mice were subcutaneously injected with Fluc+ Nalm-6 cells on the right flank. Primary human T cells engineered with WW-LINTAD, light-inducible Cre reporter, and loxP-ZsGreen-stop-loxP-CD19CAR were treated with (light) or without (dark) 12 hours of blue light, followed by local injection into the mice at the tumor sites. Uninfected T cells (“UIF”) were used as control following the same procedures. (D) Timeline of tumor inoculation and T cell injection. (E) Tumor burden was quantified by bioluminescence imaging (BLI) after tumor inoculation for 16 days. We only included four mice in the light group, because the engineered T cells were not sufficient for five mice as planned due to accidental cell loss during experimental processes. (F) Quantification of tumor aggressiveness in different groups in (E). The integrated luminescence of a tumor at each time point was normalized to that of the same tumor on day 3 (before T cell injection). Data represent mean ± SEM (n = 4 mice for “Light,” n = 5 mice for “Dark” and “UIF”). *P < 0.05; **P < 0.01; ***P < 0.001. One-way ANOVA, followed by Fisher’s least significant difference multiple comparison test was used for (B), (C), and (F).
Fig. 6
Fig. 6. In vivo light stimulation of LINTAD CAR T cells can control cytotoxicity with high spatial resolution.
(A) Mouse model and experiment timeline. Fluc+ Nalm-6 cells were subcutaneously injected on both flanks of the mouse, and LINTAD CAR T cells were locally injected into the inoculated tumor sites 4 days later. One side (left) was illuminated with blue light for 12 hours (light), while the other side (right) served as the dark control (dark) as described in Materials and Methods. (B) Bioluminescence images of mice in the experiment described in (A). (C) Quantification of tumor growth in (B). (D) Same experiment procedures as in (A) with UIFs instead of LINTAD CAR T cells. In all panels, tumor size was quantified using the integrated Fluc luminescence of a tumor normalized to that of the same tumor on day 3. Error bar, SEM [n = 10 mice in (B), and n = 5 mice in (C) and (D)]. *P < 0.05. One-way ANOVA, followed by Fisher’s least significant difference multiple comparison test was used for (C) and (D).

Similar articles

Cited by

References

    1. Maus M. V., June C. H., Making better chimeric antigen receptors for adoptive T-cell therapy. Clin. Cancer Res. 22, 1875–1884 (2016). - PMC - PubMed
    1. Jacoby E., Nguyen S. M., Fountaine T. J., Welp K., Gryder B., Qin H., Yang Y., Chien C. D., Seif A. E., Lei H., Song Y. K., Khan J., Lee D. W., Mackall C. L., Gardner R. A., Jensen M. C., Shern J. F., Fry T. J., CD19 CAR immune pressure induces B-precursor acute lymphoblastic leukaemia lineage switch exposing inherent leukaemic plasticity. Nat. Commun. 7, 12320 (2016). - PMC - PubMed
    1. Wu C.-Y., Roybal K. T., Puchner E. M., Onuffer J., Lim W. A., Remote control of therapeutic T cells through a small molecule-gated chimeric receptor. Science 350, aab4077 (2015). - PMC - PubMed
    1. Frigault M. J., Lee J., Basil M. C., Carpenito C., Motohashi S., Scholler J., Kawalekar O. U., Guedan S., McGettigan S. E., Posey A. D. Jr., Ang S., Cooper L. J. N., Platt J. M., Johnson F. B., Paulos C. M., Zhao Y., Kalos M., Milone M. C., June C. H., Identification of chimeric antigen receptors that mediate constitutive or inducible proliferation of T cells. Cancer Immunol. Res. 3, 356–367 (2015). - PMC - PubMed
    1. Tokarew N., Ogonek J., Endres S., von Bergwelt-Baildon M., Kobold S., Teaching an old dog new tricks: Next-generation CAR T cells. Br. J. Cancer 120, 26–37 (2019). - PMC - PubMed

Publication types

MeSH terms