. 2020 Feb 21;6(8):eaaz2322.
doi: 10.1126/sciadv.aaz2322. eCollection 2020 Feb.

Egocentric boundary vector tuning of the retrosplenial cortex

Affiliations

Egocentric boundary vector tuning of the retrosplenial cortex

Andrew S Alexander et al. Sci Adv. .

Abstract

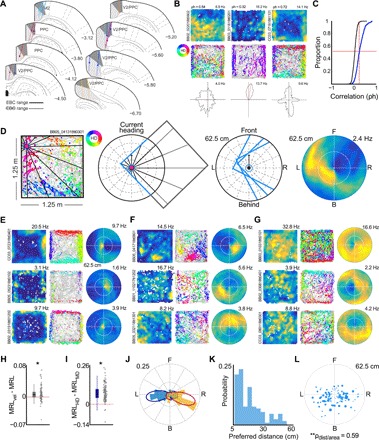
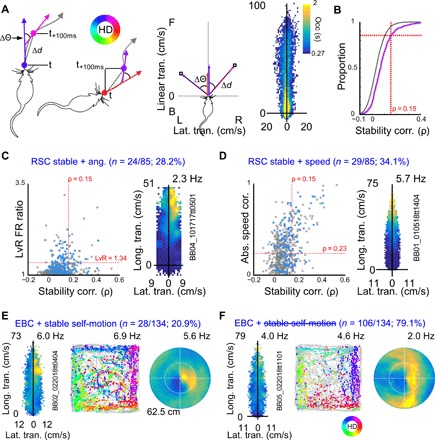
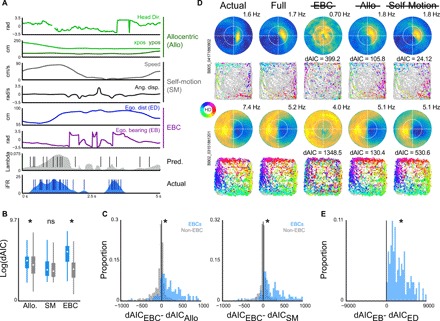
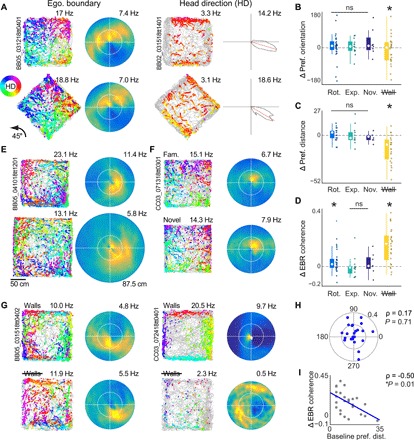
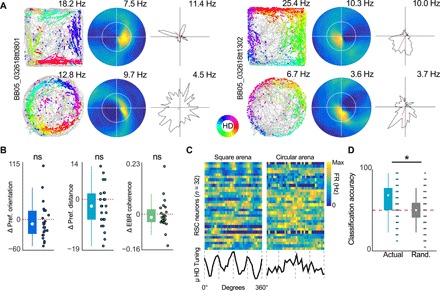
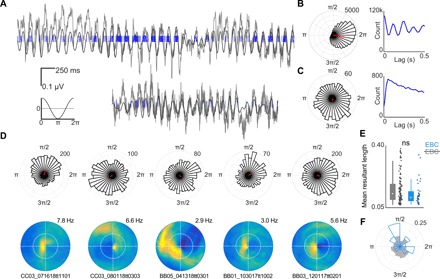
The retrosplenial cortex is reciprocally connected with multiple structures implicated in spatial cognition, and damage to the region itself produces numerous spatial impairments. Here, we sought to characterize spatial correlates of neurons within the region during free exploration in two-dimensional environments. We report that a large percentage of retrosplenial cortex neurons have spatial receptive fields that are active when environmental boundaries are positioned at a specific orientation and distance relative to the animal itself. We demonstrate that this vector-based location signal is encoded in egocentric coordinates, is localized to the dysgranular retrosplenial subregion, is independent of self-motion, and is context invariant. Further, we identify a subpopulation of neurons with this response property that are synchronized with the hippocampal theta oscillation. Accordingly, the current work identifies a robust egocentric spatial code in retrosplenial cortex that can facilitate spatial coordinate system transformations and support the anchoring, generation, and utilization of allocentric representations.


Figures

Fig. 1
Fig. 1. Egocentric boundary vector representations of RSC neurons during free exploration.
(A) Locations of RSC tetrode tracts where neurons with egocentric boundary sensitivity were observed. For each tetrode, solid lines indicate range where EBCs were recorded, and filled circles indicate estimation of most ventral location of EBC observation. (B) Example 2D ratemaps (top), trajectory plots (middle), and head direction tuning plots (bottom) for three RSC neurons with significant stability in spatial firing. For trajectory plots, the position of the animal throughout the entire experimental session is depicted in gray. The location of individual spikes is shown with colored circles, which indicate the corresponding head direction of the animal according to the legend on the left. (C) Cumulative density function depicts Spearman’s rho calculated after correlating 2D ratemaps taken from the first and second halves of each experimental session (blue). In black, distribution of spatial stability scores after randomly shifting spike trains relative to position is shown. Red vertical line shows 99th percentile of randomized distribution and its intersection with the real distribution of spatial stability. Percentage of neurons above red horizontal line have significant spatial stability. (D) Schematic for construction of EBRs. Left and middle panels: An example spike is mapped with respect to egocentric boundary locations in polar coordinates. Left: The head direction of the animal is determined for each spike (vector with arrow), and the distance to wall intersections for all 360° is determined (subsample shown for clarity). Middle left: Boundaries within 62.5 cm are referenced to the current head direction of the animal for a single spike. Middle right: Example boundary positions for three spikes. Right: Example EBR. (E) 2D ratemaps, trajectory plots, and EBRs for three example RSC EBCs with animal-proximal receptive fields. (F) Same as in (E) but for three RSC EBCs with animal-distal receptive fields. (G) Same as in (E) and (F) but for three RSC EBCs with inverse receptive fields. (H) Difference in strength of EBC tuning when a speed threshold was applied (MRLvel) versus no speed threshold (MRL). (I) Difference in strength of EBC tuning when egocentric bearing was referenced to head direction (MRLHD) rather than movement direction (MRLMD). (J) Polar histogram of preferred orientation of receptive field across all RSC EBCs. Yellow and blue bars correspond to EBCs recorded in the left and right hemisphere, respectively. Overlaid probability density estimates from two-component Von Mises mixture models on distribution of preferred orientation for left (red) and right (blue) hemispheres. (K) Distribution of preferred distance of all RSC EBC receptive fields. (L) Polar scatter plot of preferred orientation versus preferred distance for the full RSC EBC population. Circle size indicates the area of the egocentric boundary vector receptive field.
Fig. 2
Fig. 2. RSC egocentric boundary vector representations cannot be explained purely by self-motion correlates.
(A) Schematic of generation of self-motion referenced ratemaps. Left: Example angular and distance translation across 100-ms temporal windows for two hypothetical position samples. Middle: Corresponding lateral and longitudinal translation for left examples in self-motion referenced coordinates. Right: Heat map depicting mean occupancy in seconds for lateral and longitudinal translation combinations across a complete experimental session. Δd, distance displacement; Δθ, angular displacement; colored arrows depict individual position samples 100 ms apart; gray arrow, hypothetical trajectory. (B) In pink, cumulative density functions for self-motion ratemap stability values (Spearman’s ρ) for all RSC neurons (randomization in gray). Red vertical line shows 95th percentile of randomized distribution and its intersection with the real distribution of spatial stability. Percentage of neurons above red horizontal line have significant self-motion stability. (C) Left: Self-motion stability score (x axis) versus absolute ratio of activity on left versus right halves of self-motion ratemaps (y axis) for all RSC neurons. Blue dots correspond to identified RSC EBCs. Red lines and corresponding values correspond to 95th percentiles of randomized distributions for both metrics. Neurons with values in upper right region were determined to have significant angular displacement tuning. Right: Example RSC neuron with significant firing rate modulation for clockwise movements. (D) On the left, same as in (C) but for self-motion stability score versus absolute correlation between mean firing rate and longitudinal displacement (“speed”). Right: Example RSC neuron with significant firing rate modulation as a function of longitudinal displacement. (E) Example RSC EBC with stable self-motion correlates. (F) Example RSC EBC without stable self-motion correlates.
Fig. 3
Fig. 3. Egocentric vector tuning is more robust than allocentric or self-motion correlates using a generalized linear modeling framework.
(A) Example GLM predictors composing allocentric, self-motion, and egocentric vector classes with corresponding actual and predicted firing rates and spike trains over a 5-s window. (B) Boxplots depicting median and quartiles of log-transformed dAIC scores for models, with all allocentric, self-motion, or egocentric vector predictors removed (blue bars, EBCs; gray bars, non-EBCs). Larger dAICs indicate greater error in model fit with removal of a predictor class. (C) Comparison of dAIC scores for models with egocentric vector versus allocentric predictors removed (left) or egocentric vector versus self-motion predictors removed (right) for EBCs (blue) and non-EBCs (gray). Rightward shifts indicate greater error in model fit for models with removed egocentric vector predictors. (D) For two example RSC EBCs, predicted GLM spike trains from all models were used to construct EBRs and trajectory plots. Left column: Actual EBR and corresponding trajectory plot below. Second column: For the same cell, an EBR and corresponding trajectory plot for the GLM constructed using all egocentric vector, allocentric, and self-motion predictors. Final three columns: EBRs and trajectory plots for each reduced model and corresponding dAIC scores. (E) Comparison of dAIC scores for models with the egocentric bearing versus the egocentric distance removed reveal greater impact of egocentric bearing for EBCs.
Fig. 4
Fig. 4. EBCs are anchored to local boundaries, respond in novel environments, and lose sensitivity in arenas without explicit borders.
(A) Left: Trajectory plot and EBR for an example EBC with similar egocentric boundary vector tuning in baseline experimental session (top) and a second session in an environment rotated 45° (bottom). Right: Example head direction neuron sustains directional tuning across both conditions. (B) Preferred orientation of EBC receptive fields in all arena manipulation sessions subtracted from the preferred orientation in baseline sessions. (C) Preferred distance of EBC receptive fields in all arena manipulation sessions subtracted from the preferred distance in baseline sessions. (D) EBC receptive field coherence in all arena manipulation sessions subtracted from receptive field coherence in baseline sessions. (E) Trajectory plot and EBR for an example EBC with similar egocentric boundary vector tuning in baseline experimental session (top) and a second session in an expanded arena (bottom). (F) Trajectory plot and EBR for an example EBC with similar egocentric boundary vector tuning in baseline experimental session (top) and a second session in a novel arena (bottom). (G) Trajectory plot and EBR for two example EBCs between baseline session (top) and session with walls removed (bottom). Left EBC has a more distal receptive field and exhibits similar egocentric boundary vector tuning. Right EBC has a more proximal receptive field and has disrupted tuning in arena with no walls. (H) For EBCs recorded in arenas without walls, the preferred orientation at baseline plotted against the change in EBC receptive field coherence between the two sessions is shown. (I) Same as (H) but for change in coherence as a function of baseline preferred distance.
Fig. 5
Fig. 5. RSC EBCs are insensitive to environmental geometry, which generates a directional representation of environment shape.
(A) Trajectory plots, EBRs, and head direction tuning plots for two example RSC EBCs for experimental sessions in a square (top) and circular environment (bottom). (B) Preferred orientation, preferred distance, and EBC receptive field coherence from recording sessions in the circular arena subtracted from the corresponding metrics in square arena sessions. (C) Head direction tuning plots for all RSC neurons (in the same order) in the square arena (left) and circular arena (right). Color depicts intensity of activation (blue is zero firing rate; yellow is maximum firing rate). Bottom in black: The average head direction tuning across the full population of RSC neurons for the square and circular environments. Gray dashed lines depict 90° axes. (D) Arena classification accuracy for linear discriminant analysis on head direction tuning from (C). Teal, actual classification; gray, classification after randomizing arena identity. Red dashed line is statistical chance.
Fig. 6
Fig. 6. A subset of RSC EBCs is theta-modulated.
(A) Two examples of RSC theta oscillation (gray) and spike train of simultaneously recorded neurons (blue). Bottom left: Scale bar and schematic depicting correspondence between oscillation and theta phase. (B) Left: Circular histogram depicting spike counts as a function of theta phase for the neuron in the top row of (A). Density of spikes near 2π indicates that the neuron is locked to the peak of the theta phase. Right: Spike train autocorrelogram for the same neuron shows theta rhythmic spiking. (C) Same as in (B) but for the neuron depicted in the bottom row of (A). This neuron is significantly theta phase-modulated but does not exhibit theta rhythmic spiking. (D) Example theta phase-modulated EBCs. Top row: Circular histogram of spike counts versus theta phase. Bottom row: Corresponding EBRs. (E) Strength of theta phase modulation as measured by the MRL for non-EBCs (gray) and EBCs (blue). EBCs have theta modulation significantly similar to non-EBCs with significant phase relationships. (F) Preferred theta phase for all EBCs (blue) and non-EBCs (gray). EBCs tended to prefer the falling phase of the theta oscillation, while non-EBCs preferred the rising phase.

Similar articles

Cited by

References

    1. Hafting T., Fyhn M., Molden S., Moser M.-B., Moser E. I., Microstructure of a spatial map in the entorhinal cortex. Nature 436, 801–806 (2005). - PubMed
    1. O’Keefe J., Dostrovsky J., The hippocampus as a spatial map. Preliminary evidence from unit activity in the freely-moving rat. Brain Res. 34, 171–175 (1971). - PubMed
    1. Taube J. S., Muller R. U., Ranck J. B. Jr., Head-direction cells recorded from the postsubiculum in freely moving rats. I. Description and quantitative analysis. J. Neurosci. 10, 420–435 (1990). - PMC - PubMed
    1. Morris R. G. M., Garrud P., Rawlins J. N. P., O’Keefe J., Place navigation impaired in rats with hippocampal lesions. Nature 297, 681–683 (1982). - PubMed
    1. Steffenach H.-A., Witter M., Moser M.-B., Moser E. I., Spatial memory in the rat requires the dorsolateral band of the entorhinal cortex. Neuron 45, 301–313 (2005). - PubMed

Publication types

LinkOut - more resources