. 2020 Jan;2(1):110-125.
doi: 10.1038/s42255-019-0162-4. Epub 2020 Jan 23.

High-protein diets increase cardiovascular risk by activating macrophage mTOR to suppress mitophagy

Affiliations

High-protein diets increase cardiovascular risk by activating macrophage mTOR to suppress mitophagy

Xiangyu Zhang et al. Nat Metab. 2020 Jan.

Erratum in

Abstract

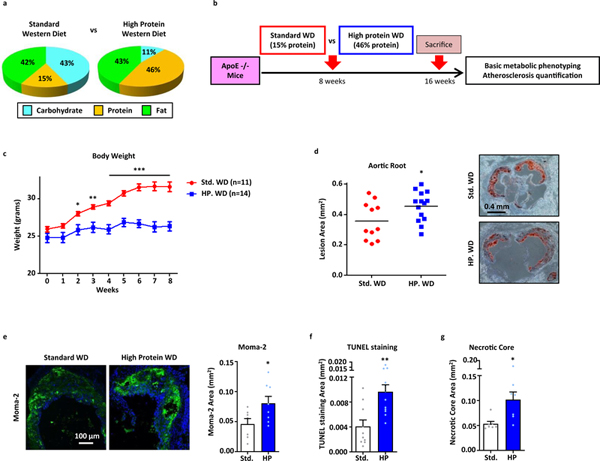
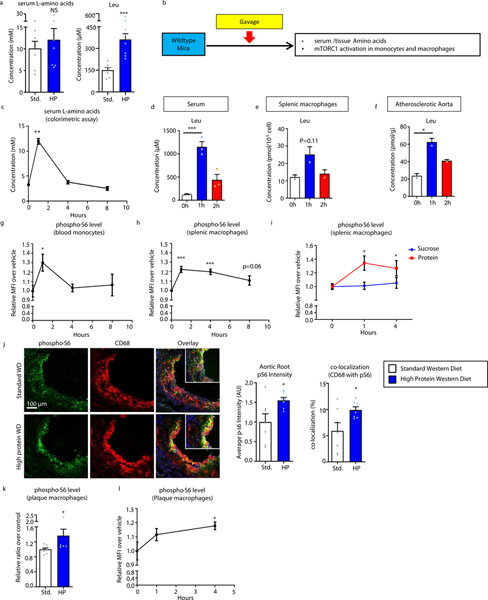
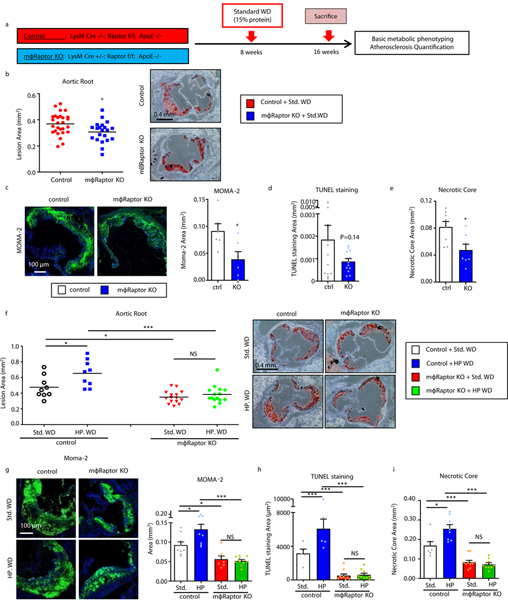
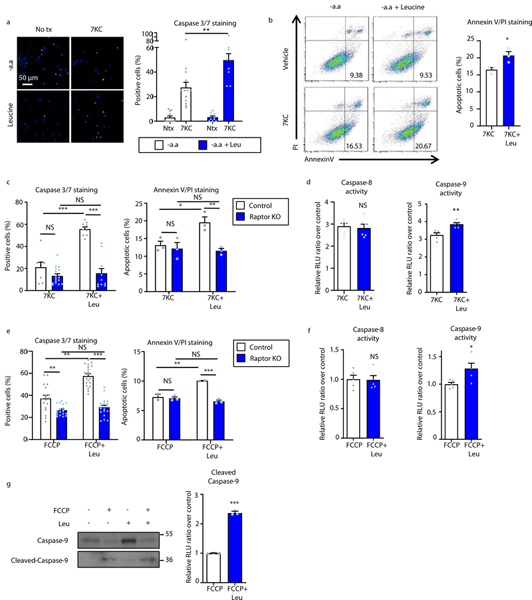
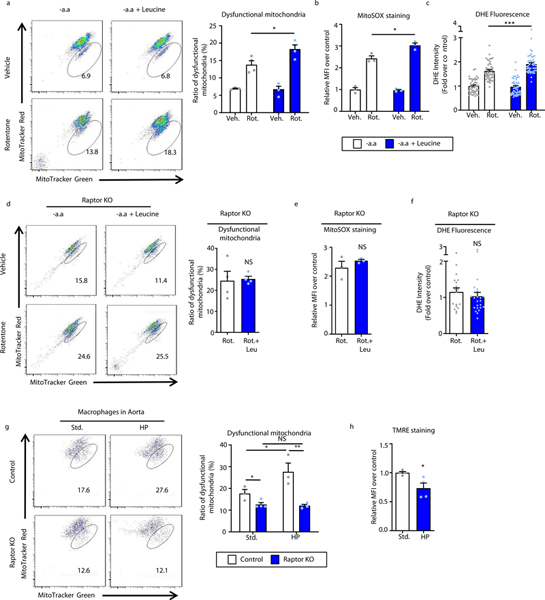
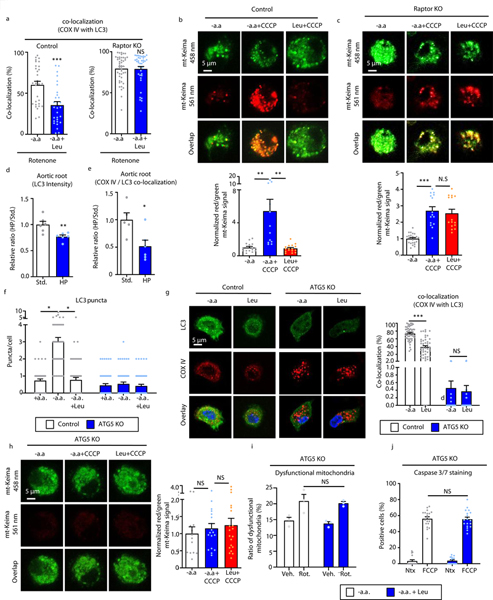
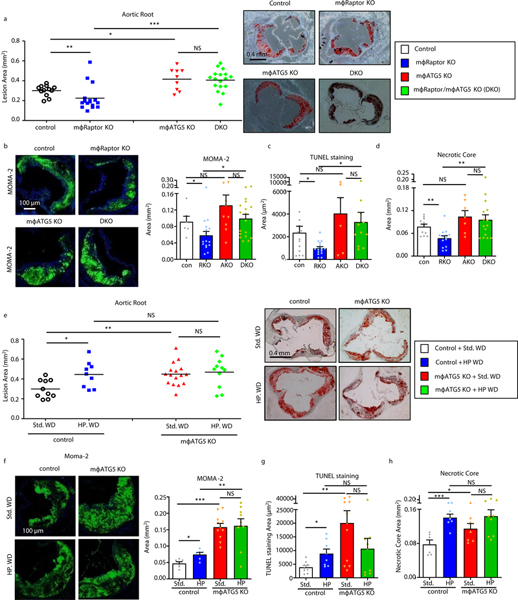
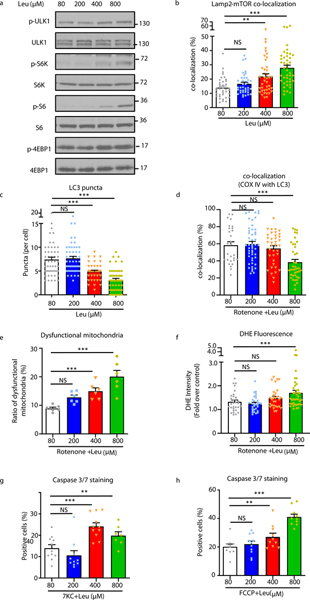
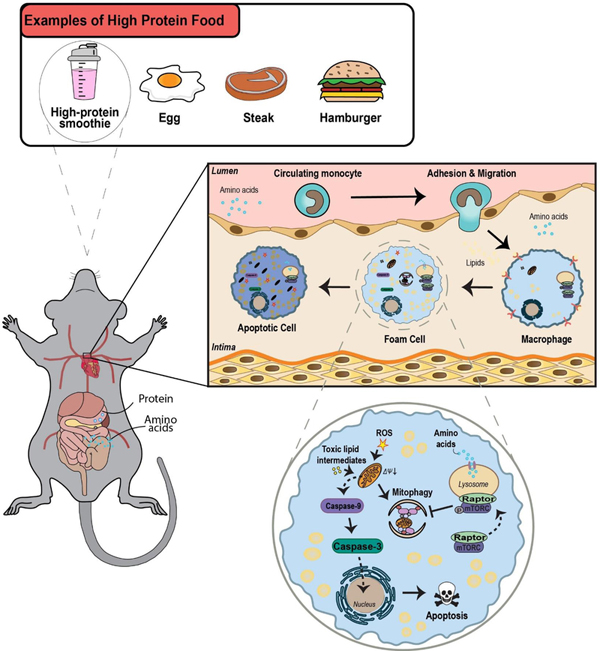
High protein diets are commonly utilized for weight loss, yet have been reported to raise cardiovascular risk. The mechanisms underlying this risk are unknown. Here, we show that dietary protein drives atherosclerosis and lesion complexity. Protein ingestion acutely elevates amino acid levels in blood and atherosclerotic plaques, stimulating macrophage mTOR signaling. This is causal in plaque progression as the effects of dietary protein are abrogated in macrophage-specific Raptor-null mice. Mechanistically, we find amino acids exacerbate macrophage apoptosis induced by atherogenic lipids, a process that involves mTORC1-dependent inhibition of mitophagy, accumulation of dysfunctional mitochondria, and mitochondrial apoptosis. Using macrophage-specific mTORC1- and autophagy-deficient mice we confirm this amino acid-mTORC1-autophagy signaling axis in vivo. Our data provide the first insights into the deleterious impact of excessive protein ingestion on macrophages and atherosclerotic progression. Incorporation of these concepts in clinical studies will be important to define the vascular effects of protein-based weight loss regimens.


Figures

Figure 1.
Figure 1.. High Protein diets increase atherosclerotic plaque formation and plaque complexity.
(a,b) Comparison between the carbohydrate, protein, and fat content in standard and high protein Western diets (kcal%) (a) and summary of experimental protocol for in vivo assessment of atherosclerosis (b). (c) Total body weight of ApoE-null mice fed standard or high protein Western diets for 8 weeks (Std. WD: n=11; HP WD: n=14). (d) Quantification of atherosclerotic plaque burden using Oil Red O-stained aortic root sections from mice fed standard or high protein Western diets for 8 weeks; representative roots shown on right. (e-g) Plaque composition quantified by immunofluorescence staining of aortic root sections for (e) macrophage (MOMA-2+) (Std. WD: n=7; HP WD: n=8), (f) apoptosis (TUNEL+) (Std. WD: n=10; HP WD: n=12), (g) and necrotic core (acellular) (Std. WD: n=7; HP WD: n=7). Data are presented as mean ±SEM. *P < 0.05, **P < 0.01, ***P < 0.001, two-tailed unpaired t-test.
Figure 2.
Figure 2.. High Protein diets elevate amino acids levels in vivo and activate mTOR signaling in plaque macrophages.
(a) Serum levels of total L-amino acids (colorimetric assay) and leucine (mass spectrometry) from mice fed standard (n=7) or high protein (n=8) Western diets for 8 weeks. (b) Summary of gavage/time course experimental protocol for determining acute effects of high protein intake. (c) Serum levels of total L-amino acids (colorimetric assay) after high protein gavage for indicated time (n=3). (d-f) Leucine levels in serum (n=3) (d), splenic macrophages (n=2) (e), and atherosclerotic aortas (n=2) (f) by mass spectrometry after high protein gavage for indicated times. (g,h) FACS analysis of pS6 levels in blood monocytes (n=3) (g) and splenic macrophages (n=5) (h) after high protein gavage for indicated times. (i) Comparison of pS6 levels in splenic macrophages after gavage with water or equal calories of sucrose (n=4) or protein (n=4) at 0, 1, and 4 hours. (j) Immunofluorescence analysis of pS6 levels and co-localization of pS6 with the macrophage marker CD68 in atherosclerotic plaques from mice fed standard (n=7) or high protein (n=7) Western diets for 8 weeks. Representative images are shown on left and quantification on right. (k,l) FACS analysis of pS6 levels in atherosclerotic plaque macrophages from (k) mice fed standard (n=6) or high protein (n=6) Western diet for 8 weeks or (l) after high protein gavage for indicated times (n=3). For (Figures 2g-i, 2l), graphs represent relative MFI over vehicle control. Data are presented as mean ±SEM. *P < 0.05, ***P < 0.001, two-tailed unpaired t-test for a, j, k, one-way ANOVA with Dunnett’s test for c-i, l.
Figure 3.
Figure 3.. High protein diets accelerate atherogenesis through macrophage mTORC1 signaling.
(a) Summary of experimental protocol for in vivo assessment of atherosclerosis in control and macrophage-specific Raptor-null (mϕ-Raptor-KO) mice (all on ApoE-KO background). (b) Quantification of atherosclerotic plaque burden using Oil Red O-stained aortic root sections from mice fed standard or high protein Western diets for 8 weeks; representative roots shown on right (Control: n=26; mϕRaptor-KO: n=21). (c-e) Plaque composition quantified by immunofluorescence staining of aortic root sections for (c) macrophage (MOMA-2+) (Control: n=6; mϕRaptor-KO: n=6), (d) apoptosis (TUNEL+) (Control: n=13; mϕRaptor-KO: n=13), (e) and necrotic core (acellular) (Control: n=8; mϕRaptor-KO: n=7). (f) Quantification of atherosclerotic plaque burden using Oil Red O-stained aortic root sections from Control and macrophage-specific Raptor-null (mϕRaptor-KO, on ApoE-KO background) mice fed standard or high protein Western diets for 8 weeks; representative roots shown on right (Control Std. WD: n=9, HP WD: n=9; mϕRaptor-KO Std. WD: n=15, HP WD: n=15). (g-i) Plaque composition quantified by immunofluorescence staining of aortic root sections for (g) macrophage (MOMA-2+) (Control Std. WD: n=9, HP WD: n=9; mϕ-Raptor-KO Std. WD: n=7, HP WD: n=10), (h) apoptosis (TUNEL+) (Control Std. WD: n=5, HP WD: n=5; mϕRaptor-KO Std. WD: n=10, HP WD: n=10), and (i) necrotic core (acellular) (Control Std. WD: n=7, HP WD: n=8; mϕRaptor-KO Std. WD: n=10; HP WD: n=9). Data are presented as mean ±SEM. *P < 0.05, **P < 0.01, two-tailed unpaired t-test for b-e, two-way ANOVA for f-i.
Figure 4.
Figure 4.. Leucine-mediated activation of mTORC1 synergizes with atherogenic lipids to induce mitochondrial-dependent apoptosis of macrophages.
(a,b) Macrophages were treated with vehicle, 50μM 7-ketocholesterol (7KC) with or without leucine (1.91 mM) and apoptosis assessed by (a) Caspase-3/7 immunofluorescence staining (-aa: n=11; -aa+7KC: n=13; Leu: n=10; Leu+7KC: n=10) and (b) flow cytometry analysis of Annexin V/propidium iodide (PI) staining (7KC: n=3; Leu+7KC: n=3). Quantification is shown on the right of representative images and plots. (c) Control and Raptor KO macrophages subjected to similar Caspase-3/7 (Control 7KC: n=8, Leu+7KC: n=9; Raptor KO 7KC: n=16, Leu+7KC: n=11) and Annexin V/PI (n=3/group) assays to (a,b). (d) Activity of caspase-8 (n=6/group) and caspase-9 (n=5/group) in macrophages incubated with 7KC +/− leucine using a luminescence assay. (e-g) Measurement of the synergistic effect of leucine in FCCP-induced apoptosis. (e) Control and Raptor KO were treated with FCCP +/− leucine and apoptosis assessed by Caspase-3/7 immunofluorescence (Control FCCP: n=18, Leu+FCCP: n=20; Raptor KO FCCP: n=18, Leu+FCCP: n=19) and flow cytometry of AnnexinV/PI staining (Control FCCP: n=2, Leu+FCCP: n=2; Raptor KO FCCP: n=3, Leu+FCCP: n=3). (f) Activity of caspase-8 and caspase-9 in macrophages incubated with FCCP +/− leucine using a luminescence assay (n=5/group). (g) Immunoblot analysis and quantification of caspase-9 and cleaved caspase-9 in macrophages incubated with FCCP +/− leucine (normalized to Ponceau S staining as a loading control) (n=3/group). Data are presented as mean ±SEM. *P < 0.05, ***P < 0.001, NS=not significant, one-way ANOVA with Tukey’s test for a, two-tailed unpaired t-test for b,d,f,g, two-way ANOVA for c,e.
Figure 5.
Figure 5.. Leucine-mediated activation of mTORC1 leads to accumulation of dysfunctional mitochondria and ROS production in macrophages.
(a) Macrophages were treated with vehicle or 40μM rotenone with or without leucine (1.91 mM) for 6 hours and mitochondrial dysfunction evaluated as a ratio of reduced mitochondrial membrane potential (Δψm) (MitoTracker Red) vs mitochondrial mass (MitoTracker Green) by FACS analysis. Quantification is shown on the right of representative plots (-aa: n=3; -aa+Rot: n=4; Leu: n=4; Leu+Rot: n=4). (b) FACS analysis of mitochondria ROS (as assessed by MitoSOX labeling) in macrophages treated with rotenone +/− leucine for 24h (n=3/group). (c) Quantification of intracellular ROS levels using fluorescence microscopy of DHE-stained macrophages treated with rotenone +/− leucine for 12 hours (-aa: n=45; -aa+Rot: n=49; Leu: n=49; Leu+Rot: n=49 cells). (d-f) Raptor KO macrophages subjected to similar mitochondrial assays to (a-c) including (d) membrane potential Δψm (n=4/group), (e) mitoSOX (n=3/group), and (f) DHE-staining (Rot: n=18; Leu+Rot: n=23 cells). (g) Plaque macrophages were isolated from atherosclerotic aortas of Control and macrophage-specific Raptor-KO mice (mϕ-Raptor-KO, on ApoE-KO background) fed 2 months of standard or high protein Western diets and the degree of mitochondrial dysfunction determined by labeling with MitoTracker Red (Δψm) and MitoTracker Green (mitochondrial mass) followed by FACS analysis (Control: n=3/group; mϕRaptor-KO: n=7/group). (h) Similar experiments as in (g) conducted on a cohort of ApoE-KO mice and mitochondrial dysfunction determined by labeling for TMRE followed by FACS analysis (n=4/group). For all graphs, data are presented as mean ±SEM. Data are presented as mean ±SEM. *P < 0.05, **P < 0.01, ***P < 0.001, NS=not significant, one-way ANOVA with Tukey’s test for a-c, two-tailed unpaired t-test for d,e,f,h, two-way ANOVA for g.
Figure 6.
Figure 6.. Leucine-mediated activation of mTORC1 inhibits mitophagy in macrophages.
(a) The degree of LC3 co-localization with the mitochondrial marker COXIV determined by immunofluorescence microscopy of control and Raptor KO macrophages treated with rotenone for 3 hours (Control Rot.: n=30, Leu+ Rot.: n=30; Raptor KO Rot.: n=44, Leu+ Rot.: n=39 cells). (b,c) Live fluorescence imaging of Control (b) and Raptor KO (c) macrophages transduced with mt-Keima lentiviral vector followed by incubation with amino acid-free medium or the addition of CCCP +/− leucine. Representative images shown on left and quantification shown on right (Control -aa: n=15, -aa+CCCP: n=12, Leu+CCCP: n=16; Raptor KO -aa: n=24; -aa+CCCP: n=15, Leu+CCCP: n=15). (d,e) Aortic root sections from ApoE−/− mice fed a standard or high protein Western diet for 2 months were immunostained for LC3 and COXIV. The degree of LC3 intensity (d) and LC3 / COXIV co-localization (e) in aortic macrophages determined by immunofluorescence microscopy (n=6 mice/group). (f) Quantification number of LC3 puncta by immunofluorescence microscopy in control and ATG5-KO macrophages incubated with regular medium or amino acid-free medium with and without leucine for 30 minutes (Control +aa: n=52, -aa: n=48, Leu: n=52; ATG5 KO +aa: n=51, -aa: n=52, Leu: n=50). (g) The degree of LC3 co-localization with the mitochondrial marker COXIV was determined by immunofluorescence microscopy of control and ATG5-KO macrophages treated with rotenone for 3 hours (Control Rot.: n=52, Leu+Rot.: n=46; ATG5 KO Rot.: n=30, Leu+Rot.: n=30). (h) Live fluorescence imaging of ATG5-KO macrophages transduced with mt-Keima lentiviral vector followed by incubation with amino acid-free medium or the addition of CCCP +/− leucine. Representative images shown on left and quantification shown on right (aa: n=13; -aa+CCCP: n=23; Leu+CCCP: n=34). (i) ATG5-KO macrophages were treated with vehicle or 40μM rotenone with or without leucine for 6 hours and mitochondrial dysfunction quantified as a ratio of reduced mitochondrial membrane potential (Δψm) (MitoTracker Red) vs mitochondrial mass (MitroTracker Green) by FACS analysis (n=3/group). (j) ATG5-KO macrophages were co-incubated with vehicle or FCCP +/− leucine and percent of caspase 3/7-positive cells were quantified in three independent experiments (-aa: n=16; -aa+CC: n=19; Leu: n=15; Leu+CC: n=18). Data are presented as mean ±SEM. *P < 0.05, **P < 0.01, ***P < 0.001, two-tailed unpaired t-test for a,d,e, one-way ANOVA with Tukey’s test for b,c,f-j.
Figure 7.
Figure 7.. Autophagy deficiency reverses the atheroprotective effect of Raptor silencing in macrophages.
(a) Quantification of atherosclerotic plaque burden in Control, mϕRaptor-KO, mϕATG5-KO, and dual mϕRaptor/ mϕATG5-KO (DKO) mice (all ApoE-null background) mice fed a standard Western diet for 8 weeks using Oil Red O-stained aortic root sections with representative roots shown on right (Control: n=11; mϕRaptor-KO: n=16; mϕATG5-KO: n=9; DKO: n=17). (b-d) Plaque composition quantified by immunofluorescence staining of aortic root sections for (b) macrophage (MOMA-2+) (Control: n=6; mϕRaptor-KO: n=16; mϕATG5-KO: n=9; DKO: n=18),, (c) apoptosis (TUNEL+) (Control: n=14; mϕRaptor-KO: n=16; mϕATG5-KO: n=6; DKO: n=11),, (d) and necrotic core (acellular) (Control: n=11; mϕRaptor-KO: n=14; mϕATG5-KO: n=7; DKO: n=15). (e) Quantification of atherosclerotic plaque burden using Oil Red O-stained aortic root sections from Control and mϕATG5-KO mice (all on ApoE-null background) fed standard or high protein Western diets for 8 weeks; representative roots shown on right (Control Std. WD: n=10, HP WD: n=9; mϕ-ATG5-KO Std. WD: n=16, HP WD: n=11). (f-h) Plaque composition quantified by immunofluorescence staining of aortic root sections for (f) macrophage (MOMA-2+) (Control Std. WD: n=6, HP WD: n=6; mϕ-ATG5-KO Std. WD: n=11, HP WD: n=9), (g) apoptosis (TUNEL+) (Control Std. WD: n=9, HP WD: n=8; mϕ-ATG5-KO Std. WD: n=11, HP WD: n=19), (h) and necrotic core (acellular) (Control WD: n=6, HP WD: n=7; mϕ-ATG5-KO Std. WD: n=7, HP WD: n=9). Data presented as mean ±SEM. *P < 0.05, **P < 0.01, ***P < 0.001, NS=not significant, two-way ANOVA for a-h.
Figure 8.
Figure 8.. Leucine activates mTORC1 signaling and regulates downstream targets in a dosage dependent manner.
(a-h) Macrophage were incubated with amino acid-free media supplemented with increasing concentrations of leucine (80, 200, 400, and 800 uM) and various assays conducted as follows: (a) Western blot analysis of macrophage mTORC1 activity after 30min of incubation with leucine, (b) Quantification of the co-localization between mTOR and Lamp2 by immunofluorescence imaging of macrophages after 15min incubation with leucine (cells per group: 80μM: n=38; 200μM: n=39; 400μM: n=40; 800 μM: n=43), (c,d) Quantification of LC3 puncta (c) (cells per group: 80μM: n=51; 200μM: n=51; 400μM: n=43; 800 μM: n=51) and co-localization of the mitochondrial marker COX IV with LC3 (d) (cells per group: 80μM: n=28; 200μM: n=49; 400μM: n=37; 800 μM: n=40). (e) Quantification of mitochondrial dysfunction evaluated as a ratio of reduced mitochondrial membrane potential (Δψm) (MitoTracker Red) vs mitochondrial mass (MitoTracker Green) by FACS analysis in macrophage treated with 40μM rotenone with or without leucine (n=6/group). (f) Quantification of intracellular ROS levels using fluorescence microscopy of DHE-stained macrophages treated with rotenone +/− leucine for 12 hours (cells per group: 80μM: n=31; 200μM: n=31; 400μM: n=29; 800 μM: n=39). (g.h) Apoptosis assessed by Caspase-3/7 immunofluorescence staining of macrophages treated with (g) 50μM 7-ketocholesterol (7KC) +/− leucine (quantified images fields for 80μM: n=11; 200μM: n=10; 400μM: n=11; 800 μM: n=7) and (h) FCCP +/− leucine (quantified image fields for 80μM: n=10; 200μM: n=11; 400μM: n=10; 800 μM: n=10). Data are presented as mean ±SEM. **P < 0.01, ***P < 0.001, NS=not significant, one-way ANOVA with Tukey’s test.
Figure 9.
Figure 9.. Graphical summary of the progression of events from ingestion of a protein meal to deleterious effects on atherosclerotic plaque complexity.
Ingestion and digestion of dietary protein first leads to an acute rise in blood amino acid levels and in turn tissue amino acid levels (including the atherosclerotic plaque). Upon exposure to rising amino acid levels, mTORC1 is activated in plaque macrophages. A critical downstream effect of activated mTORC1 is inhibition of mitochondrial autophagy (mitophagy). The resultant buildup of dysfunctional mitochondria triggers intrinsic apoptosis pathway. Enhanced apoptosis of plaque macrophages contributes to necrotic core formation and a rise in plaque complexity (a surrogate of the vulnerable plaque).

References

    1. Moore KJ & Tabas I Macrophages in the pathogenesis of atherosclerosis. Cell 145, 341–355, doi:10.1016/j.cell.2011.04.005 (2011). - DOI - PMC - PubMed
    1. Gardner CD et al. Comparison of the Atkins, Zone, Ornish, and LEARN diets for change in weight and related risk factors among overweight premenopausal women: the A TO Z Weight Loss Study: a randomized trial. JAMA : the journal of the American Medical Association 297, 969–977, doi:10.1001/jama.297.9.969 (2007). - DOI - PubMed
    1. Halton TL et al. Low-carbohydrate-diet score and the risk of coronary heart disease in women. The New England journal of medicine 355, 1991–2002, doi:10.1056/NEJMoa055317 (2006). - DOI - PubMed
    1. Hu FB et al. Dietary protein and risk of ischemic heart disease in women. Am J Clin Nutr 70, 221–227 (1999). - PubMed
    1. Lagiou P et al. Low carbohydrate-high protein diet and incidence of cardiovascular diseases in Swedish women: prospective cohort study. BMJ 344, e4026, doi:10.1136/bmj.e4026 (2012). - DOI - PMC - PubMed

Publication types

Substances