Review
. 2020 May 1;41(3):bnaa004.
doi: 10.1210/endrev/bnaa004.

Metabolically Healthy Obesity

Affiliations
Review

Metabolically Healthy Obesity

Matthias Blüher. Endocr Rev. .

Abstract

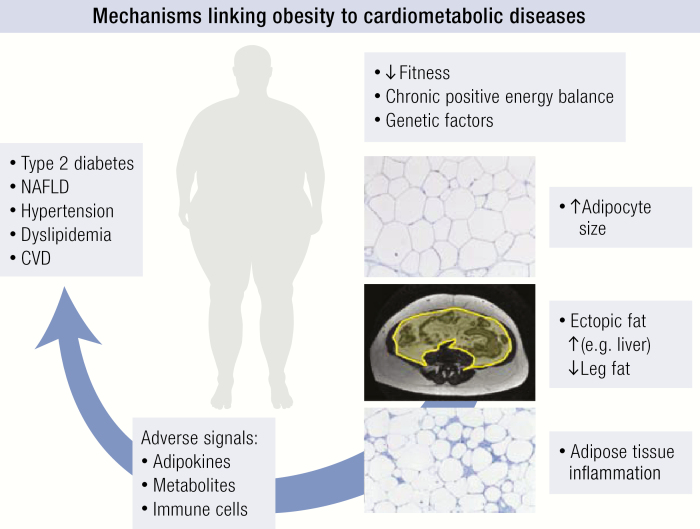
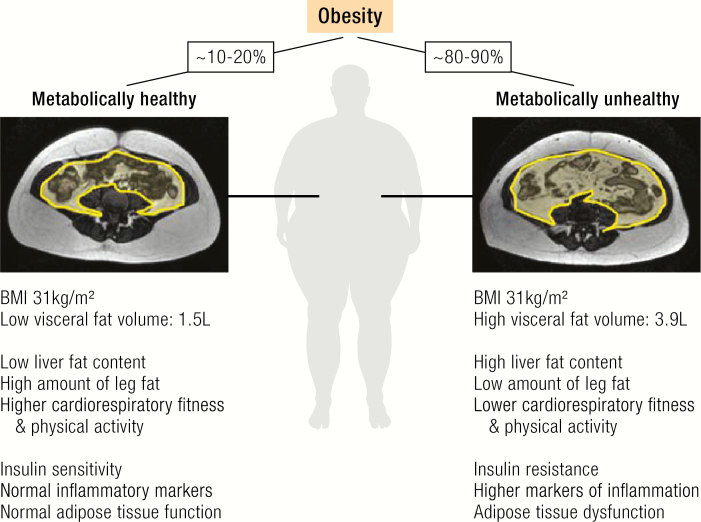
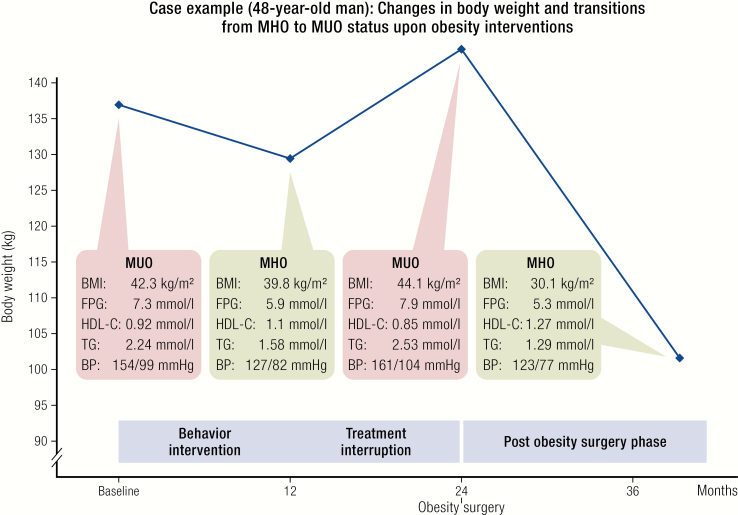
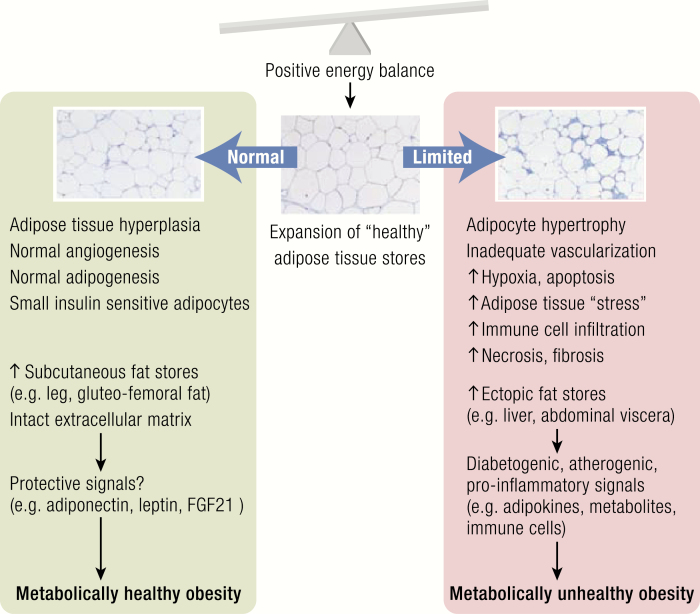
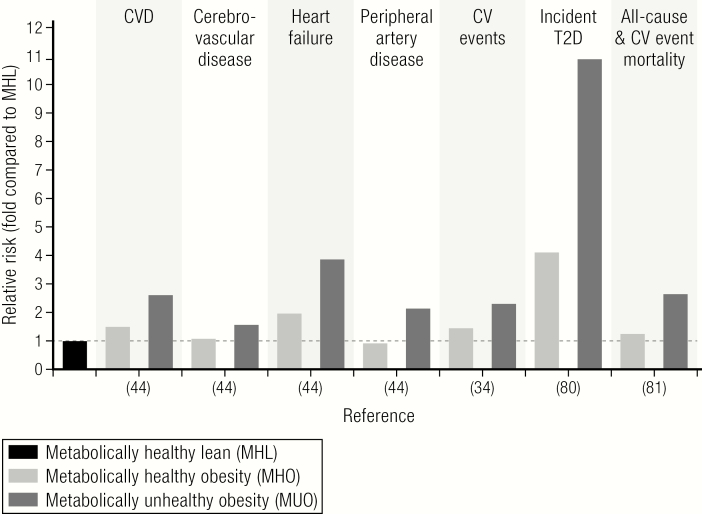
Obesity contributes to reduced life expectancy, impaired quality of life, and disabilities, mainly in those individuals who develop cardiovascular diseases, type 2 diabetes, osteoarthritis, and cancer. However, there is a large variation in the individual risk to developing obesity-associated comorbid diseases that cannot simply be explained by the extent of adiposity. Observations that a proportion of individuals with obesity have a significantly lower risk for cardiometabolic abnormalities led to the concept of metabolically healthy obesity (MHO). Although there is no clear definition, normal glucose and lipid metabolism parameters-in addition to the absence of hypertension-usually serve as criteria to diagnose MHO. Biological mechanisms underlying MHO lower amounts of ectopic fat (visceral and liver), and higher leg fat deposition, expandability of subcutaneous adipose tissue, preserved insulin sensitivity, and beta-cell function as well as better cardiorespiratory fitness compared to unhealthy obesity. Whereas the absence of metabolic abnormalities may reduce the risk of type 2 diabetes and cardiovascular diseases in metabolically healthy individuals compared to unhealthy individuals with obesity, it is still higher in comparison with healthy lean individuals. In addition, MHO seems to be a transient phenotype further justifying therapeutic weight loss attempts-even in this subgroup-which might not benefit from reducing body weight to the same extent as patients with unhealthy obesity. Metabolically healthy obesity represents a model to study mechanisms linking obesity to cardiometabolic complications. Metabolically healthy obesity should not be considered a safe condition, which does not require obesity treatment, but may guide decision-making for a personalized and risk-stratified obesity treatment.


Figures

Graphical Abstract
Graphical Abstract
Figure 1.
Figure 1.
Phenotypic traits associated with metabolically healthy versus unhealthy obesity. Individuals with metabolically healthy obesity (MHO, prevalence ~10–30%) are characterized by lower liver and visceral fat mass, higher leg fat content, greater cardiorespiratory fitness and physical activity, insulin sensitivity, normal inflammation markers, and preserved adipose tissue function compared to patients with metabolically unhealthy obesity (MUO, prevalence ~80–90%). Transabdominal MRI scans with highlighted (yellow) visceral fat depot area from 2 women with the same age and BMI, but either MHO or MUO show ~2.6-fold higher visceral fat deposition associated with MUO (pictures provided by Nicolas Linder).
Figure 2.
Figure 2.
Metabolically healthy obesity is a transient phenotype. Case example for a 48-year-old man undergoing different weight-loss interventions. At baseline, the patient presented with MUO as defined by reference (31). After 12 months of a behavior intervention program (calorie restricted diet, increased physical activity, and psychosocial support), the phenotype changed into MHO. Because treatment was not continued for the subsequent 12 months, there was a weight regain associated with a phenotype transition to MUO. At 24 months, the patient underwent a laparoscopic Roux-en-Y gastric bypass surgery, which resulted in significant weight loss and improvements in all criteria defining MHO. The case demonstrates that transitions between MUO and MHO are not unidirectional and may change over time, for instance in response to weight-loss interventions. Abbreviations: BMI, body mass index; BP, blood pressure; FPG, fasting plasma glucose; HDL-C, high-density lipoprotein cholesterol; TG, triglycerides.
Figure 3.
Figure 3.
Adipose tissue dysfunction and development of metabolically unhealthy obesity. A chronically positive energy balance requires expansion of adipose tissue (AT) to store excess energy. Adipose tissue responds to higher storage demands by increasing the adipocyte number through adipogenesis from precursor cells (hyperplasia) and through adipocyte hypertrophy. If expansion of healthy fat stores (eg, subcutaneous leg fat) and the ability of AT to respond to excess calorie intake with (“healthier”) hyperplasia are impaired, AT dysfunction may develop, which is characterized by ectopic fat deposition (eg, liver, abdominal visceral depots, skeletal muscle, pancreas) and a sequence from adipocyte hypertrophy, hypoxia, inadequate vascularization, AT stress, and immune cell infiltration, apoptosis, and increased production of profibrotic extracellular matrix proteins contributing to fibrosis. Adipose tissue dysfunction leads to the release of proinflammatory, diabetogenic, and atherogenic signals (eg, adipokines, fatty acids from increased lipolysis, other metabolites, immune cells), which may contribute to end organ damage (eg, liver, skeletal muscle, pancreas, vasculature) and the development of metabolically unhealthy obesity. In contrast, healthy expansion of AT leads to metabolically healthy obesity through an increased AT storage capacity (serving as a safe “metabolic sink”) and the secretion of a beneficial adipokine profile (eg, adiponectin, FGF-21, leptin) (adapted from references (60, 61).
Figure 4.
Figure 4.
Risk of CVD and cardiovascular events, type 2 diabetes (T2D), and all-cause and/or CVD event mortality in MHO. Metabolically healthy lean (MHL) served as a reference group, and the mean relative risk for incident diseases, events, or mortality was compared between the MHO group (defined as absence of any metabolic abnormalities) and a group of individuals with MUO. Data are extracted from previous meta-analyses (34, 79, 80) or a large recent cohort study (43). For data from reference (44), only the subgroup of MUO with 3 metabolic comorbidities (= highest relative risk) is displayed despite evidence for gradually increasing risk (in all categories) with the increased number of metabolic abnormalities (ranging from 1–3).

Similar articles

Cited by

References

    1. NCD Risk Factor Collaboration (NCD-RisC). Worldwide trends in body-mass index, underweight, overweight, and obesity from 1975 to 2016: a pooled analysis of 2416 population-based measurement studies in 128·9 million children, adolescents, and adults. Lancet. 2017;390(10113):2627–2642. - PMC - PubMed
    1. NCD Risk Factor Collaboration (NCD-RisC). Trends in adult body-mass index in 200 countries from 1975 to 2014: a pooled analysis of 1698 population-based measurement studies with 19·2 million participants. Lancet. 2016;387(10026):1377–1396. - PMC - PubMed
    1. Blüher M. Obesity: global epidemiology and pathogenesis. Nat Rev Endocrinol. 2019;15(5):288–298. - PubMed
    1. Fontaine KR, Redden DT, Wang C, Westfall AO, Allison DB. Years of life lost due to obesity. JAMA. 2003;289(2):187–193. - PubMed
    1. Berrington de Gonzalez A, Hartge P, Cerhan JR, et al. Body-mass index and mortality among 1.46 million white adults. N Engl J Med. 2010;363(23):2211–2219. - PMC - PubMed