Comparative Study
. 2020 Jun 1;37(6):1647-1656.
doi: 10.1093/molbev/msaa033.

Origins, Admixture Dynamics, and Homogenization of the African Gene Pool in the Americas

Affiliations
Comparative Study

Origins, Admixture Dynamics, and Homogenization of the African Gene Pool in the Americas

Mateus H Gouveia et al. Mol Biol Evol. .

Abstract

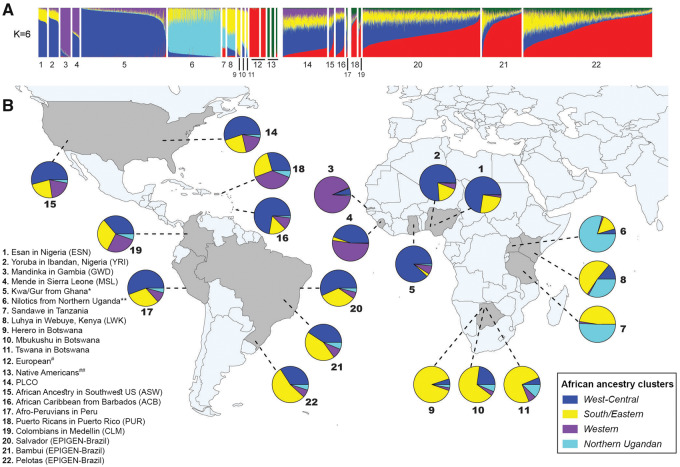
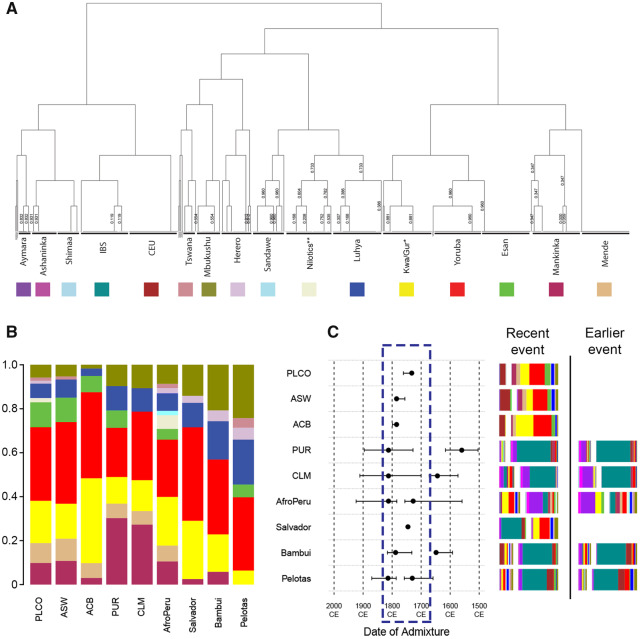
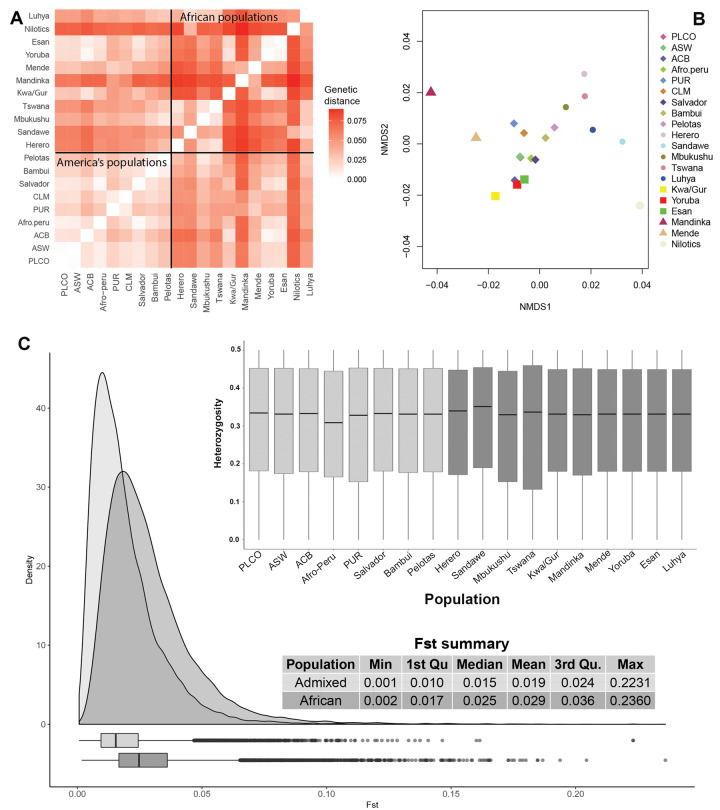
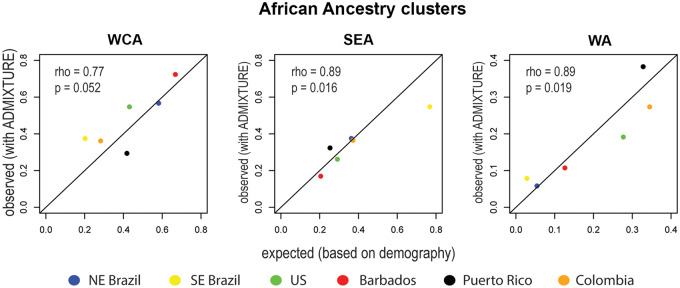
The Transatlantic Slave Trade transported more than 9 million Africans to the Americas between the early 16th and the mid-19th centuries. We performed a genome-wide analysis using 6,267 individuals from 25 populations to infer how different African groups contributed to North-, South-American, and Caribbean populations, in the context of geographic and geopolitical factors, and compared genetic data with demographic history records of the Transatlantic Slave Trade. We observed that West-Central Africa and Western Africa-associated ancestry clusters are more prevalent in northern latitudes of the Americas, whereas the South/East Africa-associated ancestry cluster is more prevalent in southern latitudes of the Americas. This pattern results from geographic and geopolitical factors leading to population differentiation. However, there is a substantial decrease in the between-population differentiation of the African gene pool within the Americas, when compared with the regions of origin from Africa, underscoring the importance of historical factors favoring admixture between individuals with different African origins in the New World. This between-population homogenization in the Americas is consistent with the excess of West-Central Africa ancestry (the most prevalent in the Americas) in the United States and Southeast-Brazil, with respect to historical-demography expectations. We also inferred that in most of the Americas, intercontinental admixture intensification occurred between 1750 and 1850, which correlates strongly with the peak of arrivals from Africa. This study contributes with a population genetics perspective to the ongoing social, cultural, and political debate regarding ancestry, admixture, and the mestizaje process in the Americas.

Keywords: mestizaje; African diaspora; Transatlantic Slave Trade; admixture dynamics.


Figures

<sc>Fig</sc>. 1.
Fig. 1.
Ancestry analysis of African and admixed populations of the Americas inferred using ADMIXTURE (K = 6). (A) Vertical bar plot showing the total African, European, and Native American proportions of the ancestry clusters (supplementary fig. S1 and section S2.6.1, Supplementary Material online). (B) Percentages of subcontinental African ancestry clusters. For admixed populations of the American continent these percentages are relative to the total African ancestry (i.e., the sum of the four African-associated clusters: West-Central, Western, Southern/Eastern, Northern Ugandan). The arrows on the map represent the regions from where the samples were collected. *The Kwa/Gur data set includes approximately 35 ethno-linguistic groups, predominantly from the Kwa and Gur Niger-Congo linguistic group (Gouveia et al. 2019). **The Nilotics data set includes predominantly three ethno-linguistic groups in Northern Uganda (Langi, Acholi, and Lugbara) from the Nilotic linguistic group (Gouveia et al. 2019) ; #the Europeans are: Iberian Population in Spain (IBS) and Utah residents with Northern and Western European ancestry (CEU), in this order in the ADMIXTURE bar plot; ##The Native Americans are: Shimaa, Ashaninka, and Aymara, respectively from Borda V et al. (2019); the PLCO (Prostate, Lung, Colorectal, and Ovarian Cancer Screening) data comprised African-Americans from East United States.
<sc>Fig</sc>. 2.
Fig. 2.
Haplotype-based clustering of parental individuals and admixture inferences for admixed American continent populations. (A) fineSTRUCTURE tree of parental individuals. *The Kwa/Gur data set includes approximately 35 ethno-linguistic groups, predominantly from the Kwa and Gur linguistic group (Gouveia et al. 2019). **The Nilotics data set includes predominantly three ethno-linguistic groups from Northern Uganda (Langi, Acholi, and Lugbara) of the Nilotic linguistic group (Gouveia et al. 2019). (B) Subcontinental contributions relative to the total African ancestry in admixed populations inferred by the MIXTURE MODEL (supplementary section S2.3, Supplementary Material online). (C) GLOBETROTTER inference of admixture events for each admixed population. Inferred date(s) and 95% confidence intervals are represented by dots and horizontal lines in the graph. Dashed rectangle in the admixture dates plots highlights the most dynamic period for admixture. Beside the dating graph, we represented the inferred admixing sources (bars) for recent and earlier events. Bar size represents the genetic contribution of the source. Each color corresponds to the proportion of each parental population contribution. CEU, Utah Residents (CEPH) with Northern and Western Ancestry-United States, IBS, Iberian population in Spain; CLM, Colombians from Medellin; PUR, Puerto Ricans from Puerto Rico; ACB, African Caribbeans in Barbados; ASW, African Americans in Southwest United States; PLCO, African Americans from East United States.
<sc>Fig</sc>. 3.
Fig. 3.
Pairwise genetic distances of the African gene pool between populations of the American continent and Africa. (A) Heatmap Matrix and (B) multidimensional scaling of the African gene pool genetic distances. We used solid squares, triangles, and circles to represent populations associated with WCA, West-Central Africa; SEA, South/East Africa; WA, Western Africa ancestry clusters. CLM, Colombians from Medellin; PUR, Puerto Ricans from Puerto Rico; ACB, African Caribbeans in Barbados; ASW, Americans of African ancestry in South western United States; PLCO, African-Americans from Eastern United States. (C) SNPs FST distributions between: 1) African populations that contributed to the African Diaspora (dark gray) and 2) American continent populations (gray), considering only chromosome fragments of African origin; and the within-population African genetic heterozygosity in the Americas and Africa. The CLM population was not included in this analysis because it did not have enough SNPs inferred as being of African origin.
<sc>Fig</sc>. 4.
Fig. 4.
Observed and expected proportions of genomic African ancestry clusters in the Americas. We compared 1) the observed proportions of genomic African ancestry clusters (inferred using ADMIXTURE [Alexander et al. 2009]) in the vertical axis, with 2) expected proportions of genomic African ancestry clusters, estimated based on demographic historical records from the African Voyages Database1, in the horizontal axis (see supplementary table S3, Supplementary Material online). rho, Spearman’s coefficients of correlation; p, p value significance. The significance was evaluated using randomization tests of 10,000 replications. WCA, West-Central Africa; SEA, South/East Africa; WA, Western Africa.

References

    1. Alexander DH, Novembre J, Lange K.. 2009. Fast model-based estimation of ancestry in unrelated individuals. Genome Res. 19(9):1655–1664. - PMC - PubMed
    1. Alves-Silva J, da Silva Santos M, Guimarães PE, Ferreira AC, Bandelt HJ, Pena SD, Prado VF.. 2000. The ancestry of Brazilian mtDNA lineages. Am J Hum Genet. 67(2):444–461. - PMC - PubMed
    1. Baharian S, Barakatt M, Gignoux CR, Shringarpure S, Errington J, Blot WJ, Bustamante CD, Kenny EE, Williams SM, Aldrich MC, et al. 2016. The Great Migration and African-American genomic diversity. PLoS Genet. 12(5):e1006059. - PMC - PubMed
    1. Borda V, Alvim I, Aquino MM, Silva C, Soares-Souza GB, Leal TP, Scliar MO, Zamudio R, Zolini C, Padilla C, et al. 2020. The genetic structure and adaptation of Andean highlanders and Amazonian dwellers is influenced by the interplay between geography and culture. bioRxiv [Internet]:2020.01.30.916270. Available from: https://www.biorxiv.org/content/10.1101/2020.01.30.916270v2, last accessed February 20, 2020. - DOI
    1. Bryc K, Auton A, Nelson MR, Oksenberg JR, Hauser SL, Williams S, Froment A, Bodo J-M, Wambebe C, Tishkoff SA, et al. 2010. Genome-wide patterns of population structure and admixture in West Africans and African Americans. Proc Natl Acad Sci U S A. 107(2):786–791. - PMC - PubMed

Publication types