Review
. 2020 Apr;107(4):871-885.
doi: 10.1002/cpt.1796. Epub 2020 Mar 3.

An Introduction to Machine Learning

Affiliations
Review

An Introduction to Machine Learning

Solveig Badillo et al. Clin Pharmacol Ther. 2020 Apr.

Abstract

In the last few years, machine learning (ML) and artificial intelligence have seen a new wave of publicity fueled by the huge and ever-increasing amount of data and computational power as well as the discovery of improved learning algorithms. However, the idea of a computer learning some abstract concept from data and applying them to yet unseen situations is not new and has been around at least since the 1950s. Many of these basic principles are very familiar to the pharmacometrics and clinical pharmacology community. In this paper, we want to introduce the foundational ideas of ML to this community such that readers obtain the essential tools they need to understand publications on the topic. Although we will not go into the very details and theoretical background, we aim to point readers to relevant literature and put applications of ML in molecular biology as well as the fields of pharmacometrics and clinical pharmacology into perspective.


Conflict of interest statement

All authors declared no competing interests for this work.

Figures
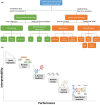
Figure 1
Figure 1
Taxonomy and overview of main machine learning (ML) algorithms. (a) Taxonomy of the different methods presented. (b) Overview of ML methods. The spectrum of available methods ranges from simpler and more interpretable to more advanced algorithms with potentially higher performance at the expense of less interpretability. Position of methods on the figure is qualitative and in practice depends on the number of free parameters, model complexity, data type, and the exact definition of interpretability used.8PCA, principal component analysis; SVM, support vector machine; tSNE, t‐distributed stochastic neighbor embedding; UMAP, uniform manifold approximation and projection.
Figure 2
Figure 2
Overview of the results of different clustering approaches. (a) Shows the results of a two‐dimensional hierarchical clustering. The two dendrograms visualize the similarity across samples and also across the markers measured. Such visualization is frequently used in biology for gene expression or other ‐omics technology readouts. (b) Shows the outcome of a classical clustering using k‐means with a selected value of k = 2. Resulting clusters are usually convex and every point is assigned to one cluster, namely the one which is represented by the closest center point (marked by X). (c) Shows the result of a density‐based clustering. Please note that the approach can identify nonconvex cluster forms, such as the orange cluster.
Figure 3
Figure 3
Illustration of the underfitting/overfitting issue on a simple regression case. Data points are shown as blue dots and model fits as red lines. Underfitting occurs with a linear model (left panel), a good fit with a polynomial of degree 4 (center panel), and overfitting with polynomial of degree 20 (right panel). Root mean squared error is chosen as objective function for evaluating the training error and the generalization error, assessed by using 10‐fold cross‐validation.
Figure 4
Figure 4
Illustration of the general principles of supervised learning in the case of a limited dataset. To assess the generalization ability of a supervised learning algorithm, data are separated into a training subset used for building the model and a test subset used to assess he generalization error.
Figure 5
Figure 5
Confusion matrix for two‐class problems. The confusion matrix indicates how successful the algorithm was at predicting labels in a binary classification problem where labels take values 0 (called “negative”) or 1 (called “positive”) by evaluating the predicted vs. the real labels. Every data point in the test set belongs to one of the four categories and different measures can be derived from these numbers.
Figure 6
Figure 6
Illustration of support vector machine (SVM) principles. (a) Illustration of a simple case where hyperplane separate two groups directly in inputs space. (b) Illustration of performing nonlinear classification by implicitly mapping inputs into high‐dimensional feature spaces where data points can be separated by a hyperplane.
Figure 7
Figure 7
Neural networks. (a) Basics of feedforward neural networks. (b) Unfolding of recurrent neural networks. (c) Extensions of recurrent neural networks with gating units. Black square represents a delay of one discrete time step.

References

    1. Camacho, D.M. , Collins, K.M. , Powers, R.K. , Costello, J.C. & Collins, J.J. Next‐generation machine learning for biological networks. Cell 173, 1581–1592 (2018). - PubMed
    1. Shen, D. , Wu, G. & Suk, H.‐I. Deep learning in medical image analysis. Annu. Rev. Biomed. Eng. 19, 221–248 (2017). - PMC - PubMed
    1. Rajkomar, A. , Dean, J. & Kohane, I. Machine learning in medicine. N. Engl. J. Med. 380, 1347–1358 (2019). - PubMed
    1. Kleene, S.C. Representation of Events in Nerve Nets and Finite Automata (RAND Project Air Force, Santa Monica, CA, 1951) <https://apps.dtic.mil/docs/citations/ADA596138>.
    1. Breiman, L. Statistical modeling: the two cultures (with comments and a rejoinder by the author). Stat. Sci. 16, 199–231 (2001).

Publication types

MeSH terms