

Follow-up of late-onset Pompe disease patients with muscle magnetic resonance imaging reveals increase in fat replacement in skeletal muscles
- PMID: 32129012
- PMCID: PMC7432562
- DOI: 10.1002/jcsm.12555
Follow-up of late-onset Pompe disease patients with muscle magnetic resonance imaging reveals increase in fat replacement in skeletal muscles
Erratum in
-
Corrigendum to Nuñez-Peralta et al. J of Cachexia, Sarcopenia and Muscle, 11, 1032-1046. https://doi.org/10.1002/jcsm.12555.J Cachexia Sarcopenia Muscle. 2021 Oct;12(5):1354. doi: 10.1002/jcsm.12773. Epub 2021 Aug 15. J Cachexia Sarcopenia Muscle. 2021. PMID: 34396717 Free PMC article. No abstract available.
Abstract
Background: Late-onset Pompe disease (LOPD) is a genetic disorder characterized by progressive degeneration of the skeletal muscles produced by a deficiency of the enzyme acid alpha-glucosidase. Enzymatic replacement therapy with recombinant human alpha-glucosidase seems to reduce the progression of the disease; although at the moment, it is not completely clear to what extent. Quantitative muscle magnetic resonance imaging (qMRI) is a good biomarker for the follow-up of fat replacement in neuromuscular disorders. The aim of this study was to describe the changes observed in fat replacement in skeletal muscles using qMRI in a cohort of LOPD patients followed prospectively.
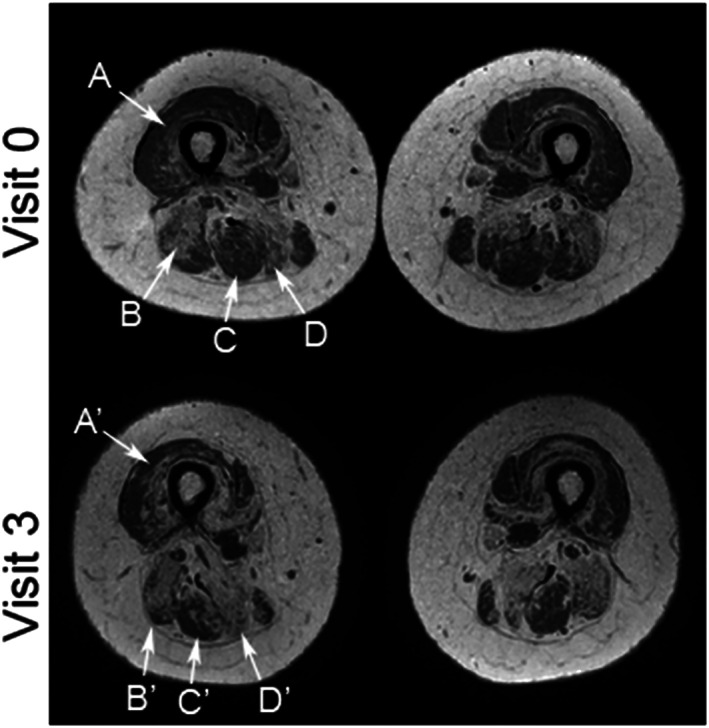
Methods: A total of 36 LOPD patients were seen once every year for 4 years. qMRI, several muscle function tests, spirometry, activities of daily living scales, and quality-of-life scales were performed on each visit. Muscle MRI consisted of two-point Dixon studies of the trunk and thigh muscles. Computer analysis of the images provided the percentage of muscle degenerated and replaced by fat in every muscle (known as fat fraction). Longitudinal analysis of the measures was performed using linear mixed models applying the Greenhouse-Geisser test.
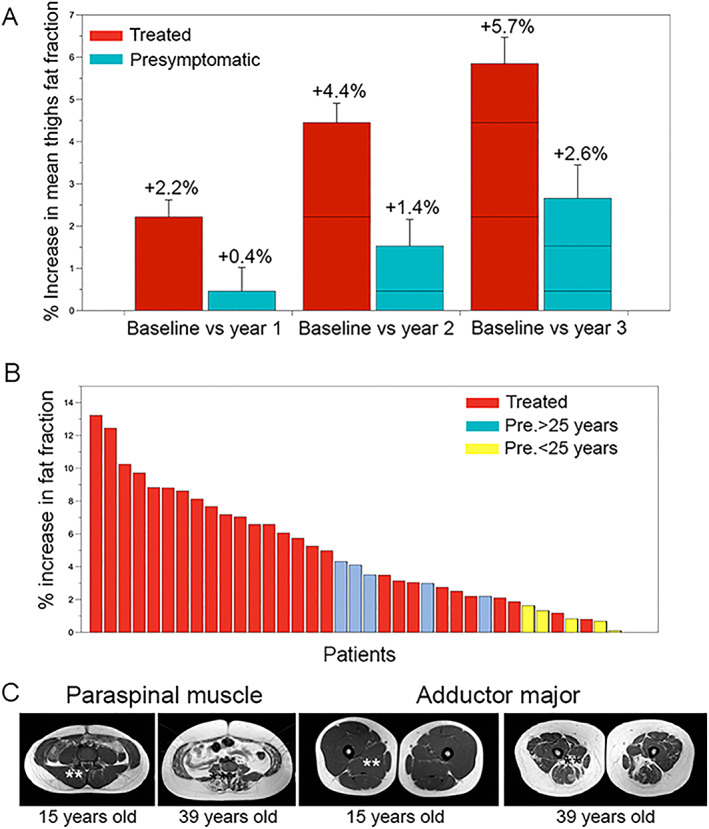
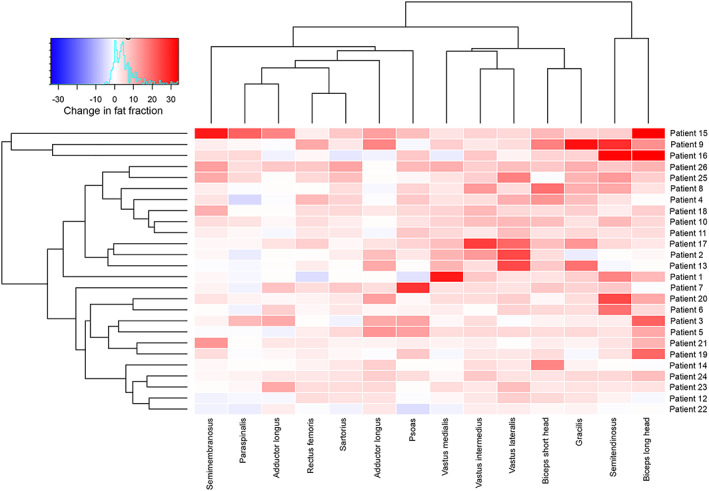
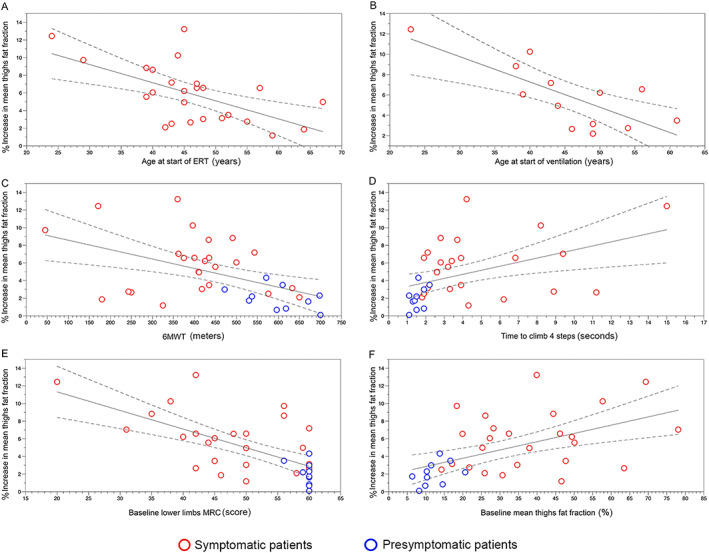
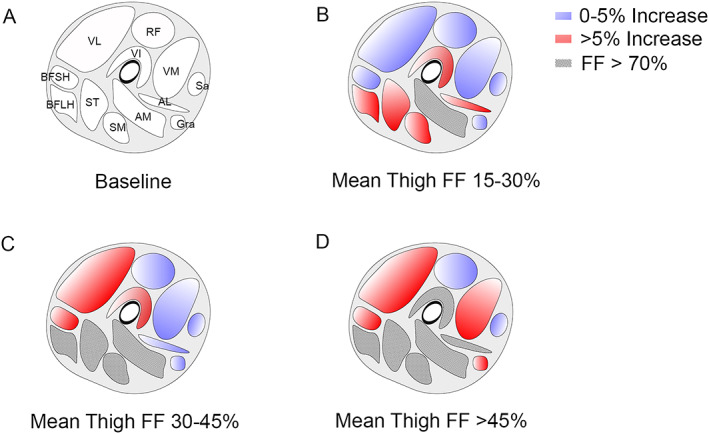
Results: We detected a statistically significant and continuous increase in mean thigh fat fraction both in treated (+5.8% in 3 years) and in pre-symptomatic patients (+2.6% in 3years) (Greenhouse-Geisser p < 0.05). As an average, fat fraction increased by 1.9% per year in treated patients, compared with 0.8% in pre-symptomatic patients. Fat fraction significantly increased in every muscle of the thighs. We observed a significant correlation between changes observed in fat fraction in qMRI and changes observed in the results of the muscle function tests performed. Moreover, we identified that muscle performance and mean thigh fat fraction at baseline visit were independent parameters influencing fat fraction progression over 4 years (analysis of covariance, p < 0.05).
Conclusions: Our study identifies that skeletal muscle fat fraction continues to increase in patients with LOPD despite the treatment with enzymatic replacement therapy. These results suggest that the process of muscle degeneration is not stopped by the treatment and could impact muscle function over the years. Hereby, we show that fat fraction along with muscle function tests can be considered a good outcome measures for clinical trials in LOPD patients.
Keywords: Enzymatic replacement therapy; Fatty replacement; Muscle MRI; Muscle degeneration; Muscle wasting; Pompe disease.
© 2020 The Authors. Journal of Cachexia, Sarcopenia and Muscle published by John Wiley & Sons Ltd on behalf of Society on Sarcopenia, Cachexia and Wasting Disorders.
Conflict of interest statement
The company has neither reviewed the data nor suggested changes in any of the conclusions of the paper. Claudia Nuñez‐Peralta, Jorge Alonso‐Pérez, Jaume Llauger, Sonia Segovia, Paula Montesinos, Izaskun Belmonte, Irene Pedrosa, Elena Montiel, Alicia Alonso‐Jiménez, Javier Sánchez‐González, and Antonio Martínez‐Noguera have no conflict of interest.
Figures
References
-
- Case LE, Beckemeyer AA, Kishnani PS. Infantile Pompe disease on ERT: update on clinical presentation, musculoskeletal management, and exercise considerations. Am J Med Genet C Semin Med Genet 2012;160C:69–79. - PubMed
-
- Kishnani P, Corzo D, Nicolino M, Byrne B, Mandel H, Hwu WL, et al. Recombinant human acid α‐glucosidase: major clinical benefits in infantile‐onset Pompe disease. Neurology 2007;68:99–109. - PubMed
-
- Schuller A, Wenninger S, Strigl‐Pill N, Schoser B. Toward deconstructing the phenotype of late‐onset Pompe disease. Am J Med Genet C Semin Med Genet 2012;160C:80–88. - PubMed
Publication types
MeSH terms
LinkOut - more resources
Full Text Sources
Other Literature Sources
Medical
Research Materials
