. 2020 Jun 18;75(7):e9-e21.
doi: 10.1093/gerona/glaa056.

Metformin Reduces Aging-Related Leaky Gut and Improves Cognitive Function by Beneficially Modulating Gut Microbiome/Goblet Cell/Mucin Axis

Affiliations

Metformin Reduces Aging-Related Leaky Gut and Improves Cognitive Function by Beneficially Modulating Gut Microbiome/Goblet Cell/Mucin Axis

Shokouh Ahmadi et al. J Gerontol A Biol Sci Med Sci. .

Abstract

Aging-related illnesses are increasing and effective strategies to prevent and/or treat them are lacking. This is because of a poor understanding of therapeutic targets. Low-grade inflammation is often higher in older adults and remains a key risk factor of aging-related morbidities and mortalities. Emerging evidence indicates that abnormal (dysbiotic) gut microbiome and dysfunctional gut permeability (leaky gut) are linked with increased inflammation in older adults. However, currently available drugs do not treat aging-related microbiome dysbiosis and leaky gut, and little is known about the cellular and molecular processes that can be targeted to reduce leaky gut in older adults. Here, we demonstrated that metformin, a safe Food and Drug Administration-approved antidiabetic drug, decreased leaky gut and inflammation in high-fat diet-fed older obese mice, by beneficially modulating the gut microbiota. In addition, metformin increased goblet cell mass and mucin production in the obese older gut, thereby decreasing leaky gut and inflammation. Mechanistically, metformin increased the goblet cell differentiation markers by suppressing Wnt signaling. Our results suggest that metformin can be used as a regimen to prevent and treat aging-related leaky gut and inflammation, especially in obese individuals and people with western-style high-fat dietary lifestyle, by beneficially modulating gut microbiome/goblet cell/mucin biology.

Keywords: Gut permeability; Inflammation; Microbiota; Mucus; Wnt signaling.


Figures

Figure 1.
Figure 1.
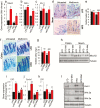
Metformin reduced high-fat diet (HFD)-induced glucose intolerance, hepatic steatosis, hypertrophy, and inflammation in adipocytes in older mice. (a) Metformin treatment significantly increased body weight in HFD-fed mice, while decreased in low-fat diet (LFD)-fed mice. (b) Metformin treatment also decreased glucose tolerance (b), the area under curve (c) in glucose tolerance test, fat accumulation in the liver (hepatic steatosis) (d), adipocyte size (e–g), and inflammation indicated by crown-like structures (e,h). (i) Metformin-treated HFD-fed mice showed reduced escape latency time (s) as an indicator of improved learning-memory behavior measured during the Water–Morris Maze test compared to their controls. (j) The rate of fluorescein isothiocyanate (FITC) appearance in the blood from the gut as a marker of leaky gut was significantly reduced in metformin-treated mice. (k–m) The mRNA expression of inflammatory markers such as TNF-α, IL-1β, and IL-6 were significantly reduced in metformin-treated mice compared to their untreated controls, specifically more significant in HFD-fed mice. Values are mean of n = 5–8 mice per group ± SEM (error bars). Values with *p < .05, **p < .01, and ***p < .001 are statistically significant between LFD-metformin versus LFD controls, while values with #p < .05, ##p < .01, and ###p < .001 are statistically significant between HFD-metformin versus HFD controls. The values indicated with ‘ns’ are not statistically significantly different.
Figure 2.
Figure 2.
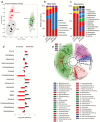
Metformin increased goblet cells, mucin via suppressing Wnt signaling and increasing goblet cell precursor markers in the gut of older obese mice. (a,b) mRNA expression of mucin 2 (Muc2) was significantly increased in the intestine (colon) of metformin-treated older mice compared to their untreated controls (a), while mRNA expression of occludin (Ocln) was also significantly increased, but only in high-fat diet (HFD)-fed mice compared to their HFD-fed controls (b). (c) No significant changes were observed in the mRNA expression of Zonulin-1 among all the groups. (d–g) Goblet cell staining with AB/PAS stain indicated that the intestinal goblet cell mass in the ileum (d,e) and colon (f,g) were significantly increased in metformin-treated older mouse gut compared to their controls. (h) Mucin 2 protein levels measured by western blots were also significantly increased in the colon and ileum of metformin-treated older mice. (i–k) Interestingly, the mRNA expression of goblet cell precursor markers like Elf3, Spdef, and Gfi1 were significantly increased in the intestine (colon) of metformin-treated older mice. (l) The protein expression of Wnt signaling mediators like Wnt3a, Wnt5a and Axin levels were significantly decreased in the gut of metformin-treated mice compared to their controls. Values are mean of n = 5–8 mice per group ± SEM (error bars). Values with *p < .05, **p < .01, and ***p < .001 are statistically significant between low-fat diet (LFD)-metformin versus LFD controls, while values with #p < .05, ##p < .01, ###p < .001 are statistically significant between HFD-metformin versus HFD controls. The values indicated with ‘ns’ are not statistically significantly different.
Figure 3.
Figure 3.
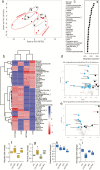
Metformin treatment beneficially modulated the gut microbiome. (a) Principal coordinate analysis showing the β-diversity clustering of the gut microbiome from older obese mice fed with low-fat diet (LFD) and high-fat diet (HFD) and treated with metformin was significantly different. (b,c) Significant changes were observed in major bacterial phyla (b), and genera (c) in the feces of older mice fed with HFD and LFD and treatment with metformin compared to their controls. (d) Linear discrimination analysis (LDA) effect size (LEfSe) analysis showing through cladogram the significantly different clustering of the gut microbiome in metformin-treated versus untreated and their diet consumption groups. (e) The abundance of major genera differed according to metformin treatment and LFD versus HFD feeding in the gut of older mice. Values are mean of n = 5 mice per group ± SEM (error bars). Values are mean of n = 5–8 mice per group ± SEM (error bars). Values with *p < .05, are statistically significant between LFD-metformin versus LFD/HFD controls.
Figure 4.
Figure 4.
Metformin modulated gut metabolome and increased the production of beneficial metabolites in the gut of older mice. (a–c) Untargeted–unbiased fecal metabolomics analyses show that metformin treatment significantly changed the production of array of metabolites shown by principal component analysis (PCA) (a), group clustering (b), and random forest analyses (c). (d,e) Similarly, volcano graph showing significantly upregulated and downregulated metabolites in metformin-treated and low-fat diet (LFD) (d) and high-fat diet (HFD)-fed older mice compared to their corresponding controls. (f–i) Abundance of butyrate (f) and taurine (g) was increased, whereas, the abundance of creatinine (h) and sarcosine (i) were in the feces of metformin-treated older mice compared to untreated controls. Values are mean of n = 5–8 mice per group ± SEM (error bars). Values with *p < .05, **p < .01, and ***p < .001 are statistically significant between LFD-metformin versus LFD controls, while values with #p < .05, ##p < .01, and ###p < .001 are statistically significant between HFD-metformin versus HFD controls. The values indicated with ‘ns’ are not statistically significantly different.
Figure 5.
Figure 5.
Metformin modulated gut microbiome plays a causal role in increasing goblet cell mass and mucin. (a) The gut microbiome composition in terms of b-diversity clustering in Principal coordinate analyses indicated significantly different gut microbiome after fecal microbiome transplantation in the recipient mice. (b) Cladogram of LefSe analysis also shows that gut microbiome composition is significantly different in recipient mice received fecal microbiome transplantation (FMT) from metformin-treated and untreated older mice. (c) Metformin-treated FMT significantly increased the intestinal goblet cell mass indicated by AB/PAS staining (blue) (c) and counting (d). (e–h) FMT of metformin-treated microbiome also significantly increased the mRNA expression of Muc2, and goblet cell precursor markers, that is, Spdef, Atoh, and Gfi1 in the gut of recipient mice compared to their controls. (i) A purported model based on our results showing that metformin improved metabolic dysfunctions, and cognitive decline by modulating gut microbiome and increasing production of beneficial metabolites which in turn can suppress Wnt signaling resulting in increased goblet cell precursors, goblet cells and mucin formation, ultimately reducing leaky gut and inflammation. Values are mean of n = 5–8 mice per group ± SEM (error bars). Values with *p < .05, **p < .01, and ***p < .001 are statistically significant between low-fat diet (LFD)-metformin versus LFD controls, while values with #p < .05, ##p < .01, are statistically significant between high-fat diet (HFD)-metformin versus HFD controls. The values indicated with “ns” are not statistically significantly different.

References

    1. Bektas A, Schurman SH, Sen R, Ferrucci L. Aging, inflammation and the environment. Exp Gerontol. 2018;105:10–18. doi: 10.1016/j.exger.2017.12.015 - DOI - PMC - PubMed
    1. Simpson RJ. Aging and inflammation: directing traffic through physical activity. Brain Behav Immun. 2016;56:10–11. doi: 10.1016/j.bbi.2016.05.015 - DOI - PubMed
    1. Nagpal R, Mainali R, Ahmadi S, et al. . Gut microbiome and aging: physiological and mechanistic insights. Nutr Healthy Aging. 2018;4:267–285. doi: 10.3233/NHA-170030 - DOI - PMC - PubMed
    1. Stehle JR Jr, Leng X, Kitzman DW, Nicklas BJ, Kritchevsky SB, High KP. Lipopolysaccharide-binding protein, a surrogate marker of microbial translocation, is associated with physical function in healthy older adults. J Gerontol A Biol Sci Med Sci. 2012;67:1212–1218. doi: 10.1093/gerona/gls178 - DOI - PMC - PubMed
    1. Buford TW, Carter CS, VanDerPol WJ, et al. . Composition and richness of the serum microbiome differ by age and link to systemic inflammation. Geroscience. 2018;40:257–268. doi: 10.1007/s11357-018-0026-y - DOI - PMC - PubMed

Publication types