. 2020 Mar 4:9:e51406.
doi: 10.7554/eLife.51406.

Proteome profile of peripheral myelin in healthy mice and in a neuropathy model

Affiliations

Proteome profile of peripheral myelin in healthy mice and in a neuropathy model

Sophie B Siems et al. Elife. .

Abstract

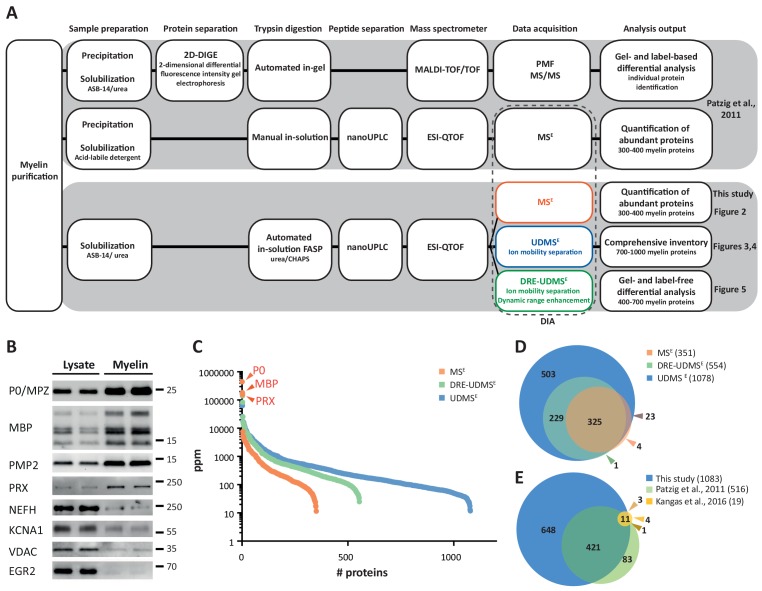
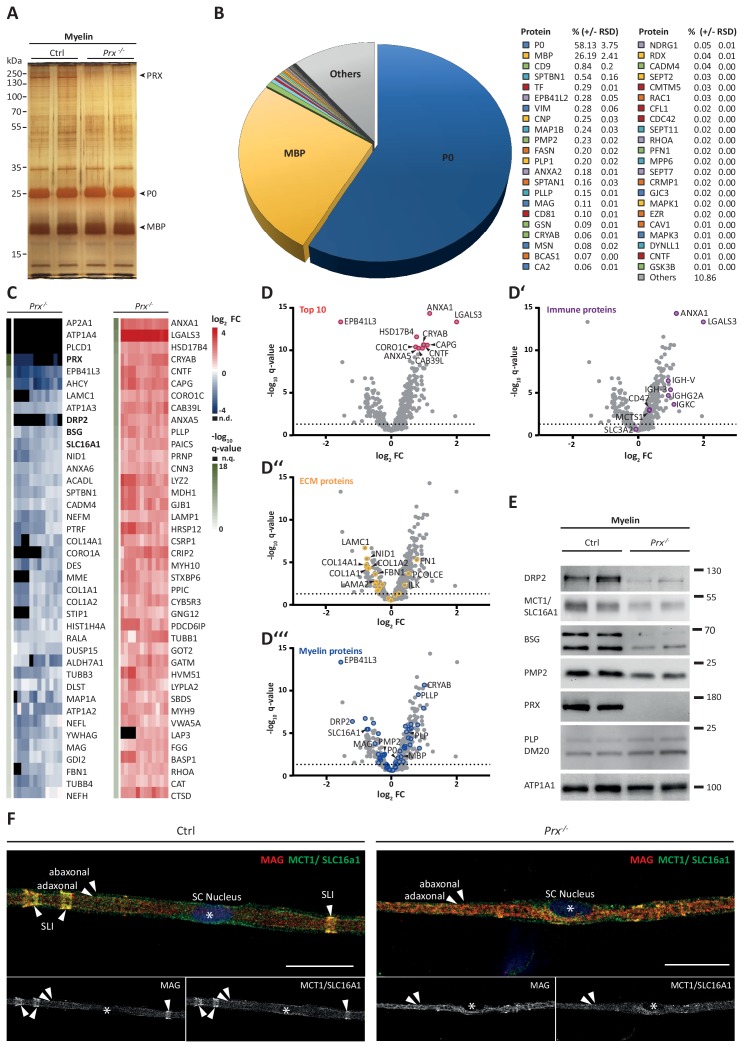
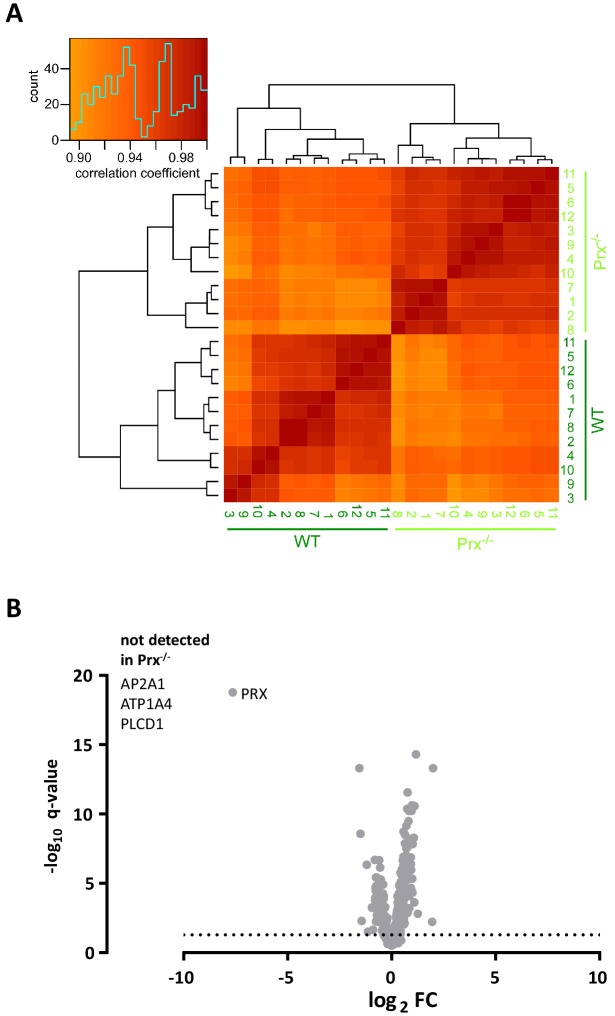
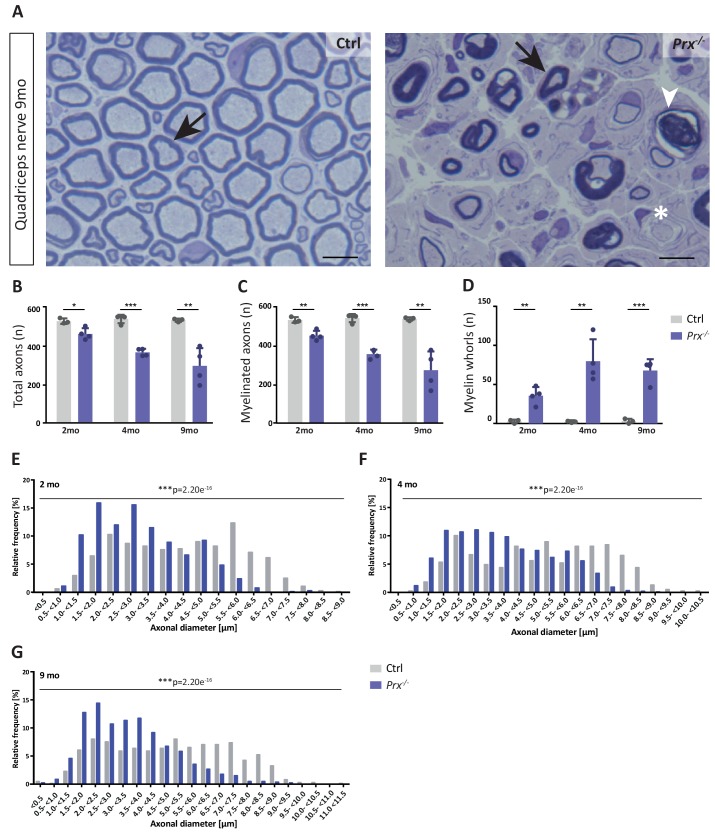
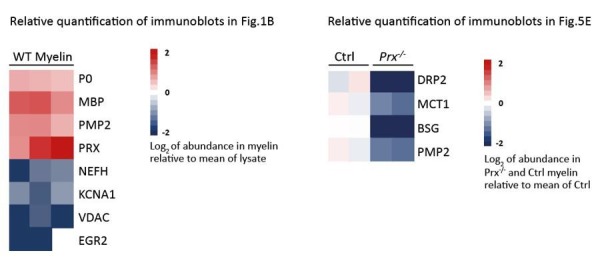
Proteome and transcriptome analyses aim at comprehending the molecular profiles of the brain, its cell-types and subcellular compartments including myelin. Despite the relevance of the peripheral nervous system for normal sensory and motor capabilities, analogous approaches to peripheral nerves and peripheral myelin have fallen behind evolving technical standards. Here we assess the peripheral myelin proteome by gel-free, label-free mass-spectrometry for deep quantitative coverage. Integration with RNA-Sequencing-based developmental mRNA-abundance profiles and neuropathy disease genes illustrates the utility of this resource. Notably, the periaxin-deficient mouse model of the neuropathy Charcot-Marie-Tooth 4F displays a highly pathological myelin proteome profile, exemplified by the discovery of reduced levels of the monocarboxylate transporter MCT1/SLC16A1 as a novel facet of the neuropathology. This work provides the most comprehensive proteome resource thus far to approach development, function and pathology of peripheral myelin, and a straightforward, accurate and sensitive workflow to address myelin diversity in health and disease.

Keywords: charcot-marie-tooth (cmt) neuropathy; demyelination; mouse; myelin proteome; neuroscience; peripheral nervous system; schwann cell.


Conflict of interest statement

SS, OJ, ME, NK, LW, DS, KK, DH, RJ, RF, MS, MR, PB, HW No competing interests declared

Figures

Figure 1.
Figure 1.. Proteome analysis of peripheral myelin.
(A) Schematic illustration of a previous approach to the peripheral myelin proteome (Patzig et al., 2011) compared with the present workflow. Note that the current workflow allows largely automated sample processing and omits labor-intense 2-dimensional differential gel-electrophoresis, thereby considerably reducing hands-on time. Nano LC-MS analysis by data-independent acquisition (DIA) using three different data acquisition modes provides efficient identification and quantification of abundant myelin proteins (MSE; see Figure 2), a comprehensive inventory (UDMSE; see Figures 3–4) and gel-free differential analysis of hundreds of distinct proteins (DRE-UDMSE; see Figure 5). Samples were analyzed in three biological replicates. (B) Immunoblot of myelin biochemically enriched from sciatic nerves of wild-type mice at postnatal day 21 (P21). Equal amounts of corresponding nerve lysate were loaded to compare the abundance of marker proteins for compact myelin (MPZ/P0, MBP, PMP2), non-compact myelin (PRX), the Schwann cell nucleus (KROX20/EGR2), axons (NEFH, KCNA1) and mitochondria (VDAC). Blots show n = 2 biological replicates representative of n = 3 biological replicates. Note that myelin markers are enriched in purified myelin; other cellular markers are reduced. (C) Number and relative abundance of proteins identified in myelin purified from the sciatic nerves of wild-type mice using three different data acquisition modes (MSE, UDMSE, DRE-UDMSE). Note that MSE (orange) provides the best information about the relative abundance of high-abundant myelin proteins (dynamic range of more than four orders of magnitude) but identifies comparatively fewer proteins in purified myelin. UDMSE (blue) identifies the largest number of proteins but provides only a lower dynamic range of about three orders of magnitude. DRE-UDMSE (green) identifies an intermediate number of proteins with an intermediate dynamic range of about four orders of magnitude. Note that MSE with very high dynamic range is required for the quantification of the exceptionally abundant myelin protein zero (MPZ/P0), myelin basic protein (MBP) and periaxin (PRX). ppm, parts per million. (D) Venn diagram comparing the number of proteins identified in PNS myelin by MSE, UDMSE and DRE-UDMSE. Note the high overlap of identified proteins. (E) Venn diagram of the proteins identified in PNS myelin by UDMSE in this study compared with those identified in two previous approaches (Patzig et al., 2011; Kangas et al., 2016).
Figure 1—figure supplement 1.
Figure 1—figure supplement 1.. Clustered heatmap of Pearson’s correlation coefficients for protein abundance comparing data acquisition modes.
The heatmap compares the log2 transformed ppm protein abundance values to assess peripheral myelin purified from wild type mice using three data acquisition modes (MSE, UDMSE, DRE-UDMSE). The inset shows the color key and the histogram for the values of the correlation coefficients. Note that the runs cluster with a high overall correlation (>0.75) into three conditions defined by the acquisition mode, in agreement with the experimental design. Among the samples analyzed by different acquisition modes, DRE-UDMSE similarly correlates with both MSE and UDMSE, reflecting its intermediate nature.
Figure 2.
Figure 2.. Relative abundance of peripheral myelin proteins.
MSE was used to identify and quantify proteins in myelin purified from the sciatic nerves of wild-type mice at P21; their relative abundance is given as percent with relative standard deviation (% +/- RSD). Note that known myelin proteins constitute >80% of the total myelin protein; proteins not previously associated with myelin constitute <20%. Mass spectrometric quantification based on 3 biological replicates per genotype with 4 technical replicates each (see Figure 1—source data 1).
Figure 3.
Figure 3.. Developmental mRNA abundance profiles of myelin-associated genes.
(A) K-means clustering was performed for the mRNA profiles of those 1046 proteins in our myelin proteome inventory for which significant mRNA expression was found by RNA-Seq in the sciatic nerve of rats dissected at ages E21, P6, P18 and 6 months (M6). Note that this filtering strategy allows to selectively display the developmental abundance profiles of those transcripts that encode myelin-associated proteins rather than of all transcripts present in the nerve. Standardized mRNA abundance profiles are shown (n = 4 biological replicates per age). Known myelin genes are displayed in red. For comparison, Pmp22 mRNA was included although the small tetraspan protein PMP22 was not mass spectrometrically identified due to its unfavorable distribution of tryptic cleavage sites. Normalized counts for all mRNAs including those displaying developmentally unchanged abundance are provided in Figure 3—source data 1. (B) Numbers of mRNAs per cluster.
Figure 4.
Figure 4.. Categorization of annotated protein functions.
All proteins identified in peripheral myelin by UDMSE (turquoise) and the respective developmental expression clusters (Figure 3; shades of red) were analyzed for overrepresented functional annotations using gene ontology (GO) terms. The graph displays the percentage of proteins in each cluster that were annotated with a particular function. For comparison, known myelin proteins were annotated. n.o., not over-represented.
Figure 5.
Figure 5.. Molecular analysis of myelin in the Prx-/- mouse model of CMT4F.
(A) Myelin purified from sciatic nerves dissected from Prx-/- and control mice at P21 was separated by SDS-PAGE (0.5 µg protein load) and proteins were visualized by silver staining. Bands constituted by the most abundant myelin proteins (MPZ/P0, MBP, PRX) are annotated. Note that no band constituted by PRX was detected in Prx-/- myelin and that several other bands also display genotype-dependent differences in intensity. Gel shows n = 2 biological replicates representative of n = 3 biological replicates. (B) The relative abundance of proteins in myelin purified from Prx-/- sciatic nerves as quantified by MSE is given as percent with relative standard deviation (% +/- RSD). Note the increased relative abundance of MPZ/P0 and MBP compared to wild-type myelin (see Figure 2) when PRX is lacking. Mass spectrometric quantification based on 3 biological replicates with 4 technical replicates each (see Figure 5—source data 1). (C,D) Differential proteome analysis by DRE-UDMSE of myelin purified from Prx-/- and wild-type mice. Mass spectrometric quantification based on 3 biological replicates per genotype with 4 technical replicates each (see Figure 5—source data 2). (C) Top 40 proteins of which the abundance is reduced (blue) or increased (red) in peripheral myelin purified from Prx-/- compared to wild-type mice with the highest level of significance according to the -log10 transformed q-value (green). In the heatmaps, each horizontal line corresponds to the fold-change (FC) of a distinct protein compared to its average abundance in wild-type myelin plotted on a log2 color scale. Heatmaps display 12 replicates, that is 3 biological replicates per genotype with 4 technical replicates each. (D-D‘‘‘) Volcano plots representing genotype-dependent quantitative myelin proteome analysis. Data points represent quantified proteins in Prx-/- compared to wild-type myelin and are plotted as the log2-transformed fold-change (FC) on the x-axis against the -log10-transformed q-value on the y-axis. Stippled lines mark a -log10-transformed q-value of 1.301, reflecting a q-value of 0.05 as significance threshold. Highlighted are the datapoints representing the Top 10 proteins displaying highest zdist values (Euclidean distance between the two points (0,0) and (x,y) with x = log2(FC) and y = -log10(q-value) (red circles in D), immune-related proteins (purple circles in D‘), proteins of the extracellular matrix (ECM; yellow circles in D‘‘) and known myelin proteins (blue circles in D‘‘‘). n.d., not detected; n.q., no q-value computable due to protein identification in one genotype only. Also see Figure 5—figure supplement 1. (E) Immunoblot of myelin purified from Prx-/- and control sciatic nerves confirms the reduced abundance of DRP2, SLC16A1/MCT1, BSG and PMP2 in Prx-/- myelin, as found by differential DRE-UDMSE analysis (in C,D). PRX was detected as genotype control; PLP/DM20 and ATP1A1 serve as markers. Blot shows n = 2 biological replicates per genotype. (F) Teased fiber preparations of sciatic nerves dissected from Prx-/- and control mice immunolabelled for MAG (red) and SLC16A1 (green). Note that SLC16A1 co-distributes with MAG in Schmidt-Lanterman incisures (SLI) in control but not in Prx-/- nerves, in accordance with the reduced abundance of SLC16A1 in Prx-/- myelin (C–E). Also note that, in Prx-/- myelin, SLI were largely undetectable by MAG immunolabeling.
Figure 5—figure supplement 1.
Figure 5—figure supplement 1.. Clustered heatmap of Pearson’s correlation coefficients for protein abundance comparing genotypes.
(A) The heatmap compares the log2 transformed ppm protein abundance values from the DRE-UDMSE runs to assess peripheral myelin purified from wild type and Prx-/- mice. The inset shows the color key and the histogram for the values of the correlation coefficients. Note that the runs cluster with a high overall correlation (>0.85) into two conditions defined by the genotype, in agreement with the experimental design. (B) Volcano plot representing genotype-dependent quantitative myelin proteome analysis. Data points represent quantified proteins in Prx-/- compared to wild-type myelin plotted as the log2-transformed fold-change (FC) on the x-axis against the -log10-transformed q-value on the y-axis. Note the different axis scale compared to Figure 5D. Stippled line marks a -log10-transformed q-value of 1.301, reflecting a q-value of 0.05 as significance threshold. Highlighted is the datapoint for PRX to illustrate that only trace amounts of PRX were detected when assessing Prx-/- myelin. ATP2A1, ATP1A4 and PLCD1 were not detected in Prx-/- myelin.
Figure 6.
Figure 6.. Progressive loss and reduced diameters of peripheral axons in Prx-/- mice.
(A–D) Genotype-dependent quantitative assessment of light micrographs of toluidine-stained semi-thin sectioned quadriceps nerves dissected at 2, 4 and 9 months of age reveals progressive loss of peripheral axons in Prx-/- compared to control mice. (A) Representative micrographs. Arrows point at myelinated axons; asterisk denotes an unmyelinated axon; arrowhead points at a myelin whorl lacking a recognizable axon. Scale bars, 10 µm. (B) Total number of axons per nerve that are not associated with a Remak bundle. (C) Total number of myelinated axons per nerve. (D) Total number per nerve of myelin whorls that lack a recognizable axon. Mean +/SD, n = 3–4 mice per genotype and age; *p<0.05, **p<0.01, ***p<0.001 by Student’s unpaired t-test. (E–G) Genotype-dependent assessment of myelinated axons shows a shift toward reduced axonal diameters in quadriceps nerves of Prx-/- compared to control mice at 2 months (E), 4 months (F) and 9 months (G) of age. Data are presented as frequency distribution with 0.5 µm bin width. ***, p<0.001 by two-sided Kolmogorow-Smirnow test. For precise p-values see methods section.
Author response image 1.
Author response image 1.. Quantification of immunoblots in Figure 1B and Figure 5E.

Similar articles

Cited by

References

    1. Ackerman SD, Luo R, Poitelon Y, Mogha A, Harty BL, D'Rozario M, Sanchez NE, Lakkaraju AKK, Gamble P, Li J, Qu J, MacEwan MR, Ray WZ, Aguzzi A, Feltri ML, Piao X, Monk KR. GPR56/ADGRG1 regulates development and maintenance of peripheral myelin. Journal of Experimental Medicine. 2018;215:941–961. doi: 10.1084/jem.20161714. - DOI - PMC - PubMed
    1. Adlkofer K, Martini R, Aguzzi A, Zielasek J, Toyka KV, Suter U. Hypermyelination and demyelinating peripheral neuropathy in Pmp22-deficient mice. Nature Genetics. 1995;11:274–280. doi: 10.1038/ng1195-274. - DOI - PubMed
    1. Ahrné E, Molzahn L, Glatter T, Schmidt A. Critical assessment of proteome-wide label-free absolute abundance estimation strategies. Proteomics. 2013;13:2567–2578. doi: 10.1002/pmic.201300135. - DOI - PubMed
    1. Ambrozkiewicz MC, Schwark M, Kishimoto-Suga M, Borisova E, Hori K, Salazar-Lázaro A, Rusanova A, Altas B, Piepkorn L, Bessa P, Schaub T, Zhang X, Rabe T, Ripamonti S, Rosário M, Akiyama H, Jahn O, Kobayashi T, Hoshino M, Tarabykin V, Kawabe H. Polarity acquisition in cortical neurons is driven by synergistic action of Sox9-Regulated Wwp1 and Wwp2 E3 ubiquitin ligases and intronic miR-140. Neuron. 2018;100:1097–1115. doi: 10.1016/j.neuron.2018.10.008. - DOI - PubMed
    1. Archelos JJ, Roggenbuck K, Schneider-Schaulies J, Linington C, Toyka KV, Hartung HP. Production and characterization of monoclonal antibodies to the extracellular domain of P0. Journal of Neuroscience Research. 1993;35:46–53. doi: 10.1002/jnr.490350107. - DOI - PubMed

Publication types

Supplementary concepts