

Striated myocyte structural integrity: Automated analysis of sarcomeric z-discs
- PMID: 32130207
- PMCID: PMC7075639
- DOI: 10.1371/journal.pcbi.1007676
Striated myocyte structural integrity: Automated analysis of sarcomeric z-discs
Abstract
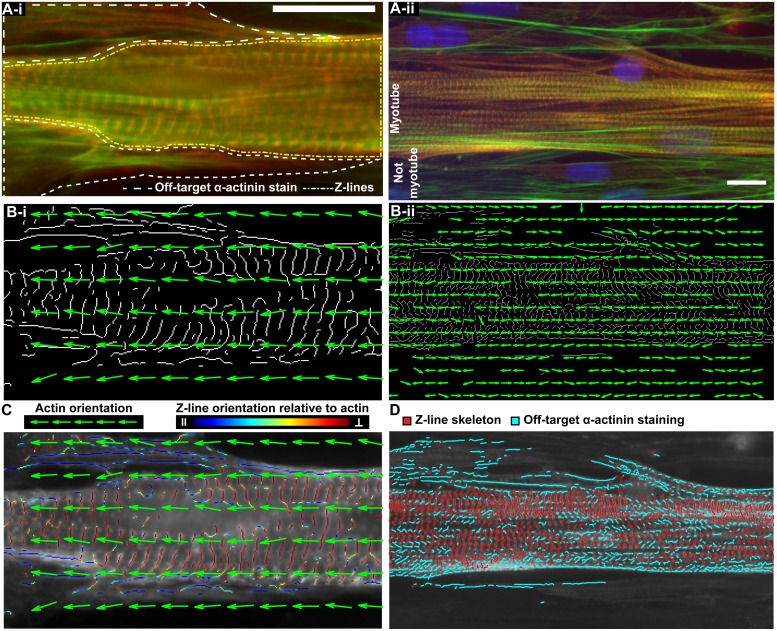
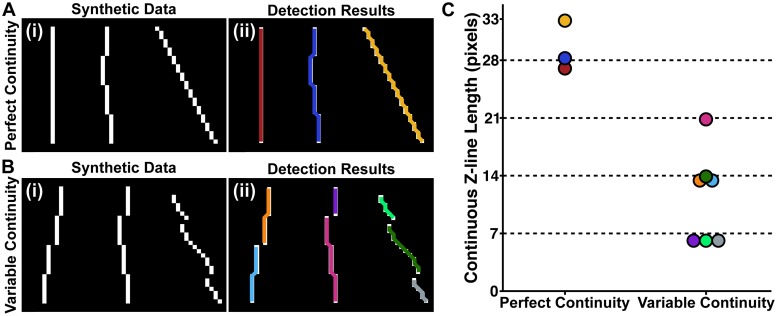
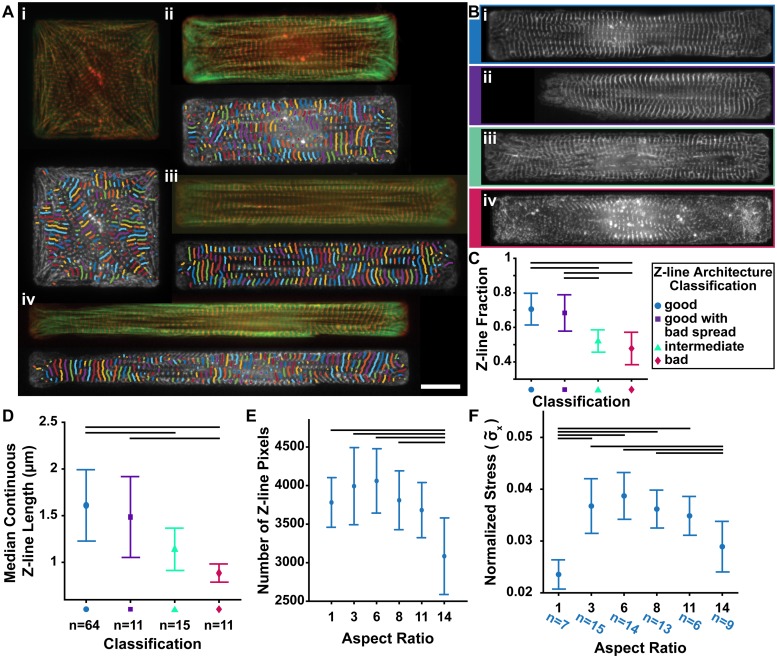
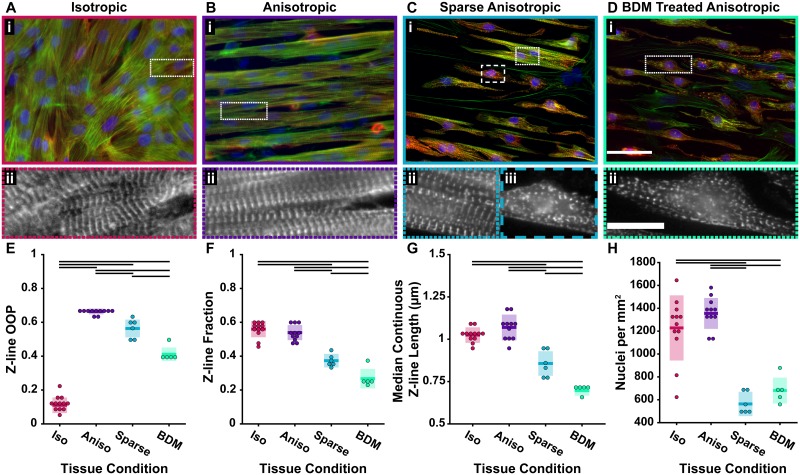
As sarcomeres produce the force necessary for contraction, assessment of sarcomere order is paramount in evaluation of cardiac and skeletal myocytes. The uniaxial force produced by sarcomeres is ideally perpendicular to their z-lines, which couple parallel myofibrils and give cardiac and skeletal myocytes their distinct striated appearance. Accordingly, sarcomere structure is often evaluated by staining for z-line proteins such as α-actinin. However, due to limitations of current analysis methods, which require manual or semi-manual handling of images, the mechanism by which sarcomere and by extension z-line architecture can impact contraction and which characteristics of z-line architecture should be used to assess striated myocytes has not been fully explored. Challenges such as isolating z-lines from regions of off-target staining that occur along immature stress fibers and cell boundaries and choosing metrics to summarize overall z-line architecture have gone largely unaddressed in previous work. While an expert can qualitatively appraise tissues, these challenges leave researchers without robust, repeatable tools to assess z-line architecture across different labs and experiments. Additionally, the criteria used by experts to evaluate sarcomeric architecture have not been well-defined. We address these challenges by providing metrics that summarize different aspects of z-line architecture that correspond to expert tissue quality assessment and demonstrate their efficacy through an examination of engineered tissues and single cells. In doing so, we have elucidated a mechanism by which highly elongated cardiomyocytes become inefficient at producing force. Unlike previous manual or semi-manual methods, characterization of z-line architecture using the metrics discussed and implemented in this work can quantitatively evaluate engineered tissues and contribute to a robust understanding of the development and mechanics of striated muscles.
Conflict of interest statement
The authors have declared that no competing interests exist.
Figures
Similar articles
-
Early incorporation of obscurin into nascent sarcomeres: implication for myofibril assembly during cardiac myogenesis.Histochem Cell Biol. 2008 Apr;129(4):463-78. doi: 10.1007/s00418-008-0378-y. Epub 2008 Jan 25. Histochem Cell Biol. 2008. PMID: 18219491 Free PMC article.
-
Transverse stiffness of myofibrils of skeletal and cardiac muscles studied by atomic force microscopy.J Physiol Sci. 2006 Apr;56(2):145-51. doi: 10.2170/physiolsci.RP003205. Epub 2006 Apr 5. J Physiol Sci. 2006. PMID: 16839448
-
A computational approach to quantitatively define sarcomere dimensions and arrangement in skeletal muscle.Comput Methods Programs Biomed. 2021 Nov;211:106437. doi: 10.1016/j.cmpb.2021.106437. Epub 2021 Sep 24. Comput Methods Programs Biomed. 2021. PMID: 34624632
-
A comprehensive review of computational and image analysis techniques for quantitative evaluation of striated muscle tissue architecture.Biophys Rev (Melville). 2022 Dec;3(4):041302. doi: 10.1063/5.0057434. Epub 2022 Nov 4. Biophys Rev (Melville). 2022. PMID: 36407035 Free PMC article. Review.
-
The vertebrate muscle Z-disc: sarcomere anchor for structure and signalling.J Muscle Res Cell Motil. 2009;30(5-6):171-85. doi: 10.1007/s10974-009-9189-6. Epub 2009 Oct 15. J Muscle Res Cell Motil. 2009. PMID: 19830582 Free PMC article. Review.
Cited by
-
Robust generation of human-chambered cardiac organoids from pluripotent stem cells for improved modelling of cardiovascular diseases.Stem Cell Res Ther. 2022 Dec 21;13(1):529. doi: 10.1186/s13287-022-03215-1. Stem Cell Res Ther. 2022. PMID: 36544188 Free PMC article.
-
Developmental remodelling of Drosophila flight muscle sarcomeres: a scaled myofilament lattice model based on multiscale morphometrics.Open Biol. 2025 Aug;15(8):250182. doi: 10.1098/rsob.250182. Epub 2025 Aug 13. Open Biol. 2025. PMID: 40795996 Free PMC article.
-
The mini-IDLE 3D biomimetic culture assay enables interrogation of mechanisms governing muscle stem cell quiescence and niche repopulation.Elife. 2022 Dec 20;11:e81738. doi: 10.7554/eLife.81738. Elife. 2022. PMID: 36537758 Free PMC article.
-
Electroactive nano-Biohybrid actuator composed of gold nanoparticle-embedded muscle bundle on molybdenum disulfide nanosheet-modified electrode for motion enhancement of biohybrid robot.Nano Converg. 2022 May 25;9(1):24. doi: 10.1186/s40580-022-00316-8. Nano Converg. 2022. PMID: 35612632 Free PMC article.
-
Estimation of crossbridge-state during cardiomyocyte beating using second harmonic generation.Life Sci Alliance. 2023 May 26;6(7):e202302070. doi: 10.26508/lsa.202302070. Print 2023 Jul. Life Sci Alliance. 2023. PMID: 37236659 Free PMC article.
References
-
- Ehler E, Rothen BM, Hammerle SP, Komiyama M, Perriard JC. Myofibrillogenesis in the developing chicken heart: assembly of Z-disk, M-line and the thick filaments. Journal of Cell Science. 1999;112(10):1529–1539. - PubMed
-
- Sanger JW, Ayoob JC, Chowrashi P, Zurawski D, Sanger JM. Assembly of myofibrils in cardiac muscle cells In: Elastic Filaments of the Cell. Springer; 2000. p. 89–110. - PubMed
Publication types
MeSH terms
Grants and funding
LinkOut - more resources
Full Text Sources
Research Materials
