. 2020 Mar 4;15(3):e0229712.
doi: 10.1371/journal.pone.0229712. eCollection 2020.

Influence of EGFR-activating mutations on sensitivity to tyrosine kinase inhibitors in a KRAS mutant non-small cell lung cancer cell line

Affiliations

Influence of EGFR-activating mutations on sensitivity to tyrosine kinase inhibitors in a KRAS mutant non-small cell lung cancer cell line

Yoshinori Tsukumo et al. PLoS One. .

Abstract

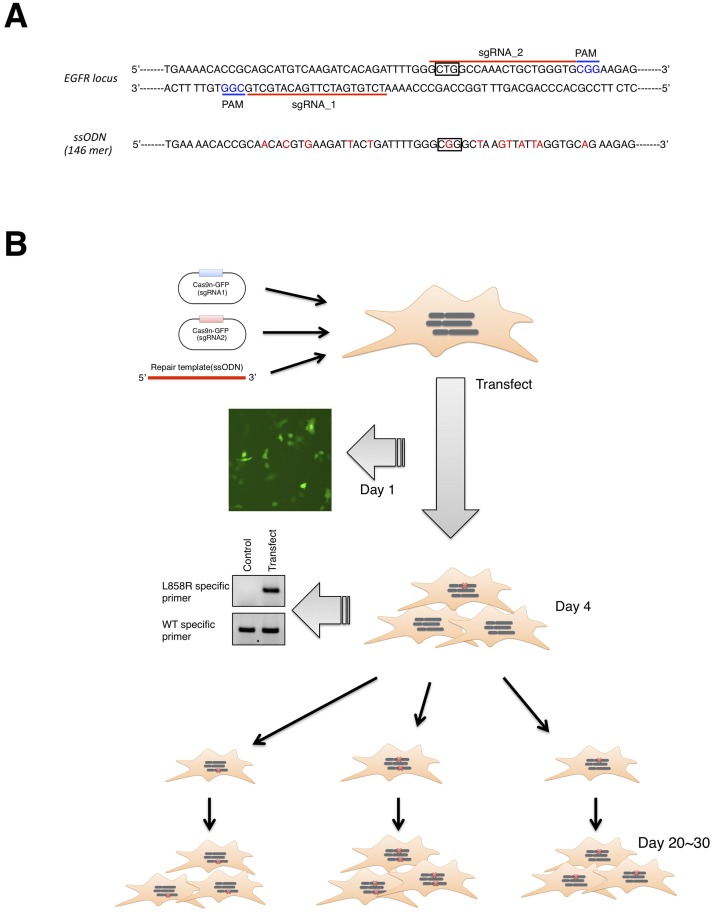
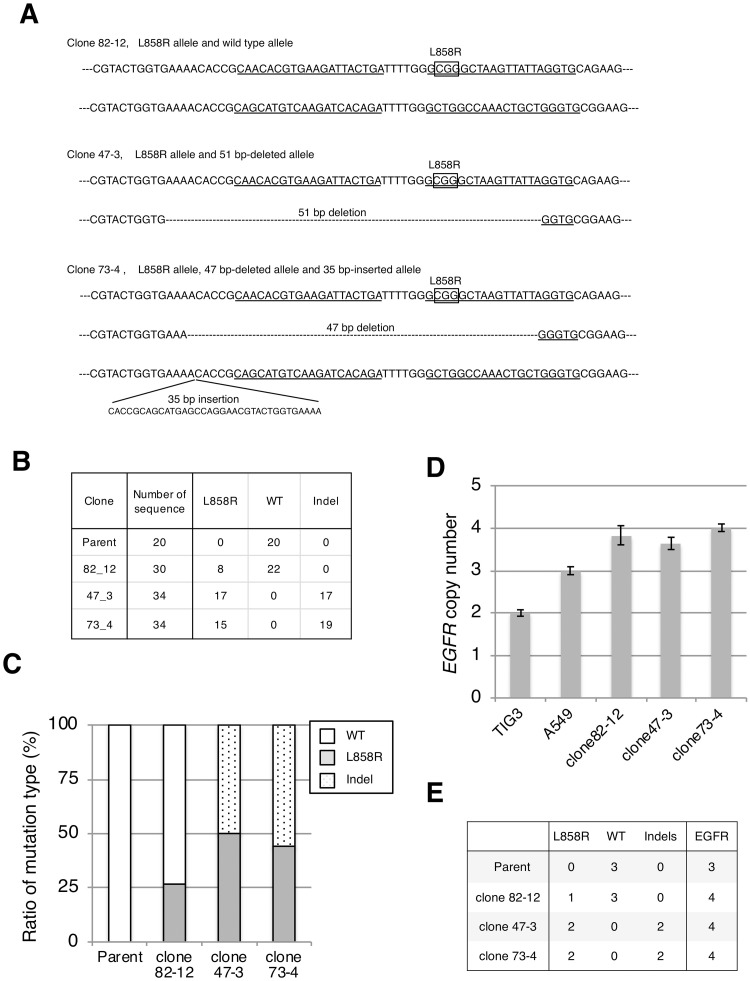
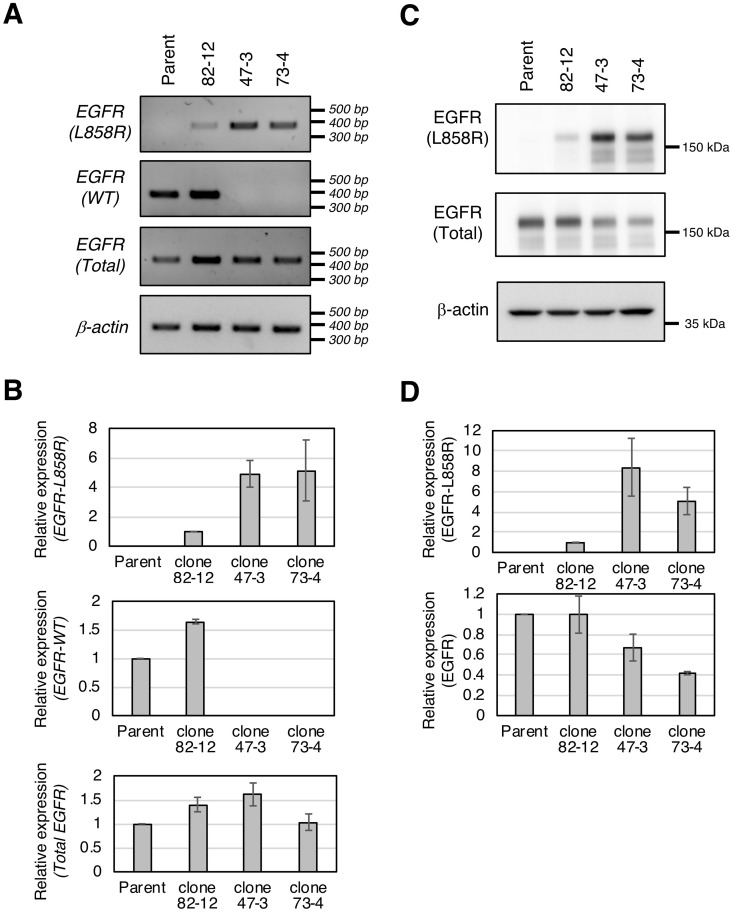
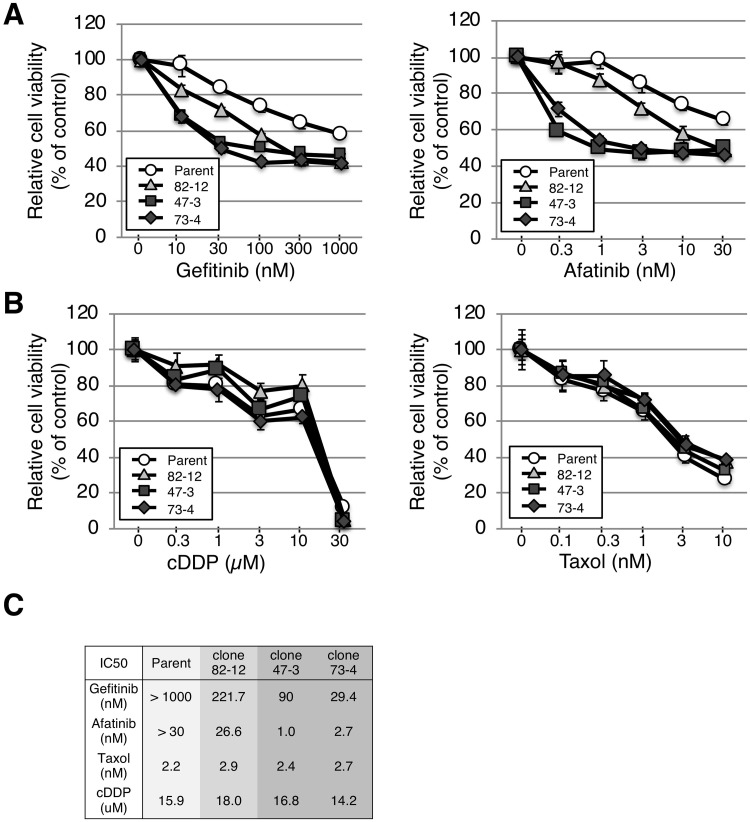
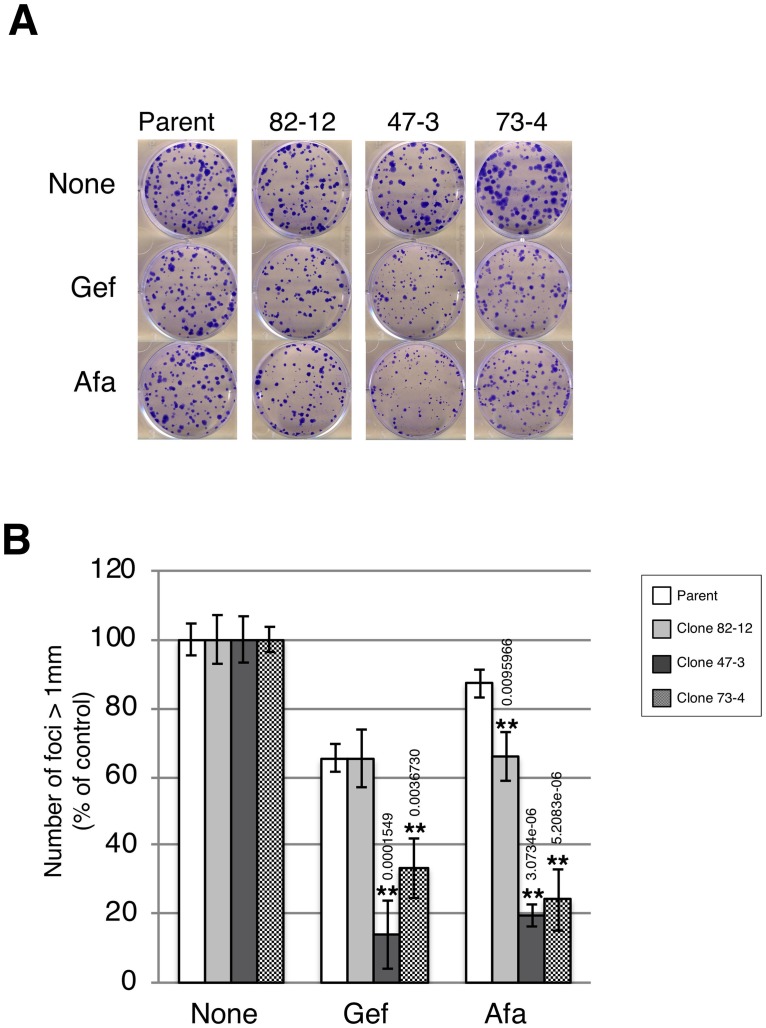
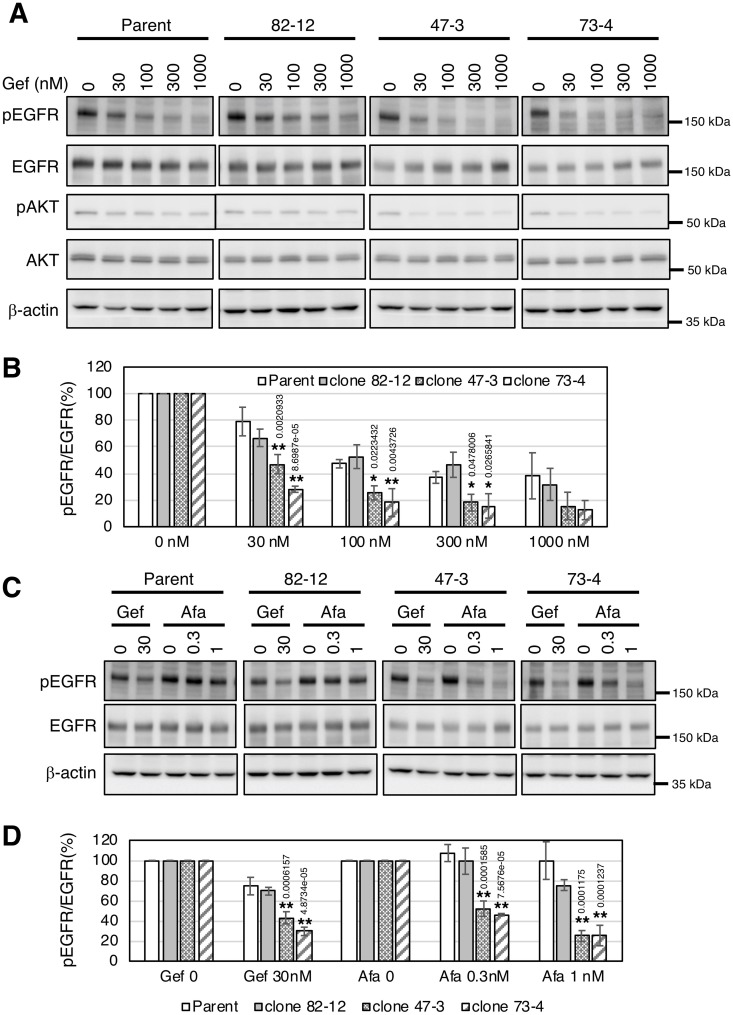
In non-small cell lung cancer (NSCLC), oncogenic driver mutations including those in KRAS and EGFR are typically mutually exclusive. However, recent reports indicate that multiple driver mutations are found in a certain percentage of cancers, and that the therapeutic responses of such cases with co-mutations of driver genes are largely unclear. Here, using CRISPR-Cas9-mediated genome editing, we generated isogenic cell lines harboring one or two copies of an EGFR-activating mutation from the human NSCLC cell line A549, which is known to harbor a homozygous KRAS gene mutation. In comparison with parent cells with KRAS mutation alone, cells with concomitant EGFR mutation exhibited higher sensitivity to EGFR-tyrosine kinase inhibitors (TKIs) but not to conventional anti-cancer drugs. In particular, cells with two copies of EGFR mutation were markedly more sensitive to EGFR-TKIs compared with parent cells. Thus, the presence of concomitant EGFR mutation can affect the TKI response of KRAS-mutated cells, implying that EGFR-TKI may represent an effective treatment option against NSCLC with EGFR/KRAS co-mutation.


Conflict of interest statement

The authors have declared that no competing interests exist.

Figures

Fig 1
Fig 1. Overview of CRISPR/Cas9 genome editing.
A. Sequence of human EGFR exon 21 for CRISPR/Cas9 genome editing. sgRNA target sites and protospacer adjacent motifs are indicated by red bars and blue characters, respectively. The ssODN sequence as a repair template is also shown. Box represents Leu or Arg residue at amino acid position 858. B. Timeline of genome editing. Cas9n (sgRNA) plasmids and ssODN for homology directed recombination (HDR) are transfected into A549 cells. Successful transfection and HDR were validated by the presence of GFP-positive cells at day 1 and a mutation-specific PCR product at day 4, respectively. Transfected cells were clonally expanded to isolate L858R-knockin clones.
Fig 2
Fig 2. Establishment of cell lines harboring the L858R EGFR mutation.
A. Sequence of EGFR target region in each clone. Sanger sequencing was performed after subcloning the PCR-amplified target region into a plasmid vector. Box: L858R mutation (CTG→CCG), underline: sgRNA target regions. B. Summary of the number and type of each sequence. C. The mutation ratio of L858R or deletion (or insertion) was calculated based on the results shown in B. D. The EGFR copy number was determined by quantitative PCR using the diploid cell TIG3 as a control. E. The L858R EGFR copy number was calculated from the mutation ratio of L858R (C) and EGFR copy number (D).
Fig 3
Fig 3. Expression of the L858R EGFR mutant in established clones.
A. L858R EGFR, wild-type EGFR, and total EGFR mRNA expression was analyzed by PCR using specific primer sets. B. mRNA expression was normalized to β-actin. Densitometric analysis of each band was performed by Image J software. For L858R EGFR mRNA, the expression in clone 82–12 was used as a control; for wild-type or total EGFR mRNA, parental expression was used as a control. C. L858R EGFR or total EGFR protein expression was analyzed by immunoblotting with an L858R-specific or anti-EGFR antibody. D. L858R EGFR or total EGFR protein was quantified as shown in B.
Fig 4
Fig 4. L858R EGFR mutation renders A549 cells sensitive to EGFR-TKIs.
A, B. Cells were plated at 1 × 10³ cells/well in 96-well plates and treated with gefitinib (10–1000 nM) and afatinib (0.3–30 nM) for 96 h, or cisplatin (0.3–100 μM) and taxol (0.03–10 nM) for 72 h. Cell viability was evaluated using a WST assay. Each experiment was repeated three times. C. The IC50 of each drug (gefitinib, afatinib, taxol, and cisplatin) is shown.
Fig 5
Fig 5. Two copies of L858R EGFR hypersensitize A549 cells to EGFR-TKIs.
A. Clonogenic survival assay. Each cell line was plated at 200 cells/well in 6-well plates and incubated in the presence of gefitinib (10 nM) or afatinib (0.3 nM) for 10 days. Colonies were fixed by methanol and stained with crystal violet. B. The number of foci >1 mm was automatically counted using Image J software. Results are the mean cell number relative to control (set to 100%) ± SD (n = 3). Statistical analysis: Bonfferoni correction was used for multiple comparisons. *P<0.05, **P<0.01.
Fig 6
Fig 6. EGFR phosphorylation is markedly reduced by TKI treatment in cells with two copies of L858R EGFR.
A. Cells were treated with the indicated concentration of gefitinib for 4 h. Protein expression or phosphorylation levels were determined by immunoblotting using anti-phospho-EGFR (Y1068), anti-EGFR, anti-phospho-AKT (Ser473), anti-AKT, and β-actin antibodies. B. Densitometric analysis of phospho-EGFR and EGFR protein was performed by Image J software. The value of pEGFR/EGFR in the non-treated sample lane was defined as 100%. *P<0.05, **P<0.01. C. Cells were treated with the indicated concentration of afatinib or gefitinib for 4 h. Protein expression or phosphorylation levels were determined by immunoblotting using anti-phospho-EGFR (Y1068), anti-EGFR, and β-actin antibodies. D. Densitometric analysis of phospho-EGFR and EGFR protein was performed by Image J software. The value of pEGFR/EGFR in the non-treated sample lane was defined as 100%. Statistical analysis: Bonfferoni correction was performed for multiple comparisons. **P<0.01.

Similar articles

Cited by

References

    1. Siegel RL, Miller KD, Jemal A. Cancer Statistics, 2017. CA: a cancer journal for clinicians. 2017;67(1):7–30. 10.3322/caac.21387 . - DOI - PubMed
    1. Torre LA, Bray F, Siegel RL, Ferlay J, Lortet-Tieulent J, Jemal A. Global cancer statistics, 2012. CA: a cancer journal for clinicians. 2015;65(2):87–108. 10.3322/caac.21262 . - DOI - PubMed
    1. Dearden S, Stevens J, Wu YL, Blowers D. Mutation incidence and coincidence in non small-cell lung cancer: meta-analyses by ethnicity and histology (mutMap). Annals of oncology: official journal of the European Society for Medical Oncology. 2013;24(9):2371–6. Epub 2013/06/01. 10.1093/annonc/mdt205 - DOI - PMC - PubMed
    1. Mitsudomi T, Yatabe Y. Mutations of the epidermal growth factor receptor gene and related genes as determinants of epidermal growth factor receptor tyrosine kinase inhibitors sensitivity in lung cancer. Cancer science. 2007;98(12):1817–24. 10.1111/j.1349-7006.2007.00607.x . - DOI - PMC - PubMed
    1. Cancer Genome Atlas Research N. Comprehensive molecular profiling of lung adenocarcinoma. Nature. 2014;511(7511):543–50. Epub 2014/08/01. 10.1038/nature13385 - DOI - PMC - PubMed

Publication types

MeSH terms