Progression of AITL-like tumors in mice is driven by Tfh signature proteins and T-B cross talk
- PMID: 32130407
- PMCID: PMC7065475
- DOI: 10.1182/bloodadvances.2019001114
Progression of AITL-like tumors in mice is driven by Tfh signature proteins and T-B cross talk
Abstract
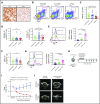
Angioimmunoblastic T-cell lymphoma (AITL) is an aggressive peripheral T-cell lymphoma driven by a pool of neoplastic cells originating from T follicular helper (Tfh) cells and concomitant expansion of B cells. Conventional chemotherapies for AITL have shown limited efficacy, and as such, there is a need for improved therapeutic options. Because AITL originates from Tfh cells, we hypothesized that AITL tumors continue to rely on essential Tfh components and intimate T-cell-B-cell (T-B) interactions. Using a spontaneous AITL mouse model (Roquinsan/+ mice), we found that acute loss of Bcl6 activity in growing tumors drastically reduced tumor size, demonstrating that AITL-like tumors critically depend on the Tfh lineage-defining transcription factor Bcl6. Because Bcl6 can upregulate expression of signaling lymphocytic activation molecule-associated protein (SAP), which is known to promote T-B conjugation, we next targeted the SAP-encoding Sh2d1a gene. We observed that Sh2d1a deletion from CD4+ T cells in fully developed tumors also led to tumor regression. Further, we provide evidence that tumor progression depends on T-B cross talk facilitated by SAP and high-affinity LFA-1. In our study, AITL-like tumors relied heavily on molecular pathways that support Tfh cell identity and T-B collaboration, revealing potential therapeutic targets for AITL.
© 2020 by The American Society of Hematology.
Conflict of interest statement
Conflict-of-interest disclosure: A.V. has a contract with Bristol Myers-Squibb to study the mechanism of action of anti-SLAMF7 monoclonal antibody elotuzumab in multiple myeloma. The remaining authors declare no competing financial interests.
Figures


Similar articles
-
IDH2 and TET2 mutations synergize to modulate T Follicular Helper cell functional interaction with the AITL microenvironment.Cancer Cell. 2023 Feb 13;41(2):323-339.e10. doi: 10.1016/j.ccell.2023.01.003. Epub 2023 Feb 2. Cancer Cell. 2023. PMID: 36736318
-
Follicular Helper T-Cell-derived Nodal Lymphomas: Study of Histomorphologic, Immunophenotypic, Clinical, and RHOA G17V Mutational Profile.Appl Immunohistochem Mol Morphol. 2023 Mar 1;31(3):172-180. doi: 10.1097/PAI.0000000000001105. Epub 2023 Feb 20. Appl Immunohistochem Mol Morphol. 2023. PMID: 36806188
-
A Clinicopathologic Study of Lennert Lymphoma and Possible Prognostic Factors: The Importance of Follicular Helper T-cell Markers and the Association With Angioimmunoblastic T-cell Lymphoma.Am J Surg Pathol. 2016 Sep;40(9):1249-60. doi: 10.1097/PAS.0000000000000694. Am J Surg Pathol. 2016. PMID: 27428734
-
Recent Progress in the Understanding of Angioimmunoblastic T-cell Lymphoma.J Clin Exp Hematop. 2017;57(3):109-119. doi: 10.3960/jslrt.17019. J Clin Exp Hematop. 2017. PMID: 29279549 Free PMC article. Review.
-
[Diagnosis and treatment of angioimmunoblastic T-cell lymphoma and related cancers].Rinsho Ketsueki. 2019;60(9):1221-1228. doi: 10.11406/rinketsu.60.1221. Rinsho Ketsueki. 2019. PMID: 31597847 Review. Japanese.
Cited by
-
Integrating genomic and transcriptome features for characterization and prognostic prediction of angioimmunoblastic T-cell lymphoma.Ann Hematol. 2025 Sep 4. doi: 10.1007/s00277-025-06589-3. Online ahead of print. Ann Hematol. 2025. PMID: 40906017
-
Update on recurrent mutations in angioimmunoblastic T-cell lymphoma.Int J Clin Exp Pathol. 2021 Dec 15;14(12):1108-1118. eCollection 2021. Int J Clin Exp Pathol. 2021. PMID: 35027991 Free PMC article. Review.
-
B Cells versus T Cells in the Tumor Microenvironment of Malignant Lymphomas. Are the Lymphocytes Playing the Roles of Muhammad Ali versus George Foreman in Zaire 1974?J Clin Med. 2020 Oct 24;9(11):3412. doi: 10.3390/jcm9113412. J Clin Med. 2020. PMID: 33114418 Free PMC article. Review.
-
Targeting TFH cells in human diseases and vaccination: rationale and practice.Nat Immunol. 2022 Aug;23(8):1157-1168. doi: 10.1038/s41590-022-01253-8. Epub 2022 Jul 11. Nat Immunol. 2022. PMID: 35817844 Review.
-
Induction of p53-mediated apoptosis by azacitidine in patient-derived xenograft follicular helper T-cell lymphoma model.Leukemia. 2025 Jul;39(7):1744-1755. doi: 10.1038/s41375-025-02628-0. Epub 2025 May 20. Leukemia. 2025. PMID: 40394210 Free PMC article.
References
-
- Mourad N, Mounier N, Brière J, et al. ; Groupe d’Etude des Lymphomes de l’Adulte . Clinical, biologic, and pathologic features in 157 patients with angioimmunoblastic T-cell lymphoma treated within the Groupe d’Etude des Lymphomes de l’Adulte (GELA) trials. Blood. 2008;111(9):4463-4470. - PMC - PubMed
-
- Dogan A, Ngu LS, Ng SH, Cervi PL. Pathology and clinical features of angioimmunoblastic T-cell lymphoma after successful treatment with thalidomide. Leukemia. 2005;19(5):873-875. - PubMed
-
- Attygalle AD, Kyriakou C, Dupuis J, et al. . Histologic evolution of angioimmunoblastic T-cell lymphoma in consecutive biopsies: clinical correlation and insights into natural history and disease progression. Am J Surg Pathol. 2007;31(7):1077-1088. - PubMed
Publication types
MeSH terms
Substances
Grants and funding
LinkOut - more resources
Full Text Sources
Research Materials
Miscellaneous

