. 2020 May 4;217(5):e20190472.
doi: 10.1084/jem.20190472.

IL-21 is a broad negative regulator of IgE class switch recombination in mouse and human B cells

Affiliations

IL-21 is a broad negative regulator of IgE class switch recombination in mouse and human B cells

Zhiyong Yang et al. J Exp Med. .

Abstract

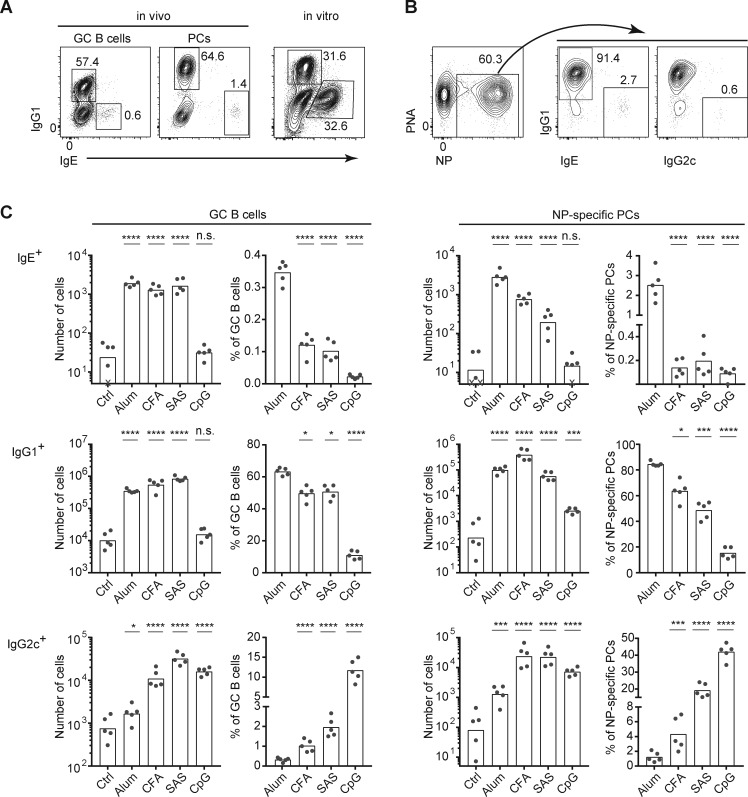
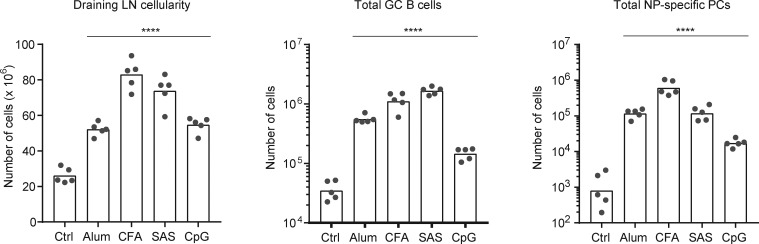
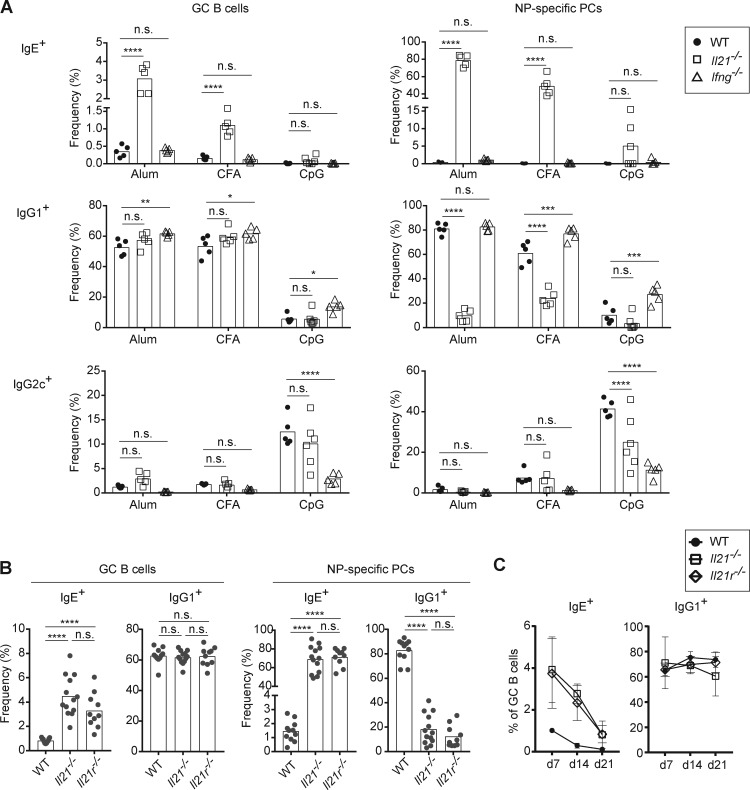
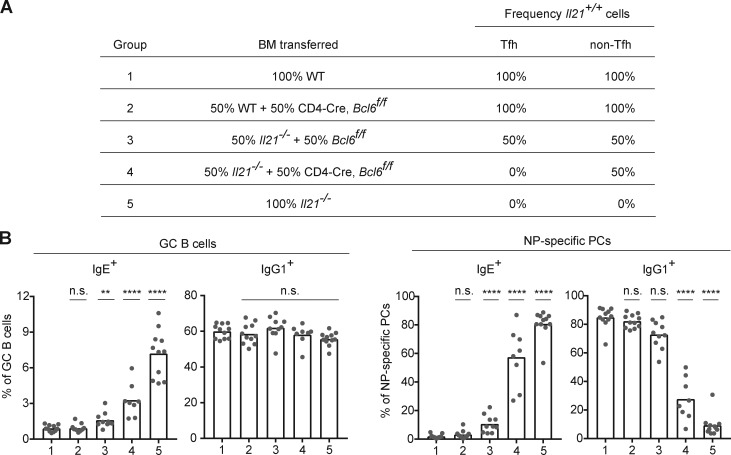
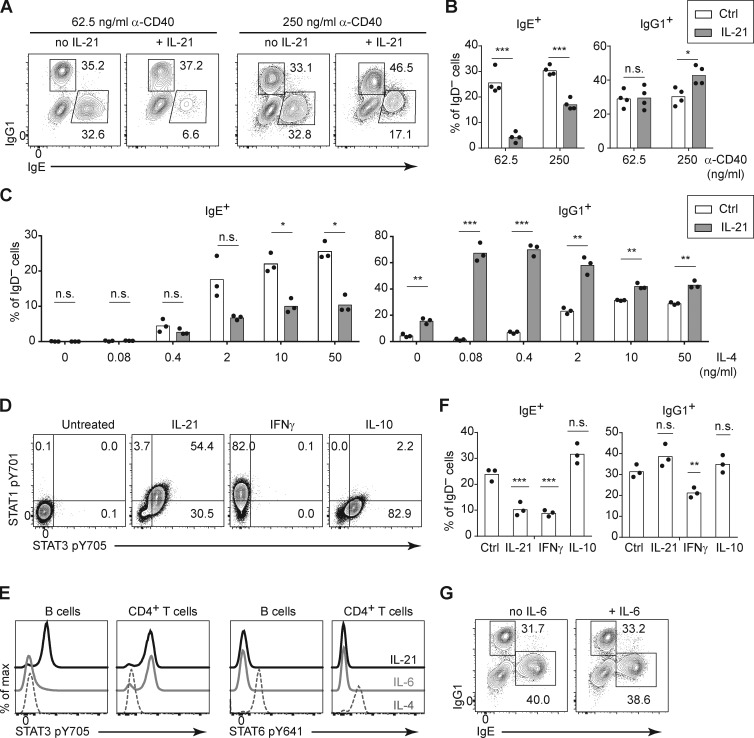
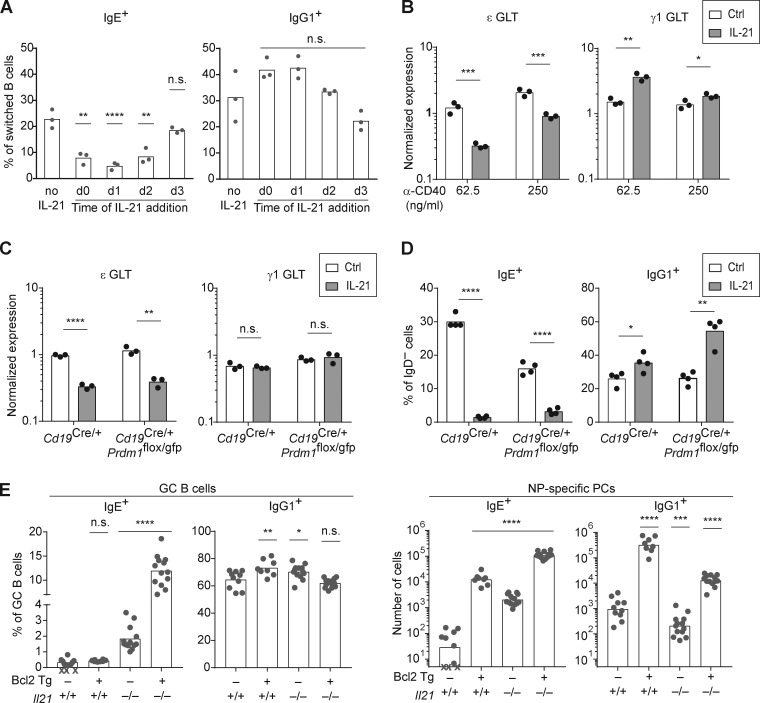
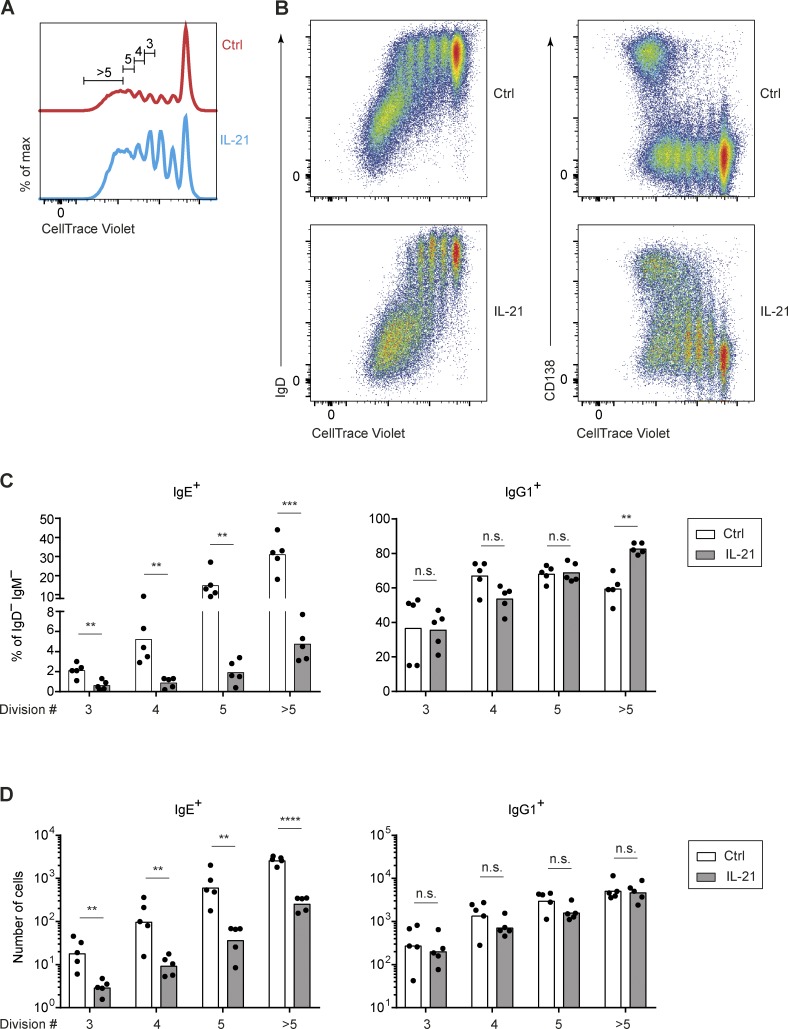
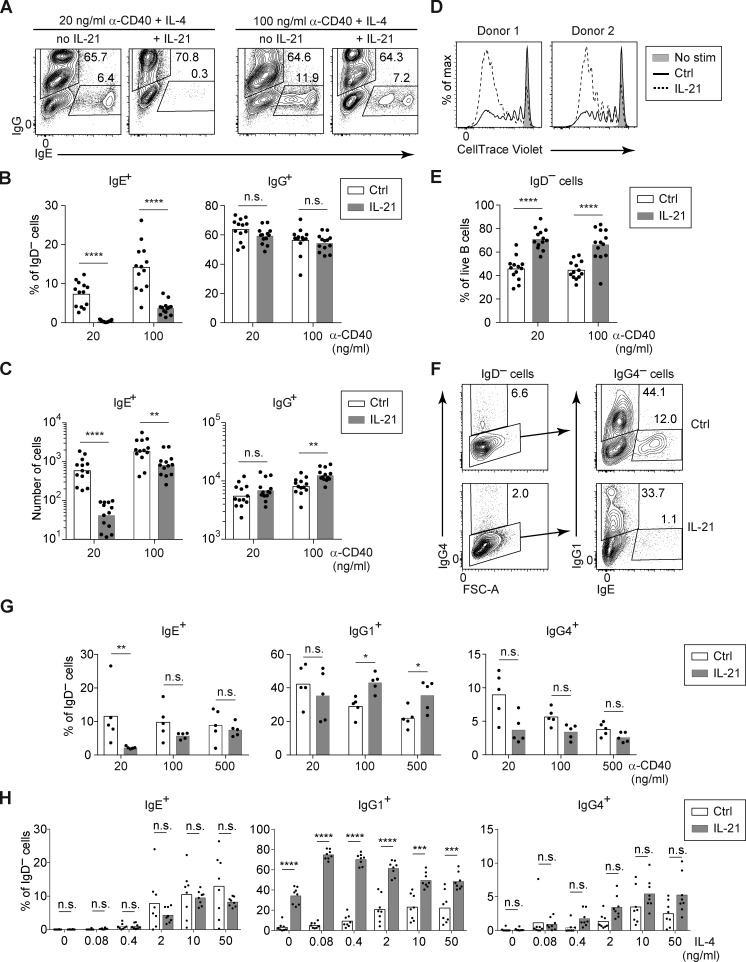
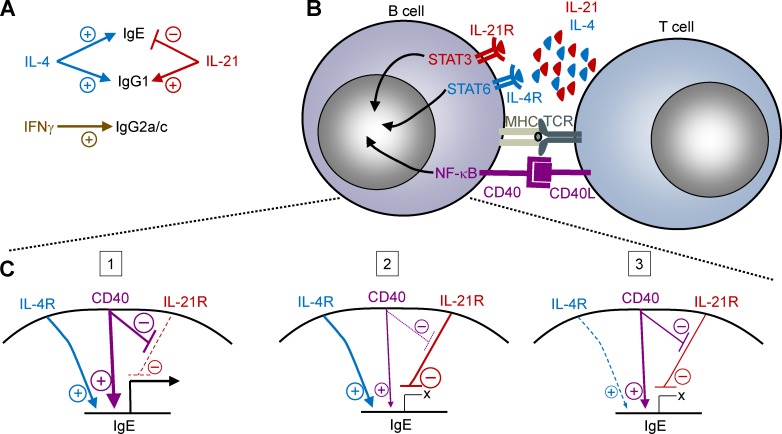
IgE antibodies may elicit potent allergic reactions, and their production is tightly controlled. The tendency to generate IgE has been thought to reflect the balance between type 1 and type 2 cytokines, with the latter promoting IgE. Here, we reevaluated this paradigm by a direct cellular analysis, demonstrating that IgE production was not limited to type 2 immune responses yet was generally constrained in vivo. IL-21 was a critical negative regulator of IgE responses, whereas IFN-γ, IL-6, and IL-10 were dispensable. Follicular helper T cells were the primary source of IL-21 that inhibited IgE responses by directly engaging the IL-21 receptor on B cells and triggering STAT3-dependent signaling. We reconciled previous discordant results between mouse and human B cells and revealed that the inhibition of IgE class switch recombination by IL-21 was attenuated by CD40 signaling, whereas IgG1 class switch recombination was potentiated by IL-21 in the context of limited IL-4. These findings establish key features of the extrinsic regulation of IgE production by cytokines.


Conflict of interest statement

Disclosures: The authors declare no competing interests exist.

Figures

Figure 1.
Figure 1.
The IgE response is broadly suppressed in vivo under multiple adjuvant conditions. (A) Representative flow cytometry of GC B cells and PCs from the draining LNs from a mouse immunized with NP-CGG in alum adjuvant (left) versus splenocytes cultured for 4 d after in vitro activation with anti-CD40 and IL-4 (right). (B) Representative flow cytometry to show the gating strategy used to identify NP-specific PCs and enumerate the relative frequencies of PCs expressing each isotype from the draining LNs of a mouse immunized with NP-CGG in alum adjuvant. (C) Cell number and frequency of IgE+, IgG1+, or IgG2c+ GC B cells and NP-specific PCs from the draining LNs of mice immunized with NP-CGG with the indicated adjuvants or no adjuvant (Ctrl). WT mice (B6/J from our colony [A] or purchased NCI B6 CD45.1 congenics [B and C]) were analyzed 7 d after subcutaneous immunization. Cells cultured in A were from a B6/J mouse bred in our colony. GC B cells were gated as B220hi CD138 PNAhi CD38lo IgD cells, and PCs were gated as B220lo CD138+ CD38lo IgD cells, as shown previously (Yang et al., 2012). NP-specific PCs were identified by total (intracellular and surface) staining with NP-APC. Isotype-specific cells were identified by total (IgG1 and IgG2c) or intracellular (IgE) staining (see Yang et al., 2012 and Materials and methods). IgM+ cells were excluded from the analysis in B and C by total IgM staining. Dots represent individual mice. Xs represent cell counts that were below the limit of detection. Bars represent the mean (frequency plots) or geometric mean (cell number plots). n.s., not significant; *, P < 0.05; ***, P < 0.001; ****, P < 0.0001 (one-way ANOVA with Dunnett’s post-test comparing each group to the leftmost control group). Data in A and B are representative of >10 and 5 experiments, respectively. Similar IgE and IgG1 responses as in C were observed in a separate experiment when mice were immunized with NP-KLH in alum, CFA, and SAS (data not shown). PNA, peanut agglutinin.
Figure S1.
Figure S1.
Total cell counts in draining LNs from mice immunized with various adjuvants. Related to Fig. 1. Cell counts are shown for the experiment shown in Fig. 1 C (see Fig. 1 legend for details). Mice were analyzed 7 d after subcutaneous immunization with NP-CGG and the indicated adjuvants or no adjuvant (Ctrl). Dots represent individual mice. Bars represent the mean (draining LN cellularity plot) or geometric mean (total GC B and NP-specific PCs plots). ****, P < 0.0001 (one-way ANOVA with Dunnett’s post-test comparing each group to the leftmost control group).
Figure 2.
Figure 2.
IL-21, rather than IFN-γ, is a major suppressor of IgE responses in vivo. (A–C) Mice were immunized subcutaneously with NP-CGG with the indicated adjuvants (A) or alum adjuvant (B and C). Draining LNs were collected and analyzed 7 d (A and B) or 7–21 d (C) after immunization, and then cells were analyzed by flow cytometry to enumerate isotype-specific GC B cells and NP-specific PCs as in Fig. 1. (A) Frequency of IgE+, IgG1+, and IgG2c+ cells in the GC B cell and NP-specific PC compartments in WT, Il21−/−, and Ifng−/− mice. (B) Frequency of IgE+ and IgG1+ cells in the GC B cell and NP-specific PC compartments in WT, Il21−/−, and Il21r−/− mice. (C) Kinetic analysis of the frequency of IgE+ and IgG1+ B cells among GC B cells in WT, Il21−/−, and Il21r−/− mice. WT mice were B6/J (purchased from The Jackson Laboratory; A) or a mixture of purchased B6/J mice and WT mice on a B6 background bred in our colony (B and C). Dots represent individual mice. Bars represent the mean. n.s., not significant; *, P < 0.05; ***, P < 0.001; ****, P < 0.0001 (two-way ANOVA with Dunnett’s post-test comparing each knockout to the WT group [A] or one-way ANOVA with Dunnett’s post-tests for multiple comparisons [B]). Similar IgE and IgG1 responses as in A were observed in a separate experiment when mice were immunized with NP-CGG in alum (data not shown). Data in B are compiled from three experiments. Data in C at day 7 were from one experiment represented in B.
Figure S2.
Figure S2.
IL-21 selectively suppresses IgE responses in vivo. Related to Fig. 2. Cell counts are shown for the experiments in Fig. 2 (see Fig. 2 legend for details). (A–C) Mice were immunized subcutaneously with NP-CGG with the indicated adjuvants (A and B) or alum adjuvant (C). Draining LNs were collected and analyzed 7 d after immunization. (A and B) Total cell counts in draining LNs and enumeration of the number of total GC B cells and NP-specific PCs (A) and the number of IgE+, IgG1+, and IgG2c+ cells in the GC B cell and NP-specific PC compartments (B) in immunized WT, Il21−/−, and Ifng−/− mice. (C) Quantification of the number of IgE+ and IgG1+ cells in the GC B cell and NP-specific PC compartments in WT, Il21−/−, and Il21r−/− mice. Dots represent individual mice. Xs represent cell counts that were below the limit of detection. Bars represent the mean (draining LN cellularity plot) or geometric mean (cell number plots). n.s., not significant; *, P < 0.05; **, P < 0.01; ***, P < 0.001; ****, P < 0.0001 (two-way ANOVA with Dunnett’s post-test comparing each knockout to the WT group [A and B] and one-way ANOVA with Dunnett’s post-test for multiple comparisons [C]).
Figure 3.
Figure 3.
IL-21 suppresses IgE responses through the IL-21R–STAT3 signaling axis in B cells. Draining LNs were collected 7 d after subcutaneous immunization with NP-CGG in alum adjuvant, and then cells were analyzed by flow cytometry to enumerate isotype-specific GC B cells and NP-specific PCs as in Fig. 1. (A) Groups of BM chimeras generated to test the impact of selective deficiency of the IL-21R in B cells. The indicated combinations of BM cells were transplanted into lethally irradiated μMT recipient mice. WT BM was obtained from a B6/J mouse bred in our colony. The expected frequencies of cells capable of IL-21R expression (frequency Il21r+/+) are indicated. (B) Frequency of IgE+ and IgG1+ cells in the GC B cell and NP-specific PC compartments in BM chimeras generated as in A. (C and D) Frequency of IgE+ and IgG1+ cells in the GC B cell and NP-specific PC compartments in mice with conditional Stat3 deletion in B cells (C) or T cells (D). Control mice were littermates. Il21r−/− mice were included for comparison in C. (E) Groups of BM chimeras generated to test the cell intrinsic role of STAT3 in B cells. The WT CD45.1 BM donor was a purchased NCI B6 CD45.1 mouse. The Cd19+/+ Stat3+/+ BM was from a B6 mouse bred in our colony. The Cd19+/+ Stat3f/f BM and Cd19Cre/+ Stat3f/f BM were from littermates. The indicated mixtures of BM cells were transferred into lethally irradiated CD45.1 WT recipients (NCI B6 CD45.1). (F) Fold change in the ratio of IgE+ cells to IgG+ cells (IgE/IgG1) among CD45.2 cells compared with CD45.1 cells in the GC B cell and PC compartments in the mixed BM chimeras generated as in E. The calculation of the ratio is indicated in the box on the right. Note that total PCs (rather than NP-specific PCs) were enumerated to allow for quantification of CD45.1+ vs. CD45.2+ cells. (G) Frequency of IgE+ and IgG1+ cells in GC B cell and NP-specific PC compartments in WT, Il6−/−, Il10−/−, and Il21−/− mice. WT mice were B6/J bred in our colony. Dots represent individual mice. Bars represent the mean (frequency plots) or geometric mean (relative IgE/IgG1 plots). n.s., not significant; *, P < 0.05; **, P < 0.01; ****, P < 0.0001 (t tests with the Holm-Sidak correction for multiple comparisons [B] or one-way ANOVA with Dunnett’s post-test comparing each group to the leftmost control group [C, D, F, and G]). The B cell–intrinsic role shown in A, B, E, and F was confirmed in a separate set of chimeras with a mixture of Il21r+/+ and Il21r−/− B cells (data not shown). Data in C and D are representative of three experiments. The comparison of WT, Il10−/−, and Il21−/− mice in G was confirmed in a separate experiment.
Figure 4.
Figure 4.
IgE responses in vivo are inhibited by IL-21 derived primarily from Tfh cells. Draining LNs were collected 7 d after subcutaneous immunization with NP-CGG in alum adjuvant, and then cells were analyzed by flow cytometry to enumerate isotype-specific GC B cells and NP-specific PCs as in Fig. 1. (A) Groups of BM chimeras generated to test the impact of selective deficiency of IL-21 in Tfh cells. The indicated combinations of BM cells were transplanted into lethally irradiated Il21−/− mice. The expected frequencies of cells capable of IL-21 expression (frequency Il21+/+) in the Tfh and non-Tfh cell compartments in the resultant chimeras are indicated. Donor frequencies were confirmed in the chimeras by congenic markers as follows: WT BM was from a Boy/J (CD45.1) mouse bred in our colony. The Il21−/− BM was CD45.1, derived from backcrossing Il21−/− B6 to Boy/J congenic mice. The CD4-Cre, Bcl6f/f BM, and control Bcl6f/f BM were from littermates (with the CD45.2 congenic marker). The recipient mice were Il21−/− CD45.1/CD45.2. (B) Frequency of IgE+ and IgG1+ cells in the GC B cell and NP-specific PC compartments of the mixed BM chimeras generated as in A. Dots represent individual mice. Bars represent the mean. n.s., not significant; **, P < 0.01; ****, P < 0.0001 (one-way ANOVA with Dunnett’s post-test comparing each group to group 1). Data in B were pooled from two experiments.
Figure 5.
Figure 5.
IL-21 inhibits IgE and promotes IgG1 responses of cultured mouse B cells depending on the strength of CD40 and IL-4 signals. (A and B) Representative flow cytometry of IgD activated B cells (A) and quantification of the frequency of IgE+ and IgG1+ cells (B). Purified B cells were cultured for 4 d with a fixed concentration of IL-4 (12.5 ng/ml) and the indicated concentrations of anti-CD40 (α-CD40) in the presence or absence of IL-21 (50 ng/ml). (C) Quantification of the frequency of IgE+ and IgG1+ cells among IgD activated B cells. Splenocytes were cultured for 4 d with a fixed concentration of anti-CD40 (125 ng/ml) and the indicated concentrations of IL-4 in the presence or absence of IL-21 (25 ng/ml). (D) Representative flow cytometry of B cells (gated as B220+) after splenocytes were incubated with the indicated cytokines (IL-21, IFN-γ, or IL-10; 100 ng/ml each) for 20 min at 37°C. (E) Representative flow cytometry of B cells (gated as B220+) and CD4+ T cells (gated as CD4+) after splenocytes were incubated with the indicated cytokines (IL-21, IL-6, or IL-4; 50 ng/ml each) for 15 min at 37°C. (F) Quantification of the frequency of IgE+ and IgG1+ cells among IgD activated B cells. Purified B cells were cultured for 4 d with anti-CD40 (125 ng/ml) and IL-4 (12.5 ng/ml) alone (Ctrl) or with the addition of the indicated cytokines (IL-21 50 ng/ml, IFN-γ 25 ng/ml, or IL-10 25 ng/ml). (G) Representative flow cytometry of IgE+ and IgG1+ B cells within the population of class-switched B cells (B220+ IgD IgM) after splenocytes were cultured for 4 d with anti-CD40 (62.5 ng/ml) and IL-4 (25 ng/ml) in the presence or absence of IL-6 (81 ng/ml). Cells were from WT mice on a B6 background or Boy/J CD45.1 congenic mice bred in our colony. Dots represent data points of cells from individual mice, and bars represent the mean (B, C, and F). n.s., not significant; *, P < 0.05; **, P < 0.01; ***, P < 0.001 (t tests with the Holm-Sidak correction for multiple comparisons [B and C] or one-way ANOVA followed by Dunnett’s post-test comparing each cytokine treatment to the control [F]). Data were pooled from four experiments (B) or three experiments (F) or are representative of two experiments (C–E) or three experiments (G).
Figure 6.
Figure 6.
IL-21 acts independently of apoptosis and inhibits IgE germline transcription. (A) Quantification of the frequency of IgE+ and IgG1+ B cells among class-switched B cells (B220+ IgD IgM) 4 d after mouse splenocytes were cultured with anti-CD40 (62.5 ng/ml) and IL-4 (12.5–25 ng/ml), with IL-21 (25 ng/ml) added at different time points (compared with no IL-21 control). (B) Relative quantification of IgE (ε) and IgG1 (γ1) GLTs from purified mouse B cells cultured for 3 d with IL-4 (12.5 ng/ml) and the indicated concentrations of anti-CD40 in the presence or absence of IL-21 (50 ng/ml). GLT expression was normalized by endogenous Hprt transcripts. (C) Relative quantification of ε and γ1 GLT from purified B cells of the indicated genotypes that were cultured with anti-CD40 (125 ng/ml) and IL-4 (12.5 ng/ml) for 1 d before the addition of IL-21 (50 ng/ml) to the indicated samples. RNA was isolated 8 h after the addition of IL-21, and GLT expression was normalized by endogenous Hprt transcripts. (D) Quantification of the frequency of IgE+ and IgG1+ B cells among activated B cells (B220+ IgD) 4 d after purified B cells of the indicated genotypes were cultured with anti-CD40 (62.5 ng/ml) and IL-4 (12.5 ng/ml). IL-21 (50 ng/ml) was added on day 1 to the indicated samples. (E) Quantification of the frequency of IgE+ and IgG1+ cells in the GC B cell and NP-specific PC compartments from draining LNs of mice with the indicated genotypes 14 d after subcutaneous immunization with NP-CGG in alum adjuvant. Isotype-specific GC B cells and NP-specific PCs were enumerated by flow cytometry as in Fig. 1. Cells in A and B were from WT mice on a B6 background or Boy/J CD45.1 congenic mice bred in our colony, and cells in C and D were from BM chimeras that were generated by injecting BM from donors with the indicated genotypes (CD45.2), bred in our colony, into irradiated NCI B6 CD45.1 congenic recipients. In E, for each given Il21 genotype (Il21+/+ or Il21−/−), the Bcl2 Tg and Tg+ mice were littermates. Dots represent data points derived from individual mice. Xs represent cell counts that were below the limit of detection. Bars represent the mean (A–D and E, left panel) or the geometric mean (E, right panel). n.s., not significant; *, P < 0.05; **, P < 0.01; ***, P < 0.001; ****, P < 0.0001 (one-way ANOVA followed by Dunnett’s post-test [A and E] comparing each condition to the leftmost column or t tests with the Holm-Sidak correction for multiple comparisons [B–D] comparing the presence or absence of IL-21 within each group). Cells were from three experiments (A and B) or two experiments (D), or data were pooled from two experiments (E). Similar results as in C were observed in WT mice in a separate experiment.
Figure S3.
Figure S3.
The inhibition of the generation of IgE-producing B cells by IL-21 in vitro is independent of cell division. Related to Fig. 6. Purified mouse B cells, labeled with CellTrace Violet, were cultured for 4 d with anti-CD40 (62.5 ng/ml) and IL-4 (12.5 ng/ml), with the addition of IL-21 (50 ng/ml) to the indicated samples on day 1. (A) Representative flow cytometry of cell divisions shown by dilution of CellTrace Violet dye. Cells that had undergone three to six divisions were gated for further analysis. (B) Representative flow cytometry showing B cell activation and CSR (IgD, left) and PC differentiation (CD138+, right) in relation to CellTrace Violet dilution. (C and D) Quantification of the frequency (C) and number (D) of IgE+ and IgG1+ cells among IgDIgM cells in different cell divisions. Cells were from WT mice on a B6 background bred in our colony. Dots represent data points from individual mice (C and D). Bars represent the mean (C) or the geometric mean (D). n.s. not significant; **, P < 0.01; ***, P < 0.001; ****, P < 0.0001 (t tests with the Holm-Sidak correction for multiple comparisons [C and D]). Data in C and D awere pooled from four experiments.
Figure 7.
Figure 7.
IL-21 inhibits IgE and promotes IgG1 responses of cultured human B cells depending on the strength of CD40 and IL-4 signals. Total B cells (A–E) or naive B cells (F–H) were purified from human tonsils and cultured for 7 d with anti-CD40 (as indicated) and IL-4 (20 ng/ml, except in H), in the presence or absence of IL-21 (20 ng/ml). (A–C) Representative flow cytometry (A) and quantification of the frequency (B) and total number (C) of IgG+ and IgE+ cells among IgD cells from cultures of total B cells with the indicated concentrations of anti-CD40 and a fixed concentration of IL-4 (20 ng/ml) in the presence or absence of IL-21. (D) Representative flow cytometry showing proliferation of total B cells cultured from human tonsils with anti-CD40 (100 ng/ml) and IL-4, in the presence or absence of IL-21, as measured by dilution of CellTrace Violet. (E) Frequency of activated (IgD) cells among total tonsil B cells after culture with anti-CD40 (as indicated) and IL-4, in the presence or absence of IL-21, quantified as a percentage of live cells. (F–H) Representative flow cytometry (F) and quantification (G and H) of the frequency of IgG4+, IgG1+, and IgE+ B cells, quantified as a percentage of IgD cells, after culturing naive B cells. (F) Naive B cells were cultured with anti-CD40 (20 ng/ml) and IL-4 in the presence or absence of IL-21. Cells were pregated as IgD (left panels) to identify IgG4+ cells; gates for IgG1+ and IgE+ cells were then drawn within the IgG4 population (right panels). IgG1+ and IgG4+ populations were gated sequentially to account for cross-reactivity of the anti-IgG1 antibody with IgG4. (G) Naive B cells were cultured with a variable concentration of anti-CD40 as indicated with a fixed concentration of IL-4 (20 ng/ml), in the presence or absence of IL-21. (H) Naive B cells were cultured with a fixed concentration of anti-CD40 (100 ng/ml) and a variable concentration of IL-4, as indicated, in the presence or absence of IL-21. Dots represent data points from individual donors. Bars represent arithmetic (B, E, G, and H) or geometric (C) means. n.s., not significant; *, P < 0.05; **, P < 0.01; ***, P < 0.001; ****, P < 0.0001 (t tests with the Holm-Sidak correction for multiple comparisons). Data were pooled from 10 experiments (B, C, and E), five experiments (G), or two experiments (H). In D, each donor is from a different experiment, and the results for each donor were replicated in another experiment.
Figure 8.
Figure 8.
Models of the regulation of IgE CSR. (A) Our data indicate that while IL-4 promotes both IgE and IgG1 CSR, IL-21 inhibits IgE CSR but promotes IgG1 CSR. IL-21 appears to be the key negative regulator of IgE under a broad range of conditions in both mouse and human B cells. We observed that IFN-γ was required for IgG2a/c CSR but in vivo had no physiological impact on IgE and IgG1 CSR under the conditions tested. (B) Model of the interaction of a T cell (such as a Tfh cell) with a B cell. Our data indicate that IL-21 produced by T cells, signaling via the IL-21R and STAT3 in B cells, inhibits IgE germline transcription, thereby preventing IgE CSR. Conversely, IL-4, signaling via the IL-4R and STAT6; and CD40L, signaling via CD40 and NF-κB; are known to directly promote IgE germline transcription in B cells (Geha et al., 2003). The model does not exclude the possibility that other signaling pathways downstream of these receptors may also contribute to IgE regulation. The hatched lines show an expanded view of the regulation of IgE germline transcription by these receptors in C. (C) Model of the regulation of IgE germline transcription by the relative strength of IL-4R, CD40, and IL-21R signaling in B cells. Quantitative differences in signals from these receptors may depend on the extent and/or duration of receptor ligation (such as differences in the relative amounts of IL-4, IL-21, and CD40L expressed by T cells, versus the duration of T cell–B cell contacts). Three cases are provided for consideration: (1) IgE germline transcription is promoted in the context of strong IL-4R and CD40 signals. The CD40 signals attenuate the inhibitory signals downstream of the IL-21R. (2) When CD40 signals are weaker, strong IL-21R signals can inhibit IgE germline transcription, even in the presence of strong IL-4R signals. (3) When IL-4R signals are too weak, only minimal IgE germline transcription would occur regardless of the relative strength of CD40 and IL-21R signals. Note that in all three cases, IgG1 germline transcription would be promoted by these signals, and thus cases 2 or 3 would lead to a bias toward IgG1 CSR rather than IgE CSR.

References

    1. Aalberse R.C., Platts-Mills T.A., and Rispens T.. 2016. The Developmental History of IgE and IgG4 Antibodies in Relation to Atopy, Eosinophilic Esophagitis, and the Modified TH2 Response. Curr. Allergy Asthma Rep. 16:45 10.1007/s11882-016-0621-x - DOI - PMC - PubMed
    1. Achatz-Straussberger G., Zaborsky N., Königsberger S., Luger E.O., Lamers M., Crameri R., and Achatz G.. 2008. Migration of antibody secreting cells towards CXCL12 depends on the isotype that forms the BCR. Eur. J. Immunol. 38:3167–3177. 10.1002/eji.200838456 - DOI - PMC - PubMed
    1. Akdis M., and Akdis C.A.. 2014. Mechanisms of allergen-specific immunotherapy: multiple suppressor factors at work in immune tolerance to allergens. J. Allergy Clin. Immunol. 133:621–631. 10.1016/j.jaci.2013.12.1088 - DOI - PubMed
    1. Alcántara-Montiel J.C., Staines-Boone T., López-Herrera G., Berrón-Ruiz L., Borrego-Montoya C.R., and Santos-Argumedo L.. 2016. Somatic mosaicism in B cells of a patient with autosomal dominant hyper IgE syndrome. Eur. J. Immunol. 46:2438–2443. 10.1002/eji.201546275 - DOI - PubMed
    1. Avery D.T., Ma C.S., Bryant V.L., Santner-Nanan B., Nanan R., Wong M., Fulcher D.A., Cook M.C., and Tangye S.G.. 2008. STAT3 is required for IL-21-induced secretion of IgE from human naive B cells. Blood. 112:1784–1793. 10.1182/blood-2008-02-142745 - DOI - PubMed

Publication types

MeSH terms