

Comparative and population genomics approaches reveal the basis of adaptation to deserts in a small rodent
- PMID: 32130752
- PMCID: PMC7204510
- DOI: 10.1111/mec.15401
Comparative and population genomics approaches reveal the basis of adaptation to deserts in a small rodent
Abstract
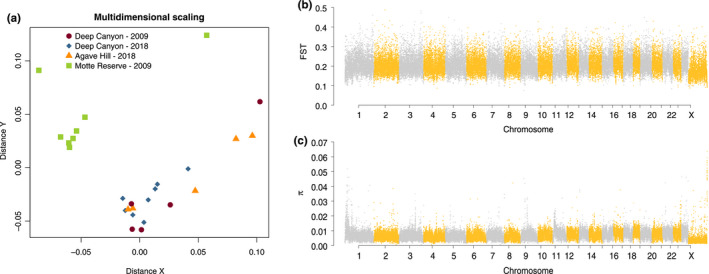
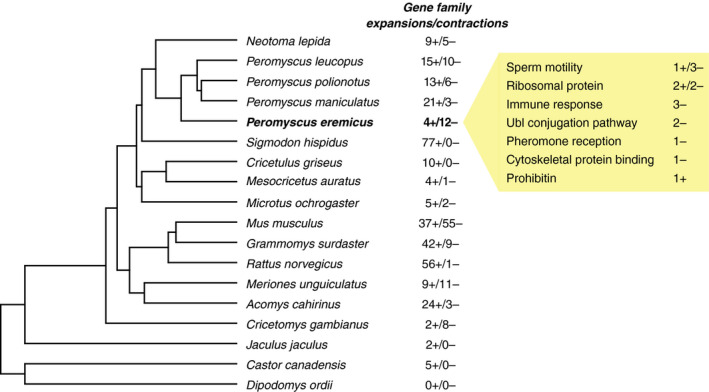
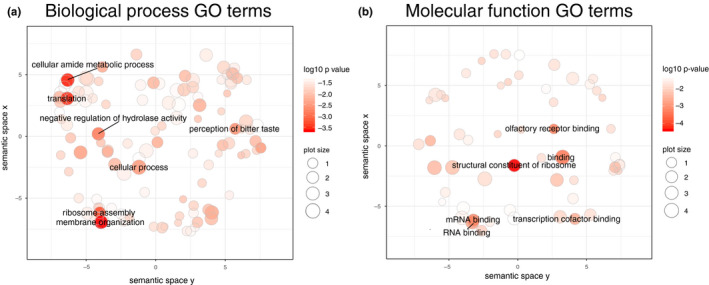
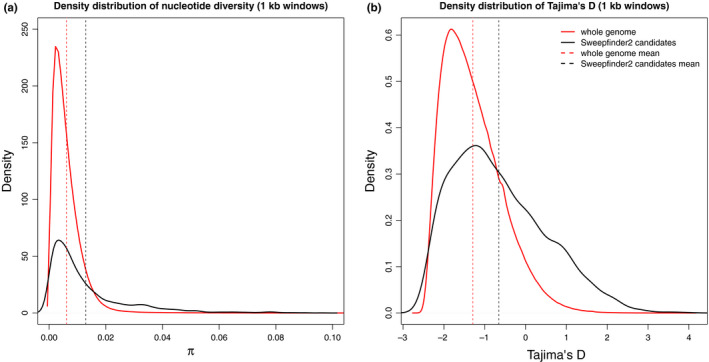
Organisms that live in deserts offer the opportunity to investigate how species adapt to environmental conditions that are lethal to most plants and animals. In the hot deserts of North America, high temperatures and lack of water are conspicuous challenges for organisms living there. The cactus mouse (Peromyscus eremicus) displays several adaptations to these conditions, including low metabolic rate, heat tolerance, and the ability to maintain homeostasis under extreme dehydration. To investigate the genomic basis of desert adaptation in cactus mice, we built a chromosome-level genome assembly and resequenced 26 additional cactus mouse genomes from two locations in southern California (USA). Using these data, we integrated comparative, population, and functional genomic approaches. We identified 16 gene families exhibiting significant contractions or expansions in the cactus mouse compared to 17 other Myodontine rodent genomes, and found 232 sites across the genome associated with selective sweeps. Functional annotations of candidate gene families and selective sweeps revealed a pervasive signature of selection at genes involved in the synthesis and degradation of proteins, consistent with the evolution of cellular mechanisms to cope with protein denaturation caused by thermal and hyperosmotic stress. Other strong candidate genes included receptors for bitter taste, suggesting a dietary shift towards chemically defended desert plants and insects, and a growth factor involved in lipid metabolism, potentially involved in prevention of dehydration. Understanding how species adapted to deserts will provide an important foundation for predicting future evolutionary responses to increasing temperatures, droughts and desertification in the cactus mouse and other species.
Keywords: Peromyscus eremicus; bitter taste receptor; hyperosmotic stress; ribosomal protein; selective sweeps; thermal stress.
© 2020 The Authors. Molecular Ecology published by John Wiley & Sons Ltd.
Figures
References
-
- Ai, H. , Fang, X. , Yang, B. , Huang, Z. , Chen, H. , Mao, L. , … Huang, L. (2015). Adaptation and possible ancient interspecies introgression in pigs identified by whole‐genome sequencing. Nature Genetics, 47(3), 217–225. - PubMed
-
- Barko, V. A. , & Feldhamer, G. A. (2002). Cotton mice (Peromyscus gossypinus) in southern Illinois: Evidence for hybridization with white‐footed mice (Peromyscus leucopus). The American Midland Naturalist, 147(1), 109–116.
-
- Barrett, R. D. H. , & Schluter, D. (2008). Adaptation from standing genetic variation. Trends in Ecology & Evolution, 23(1), 38–44. - PubMed
-
- Berner, D. , & Salzburger, W. (2015). The genomics of organismal diversification illuminated by adaptive radiations. Trends in Genetics, 31(9), 491–499. - PubMed
Publication types
MeSH terms
Grants and funding
LinkOut - more resources
Full Text Sources
