Review
. 2020 Mar 25;142(12):5449-5460.
doi: 10.1021/jacs.9b07820. Epub 2020 Mar 13.

Dynamics of Co-translational Membrane Protein Integration and Translocation via the Sec Translocon

Affiliations
Review

Dynamics of Co-translational Membrane Protein Integration and Translocation via the Sec Translocon

Michiel J M Niesen et al. J Am Chem Soc. .

Abstract

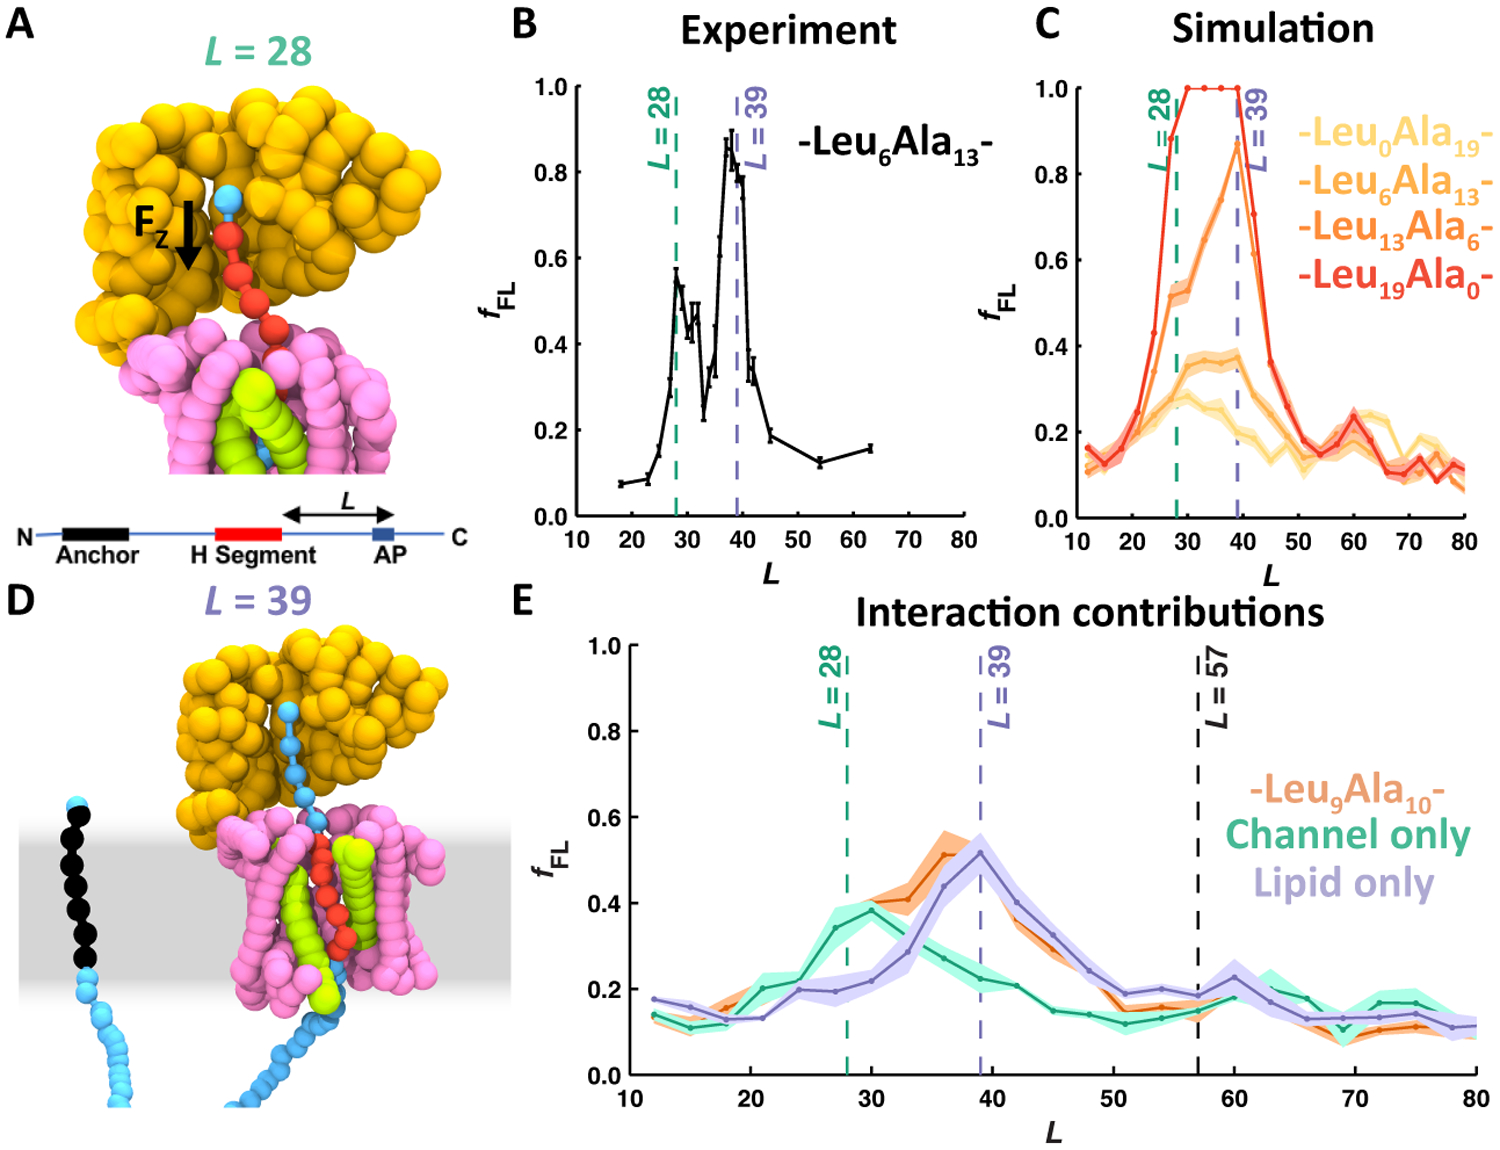
An important aspect of cellular function is the correct targeting and delivery of newly synthesized proteins. Central to this task is the machinery of the Sec translocon, a transmembrane channel that is involved in both the translocation of nascent proteins across cell membranes and the integration of proteins into the membrane. Considerable experimental and computational effort has focused on the Sec translocon and its role in nascent protein biosynthesis, including the correct folding and expression of integral membrane proteins. However, the use of molecular simulation methods to explore Sec-facilitated protein biosynthesis is hindered by the large system sizes and long (i.e., minute) time scales involved. In this work, we describe the development and application of a coarse-grained simulation approach that addresses these challenges and allows for direct comparison with both in vivo and in vitro experiments. The method reproduces a wide range of experimental observations, providing new insights into the underlying molecular mechanisms, predictions for new experiments, and a strategy for the rational enhancement of membrane protein expression levels.


Figures

Figure 1:
Figure 1:
Structural representation of the ribosome-translocon complex from (A) cryoEM (PDB ID: 3J7R) (B) and CGMD. The ribosome(orange), shown cropped, is docked at the cytosolic opening of the Sec translocon (pink). The lateral gate (LG) helices of the translocon (green) can separate to create a lateral opening into the ER membrane (grey region) through which transmembrane domains can partition into the lipid membrane.
Figure 2:
Figure 2:
CG models that can directly simulate the minute-timescale process of protein synthesis and integration. (A) Frames from a trajectory simulating the integration of a multispanning IMP (red for TMDs and blue elsewhere), using the original 2D version of the CGMD model. The model explicitly captures the sterics and charges from the ribosome (orange) and translocon (pink). The membrane (grey region) and solvent are treated implicitly. (B) Example mapping of an amino-acid sequence into its CG representation. CG beads are composed of three amino acids, and inherit charges (qi) and hydrophobicity (gi) from their constituents. In the 3D model, each bead is also assigned a secondary structure, which affects its interactions with the membrane. (C) Simulation snapshot of the integration of a single-spanning membrane protein (TMD in red, blue elsewhere) using the most recent 3D version of the CGMD model. Panel B is adapted from Ref. , distributed under the terms of the Creative Commons CC BY license.
Figure 3:
Figure 3:
The role of energetics and kinetics in co-translational integration and translocation via the Sec translocon. (A) Schematic representation of several possible pathways for the integration (shaded red) and translocation (shaded blue) of a particular domain in a nascent protein sequence (red box). (B) The probability of membrane integration, p(integration), as a function of the number of leucine residues in a model 19-residue TMD (other residues are alanine). Results are shown for experiments and CGMD. (C) The distribution between the Type 1 integrated and Type 2 integrated product for a model signal sequence. (left) CGMD model simulation results showing the fraction of trajectories that reach the Type 2 topology as a function of the number of C-terminal loop residues, plotted for a normal translational rate (solid black) and a slowed translation rate (dashed red). (right) Experimental results from Göder et al, with a normal translation rate (solid black) and with a slowed translation rate (dashed red), due to addition of cycloheximide. Panels B and C are adapted from Ref. , distributed under the terms of the Creative Commons CC BY license.
Figure 4:
Figure 4:
For all seventeen GPCRs studied by Chitwood et al., comparison of the experimentally observed EMC dependence with the CGMD-predicted fraction of incorrect integration for TMD 1.
Figure 5:
Figure 5:
The post-translational ensemble of the dual-topology protein EmrE determines the final fully integrated topology via topological annealing. (A) Single residue mutations can change the ratio of fully integrated topologies for EmrE, relative to the roughly equal distribution observed for the wildtype sequence (left most pair of bars). The shift in the ratio of the fully integrated topologies obtained using CGMD (blue) agrees qualitatively with experiment (black). The mutated residue is indicated using a purple dot in the schematics, with the schematic drawn in the dominant topology as determined using CGMD. (B) CGMD simulations suggest a mechanism via which mutations late in the NC sequence affect the final topology; there is a strong correlation between the end-of-translation topology (left) and the fully integrated topology (right). The location of the slowest-flipping loop (purple) in the end-of-translation topology determines the final topology. (C) A quantification of the effect shown schematically in part (B). Figure adapted from Ref. , distributed under the terms of the Creative Commons CC BY license.
Figure 6:
Figure 6:
Revealing the molecular interactions that act on TMDs during their co-translational integration, using a combined CGMD and AP experiment approach. (A) Simulation snapshot indicating the force acting on the part of the NC at the top of the exit tunnel (black arrow) and a schematic depiction of the NC construct used in the presented simulations and experiments (bottom). The snapshot is for the construct with L = 28, coinciding with the first point during translation at which a significant pulling force is exerted on the NC. (B) Pulling-force profile determined using AP experiments; plotted is the fraction of full-length protein, fFL, as a function of L. Two peaks in force are observed, at L = 28 and L = 39. (C) Pulling-force profile determined using CGMD simulations; plotted in the same way as panel (B). Colors indicate data for H segments with varying amounts of hydrophobic leucine residues. (D) Simulation snapshot at L = 39, coinciding with the second peak in force on the NC. (E) Pulling-force profiles determined using CGMD, for simulations with full interactions (orange), without specific interactions between the NC and the lipid membrane (green), and without specific interactions between the NC and the translocon (purple). These data reveal that the first peak in force depends specifically on NC-translocon interactions, while the second peak in force depends specifically on NC-lipid interactions. Figure adapted with permission from Ref. , copyright 2018 Biophysical Society.
Figure 7:
Figure 7:
The simulated integration efficiency of TatC mutants is predictive of their expression levels. (A) Simulated integration efficiency is determined by the probability of the soluble loops (cyan) being correctly localized during CGMD co-translational integration. In the case of TatC, the C-terminal loop was found to often mislocalize, as shown in the schematic. (B) Integration and expression levels of different homologs and chimeras of TatC. Values are reported relative to the Aquifex aeolicus homolog. (C) Receiver operating characteristic of integration as a predictor for expression. Data are from 152 different mutants of TatC. (D) The survival and expression levels of 14 different mutants of TatC, each with a β-lactamase domain on the C-terminus, such that the cell can only survive if TatC misintegrates with its C-terminus in the periplasm. (E) The expression and integration values are shown for a series of TatC constructs with decreasing amounts of positive charge in the C-terminal tail. Panels C and D are adapted with permission from Ref. , copyright the American Society for Biochemistry and Molecular Biology. Panel E is adapted from Ref. , distributed under the terms of the Creative Commons CC BY license.

Similar articles

Cited by

References

    1. Rapoport TA Protein translocation across the eukaryotic endoplasmic reticulum and bacterial plasma membranes. Nature 2007, 450, 663–669. - PubMed
    1. White SH; von Heijne G How translocons select transmembrane helices. Annu. Rev. Biophys 2008, 37, 23–42. - PubMed
    1. von Heijne G Membrane-protein topology. Nat. Rev. Mol. Cell Biol 2006, 7, 909–918. - PubMed
    1. Cymer F; Von Heijne G; White SH Mechanisms of integral membrane protein insertion and folding. J. Mol. Biol 2015, 427, 999–1022. - PMC - PubMed
    1. Marshall SS; Niesen MJM; Müller A; Tiemann K; Saladi SM; Galimidi RP; Zhang B; Clemons WM Jr; Miller TF III A Link Between Integral Membrane Protein Expression and Simulated Integration Efficiency. Cell Rep. 2016, 16, 2169–2177. - PMC - PubMed

Publication types

MeSH terms

Substances