. 2020 May 6;106(3):482-497.e4.
doi: 10.1016/j.neuron.2020.02.005. Epub 2020 Mar 3.

Emergent Elements of Inspiratory Rhythmogenesis: Network Synchronization and Synchrony Propagation

Affiliations

Emergent Elements of Inspiratory Rhythmogenesis: Network Synchronization and Synchrony Propagation

Sufyan Ashhad et al. Neuron. .

Abstract

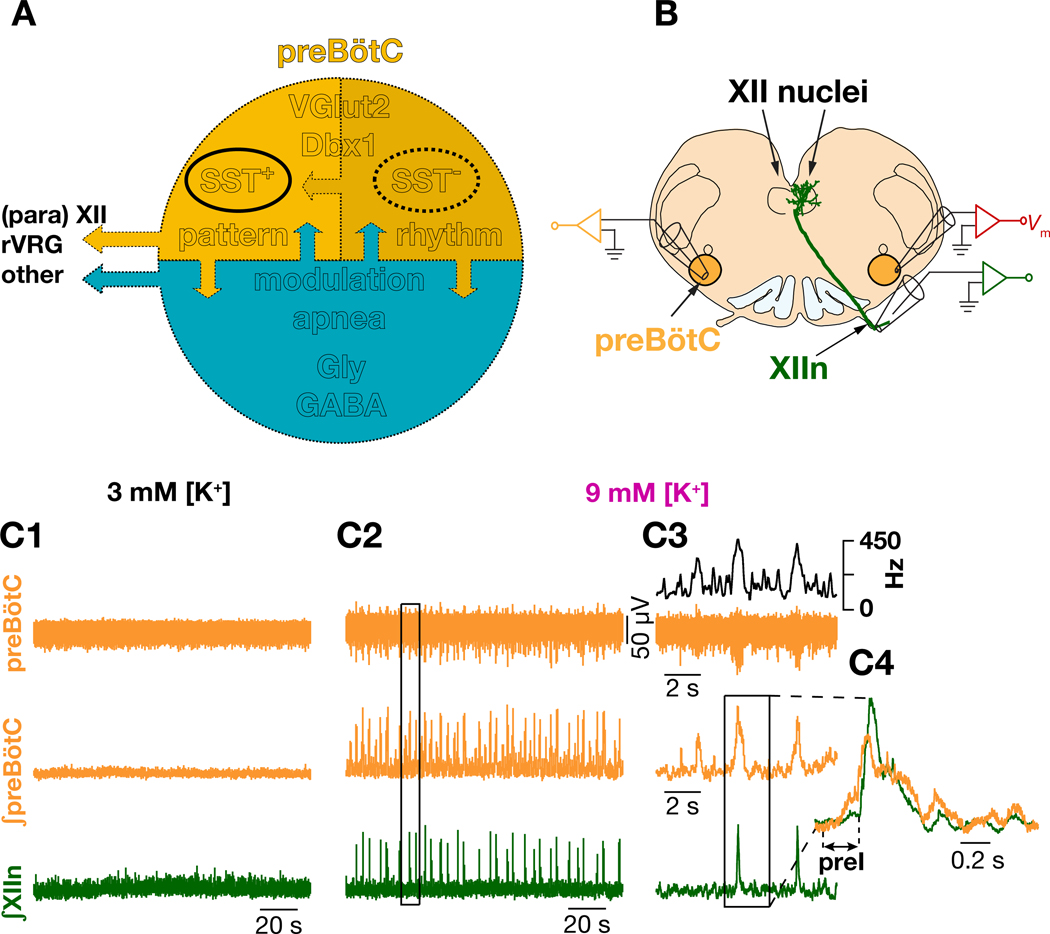
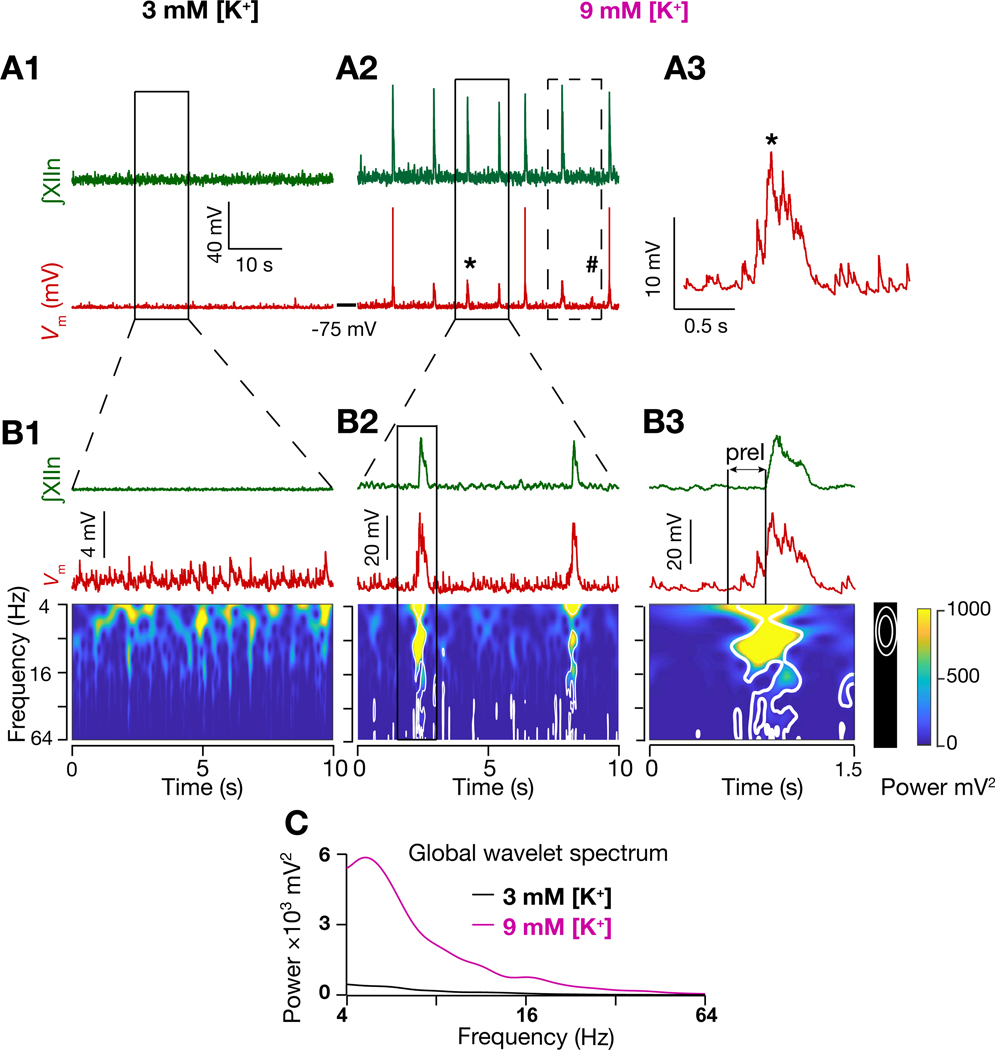
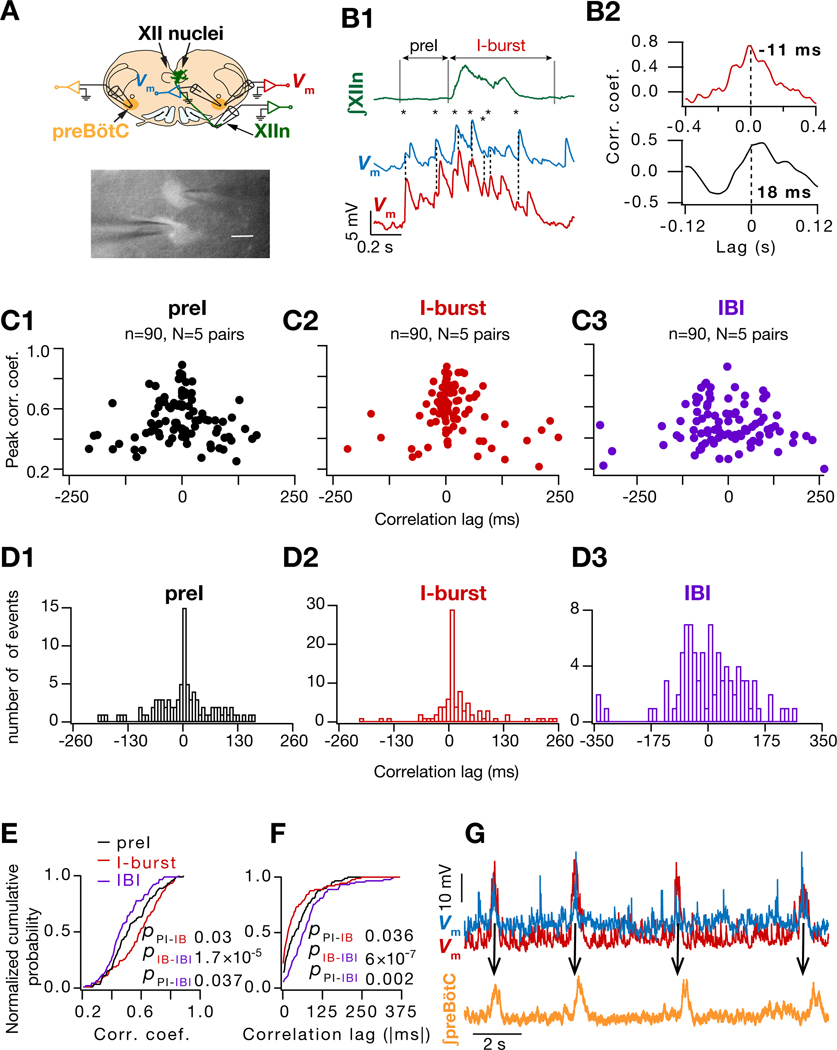
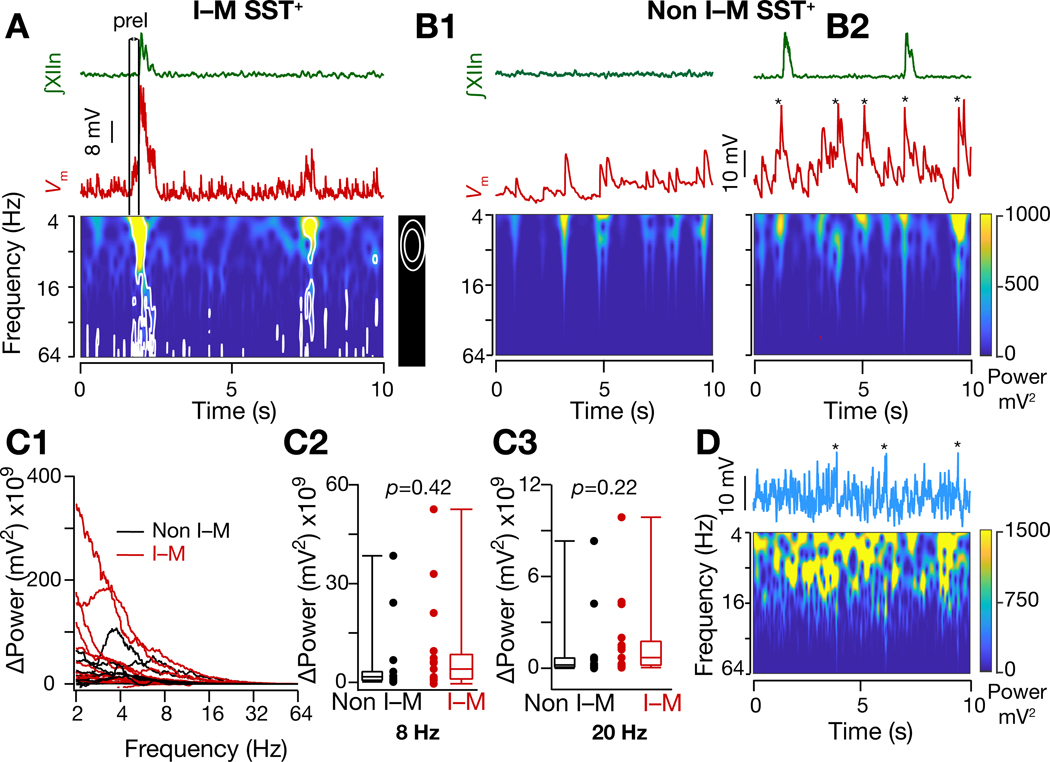
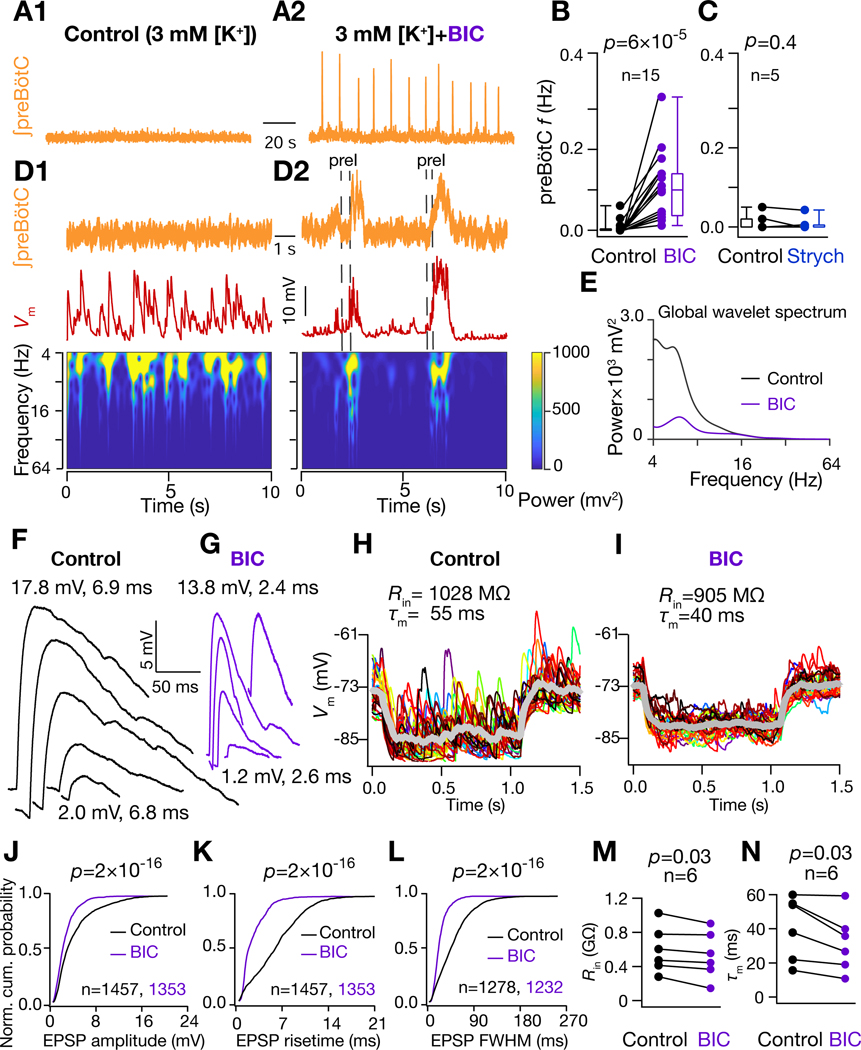
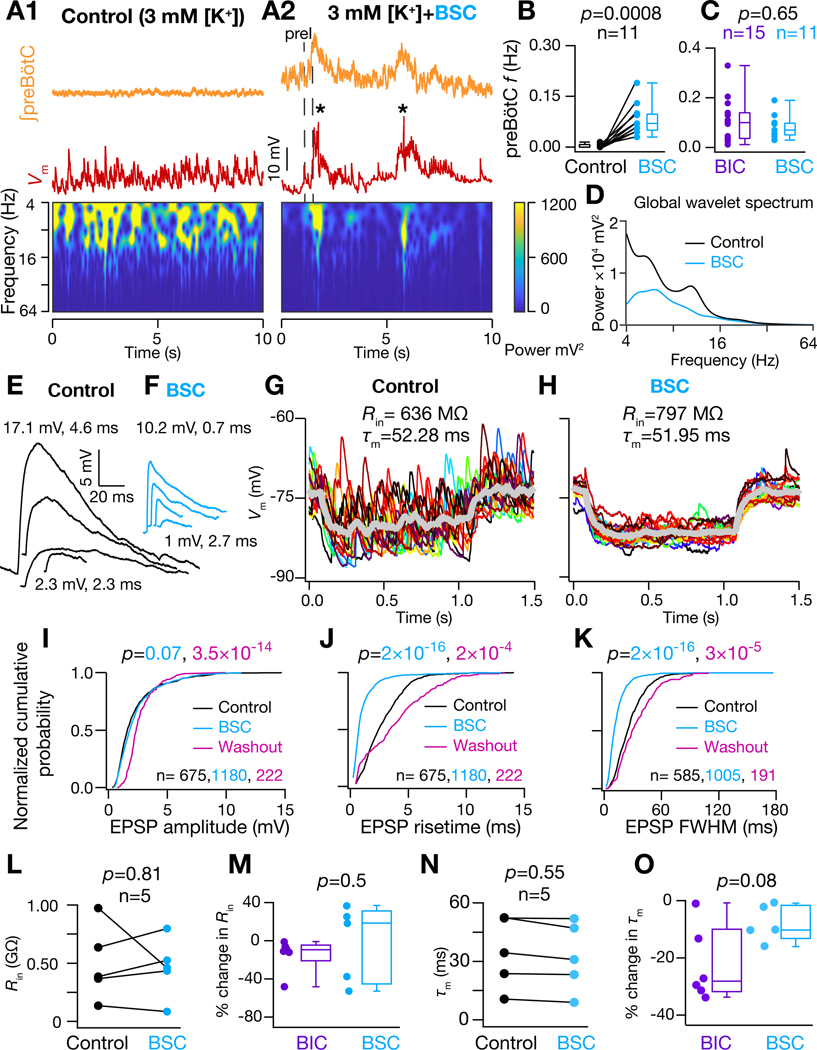
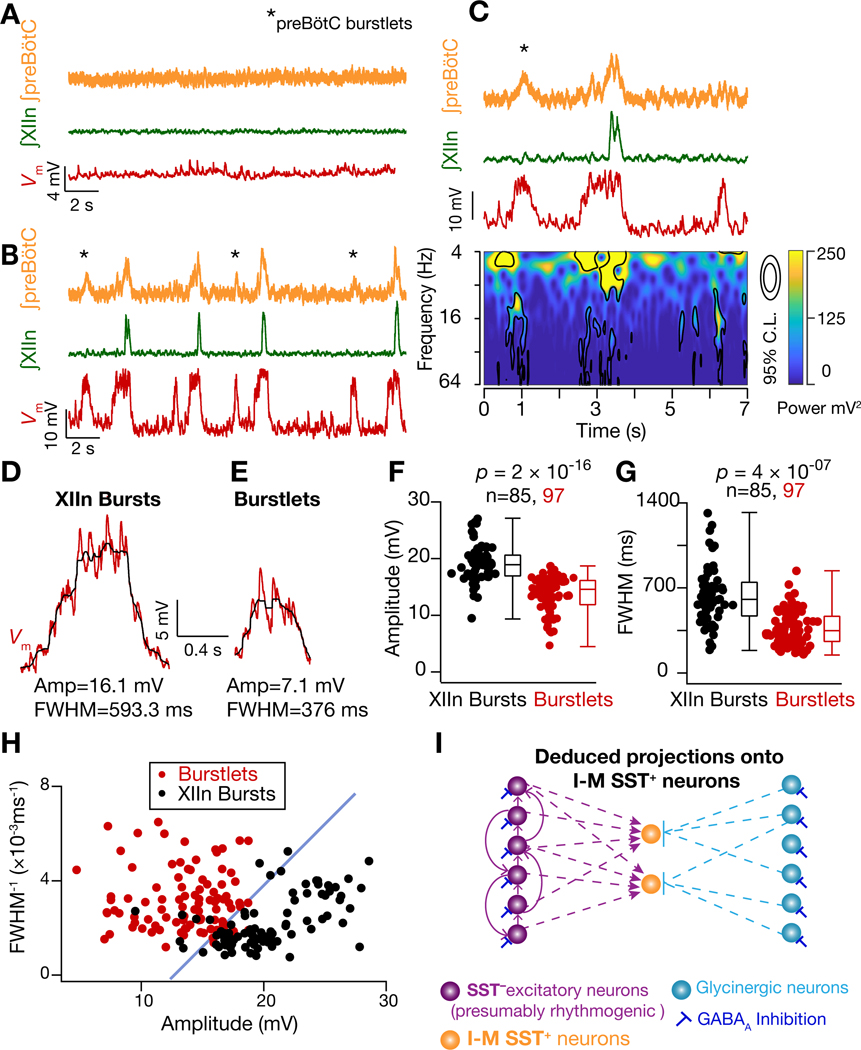
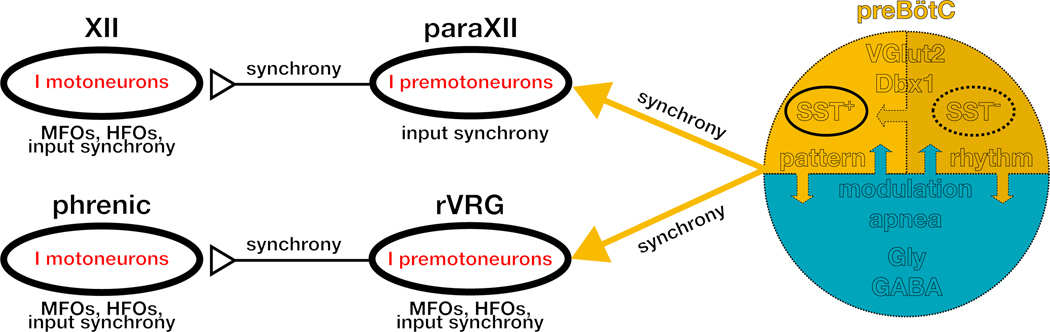
We assessed the mechanism of mammalian breathing rhythmogenesis in the preBötzinger complex (preBötC) in vitro, where experimental tests remain inconsistent with hypotheses of canonical rhythmogenic cellular or synaptic mechanisms, i.e., pacemaker neurons or inhibition. Under rhythmic conditions, in each cycle, an inspiratory burst emerges as (presumptive) preBötC rhythmogenic neurons transition from aperiodic uncorrelated population spike activity to become increasingly synchronized during preinspiration (for ∼50-500 ms), which can trigger inspiratory bursts that propagate to motoneurons. In nonrhythmic conditions, antagonizing GABAA receptors can initiate this synchronization while inducing a higher conductance state in nonrhythmogenic preBötC output neurons. Our analyses uncover salient features of preBötC network dynamics where inspiratory bursts arise when and only when the preBötC rhythmogenic subpopulation strongly synchronizes to drive output neurons. Furthermore, downstream propagation of preBötC network activity, ultimately to motoneurons, is dependent on the strength of input synchrony onto preBötC output neurons exemplifying synchronous propagation of network activity.

Keywords: breathing; central pattern generator; network dynamics; preBötzinger complex; rhythm; synaptic correlation; synchrony; synfire chain.


Conflict of interest statement

Declaration of Interests The authors declare no competing interests.

Figures

Figure 1.
Figure 1.. Diverse neuronal subtypes contribute to initiation and propagation of inspiratory rhythm in preBötzinger Complex
(A) Schematic representation of various preBötC neuronal subtypes whose roles in the generation and propagation inspiratory rhythm and patterns are discussed in the text (see Introduction). Upper half, yellow, represents excitatory neurons and the lower half, blue, represents the inhibitory neurons of preBötC. SST; somatostatin; Vglut2: vesicular glutamate transporter 2; Dbx1: developing brain homeobox protein 1; Gly; Glycinergic; GABA: γ-amino butyric acid; XII: hypoglossal nucleus, rVRG: rostral ventral respiratory group. Arrows indicate synaptic interactions. Both excitatory and inhibitory subpopulations send efferent projections (outward left arrows). (B) Configuration for simultaneous recording of preBötC SST+ neurons along with hypoglossal nerve (XIIn) and contralateral preBötC population activity. preBötC neurons project to XII premotor and motor neurons. (C) preBötC population activity (orange: integrated preBötC (∫preBötC)); green: integrated XIIn (∫XIIn)) in 3 mM [K+]ACSF, i.e., control, (C1), and in 9 mM [K+]ACSF (C2); (C3) expanded boxed region from (C2), top black trace: instantaneous preBötC population firing frequency. (C4) expanded boxed region from (C3) with ∫preBötC and ∫XIIn I-burst overlaid.
Figure 2.
Figure 2.. Inspiratory activity is correlated with spectrotemporal reorganization of inputs onto preBötC I-M SST+ neurons
(A1-A2) ∫XIIn (green) and I-M SST+ neuron membrane potential (Vm; red) in 3 mM [K+]ACSF (A1) and in 9 mM [K+]ACSF (A2); (A3) expanded Vm from (A2) marked by *. Dashed box in (A2) represents the Vm deflection corresponding to a missed burst in the XIIn, marked by #, which resulted in a longer interburst interval for the next burst. (B1-B3) ∫XIIn, Vm and associated frequency-time plot for I-M SST+ neuron in 3 mM [K+]ACSF (nonrhythmic; B1) and in 9 mM [K+]ACSF (rhythmic, B2); expanded traces from solid boxed region in (A1) and (A2), as indicated. (B3) expanded boxed region from (B2). White contours in frequency-time plots enclose regions where local power was significantly higher (95% confidence level) than background spectrum, i.e., global wavelet spectrum of Vm in (B1). Note in (B3) emergence of input synchrony in preI period well before the emergence of I-burst in XIIn. (C) global wavelet spectrum of Vm in 3 mM K+ (B1) and 9 mM K+ (B2). Also, see Figure S1.
Figure 3.
Figure 3.. Increased synaptic correlation between I-M SST+ neuron pairs during preI and I-bursts is concurrent with their increased input synchrony
(A) Top, Configuration for simultaneous recording of preBötC SST+ neuronal pairs with hypoglossal nerve (XIIn) and contralateral preBötC population activity; bottom, fluorescent micrograph of simultaneously patched SST+ neurons. (B1) ∫XIIn (green) and Vm of two simultaneously recorded I-M SST+ neurons (blue, red) along with the Vm crosscorrelograms (B2) during preI (black) and I-burst (red). Temporally aligned EPSP peaks indicated by dashed line and *. (C1-C3) Plots for peak correlation vs time lag for Vm of I-M SST+ pairs (90 cycles from 5 pairs) during preI, I-burst and interburst interval (IBI) epochs. (D1-D3) Histogram of crosscorrelation lags for Vm of I-M SST+ pairs for data in (C1-C3). (E-F) normalized cumulative histogram of crosscorrelation peaks (E) and lags (F) for events in (C1-C3). Kruskal Wallis test (E, p = 5×10⁻⁵; F, p = 9×10⁻⁸) followed by Wilcoxon signed rank test for pairwise comparisons (p values for color-coded pairwise comparisons). (G) Vm of simultaneously recorded I-M SST+ pair (blue, red) along with ∫preBötC (orange) showing that ∫preBötC activity peaks after the peak of Vm in each cycle. Also, see Figure S2.
Figure 4.
Figure 4.. Input synchrony during an I-burst is specific to I-M SST+ neurons
(A) Frequency-time plot of Vm of an I-M SST+ neuron (from dashed box region of Figure 2(A2)) under rhythmic conditions showing reduced synchrony during I-burst failure compared to production of I-burst (first peak), i.e., corresponding to preI activity not followed by an I-burst (second smaller peak). (B1-B2) Same as (A) but for non I-M SST+ neuron under control (3mM [K+]ACSF) (B1) and rhythmic (9mM [K+]ACSF) (B2) conditions. Vm median filtered to remove APs (indicated by *). (C1- C3) Change in Vm power of I-M and non-I-M SST+ neurons when brainstem slices were shifted from nonrhythmic to rhythmic conditions; p values for Wilcoxon rank sum test. (D) Frequency-time plot of median filtered Vm of a model neuron when 10 excitatory synapses were activated randomly with 15 Hz mean frequency. Note absence of bursting. * indicate median filtered APs. Also, see Figure S3.
Figure 5.
Figure 5.. GABAAR inhibition regulates preBötC synchronization and conductance state of preBötC I-M SST+ neurons.
(A) preBötC activity under nonrhythmic control (3 mM [K+]; A1) and after addition of 10 μM Bicuculline (BIC) rhythmic (A2) conditions. (B-C) preBötC burst frequency under control and BIC (B) and 2 μM strychnine (Strych) (C) conditions. (D) Frequency-time plot for Vm of I-M SST+ neuron under control (D1) and BIC rhythmic (D2) conditions. (E) Global wavelet spectrum of Vm in (D1-D2). Note decrease in global wavelet power under rhythmic conditions with BIC. (F) and (G) spontaneous EPSPs extracted from Vm traces in (D1) and (D2) respectively. Amplitude and 20%−80% rise times of largest (top) and smallest (bottom) EPSPs are indicated. (H-I) Vm of I-M SST+ neuron in response to a 10 pA hyperpolarizing current under control (H) and under 10 μM BIC (I); individual traces span 30 trials (different colors) and thick grey traces represent averages. (J-L) Normalized cumulative probability for spontaneous EPSP amplitude (J), 20%−80% rise time (K), and full width at half maximum duration, FWHM (L), under control (black) and BIC rhythmic (purple) conditions; N=8 neurons from 8 brain slices. (M) Input resistance, Rin, and (N) membrane time constant, τm, of I-M SST+ neurons recorded in control and BIC. For (B-C) and (M-N), p-values are for Wilcoxon signed rank test; for (J-L), p-values for Wilcoxon rank sum test. Also, see Figure S4.
Figure 6.
Figure 6.. Blocking GABA and Glycine receptors partially reversed impact of higher conductance state of I-M SST+ neurons
(A1) Frequency-time plot for Vm of I-M SST+ neuron under control and (A2) with 10 μM Bicuculline, 2 μM Strychnine and 2 μM CGP55845 (cocktail abbreviated as BSC) in ACSF to block GABAA, glycinergic and GABAB receptors, respectively; * indicates filtered APs (B) preBötC burst frequency recorded under control and under BSC, respectively. (C) comparison of preBötC frequency under control, BIC and BSC conditions. (D) global wavelet spectrum of Vm in (A1-A2), note decrease in global wavelet power under rhythmic conditions with BSC. (E) and (F) spontaneous EPSPs extracted from Vm traces in (A1) and A2) respectively. (G-H) Vmof I-M SST+ neuron in response to a 10 pA hyperpolarizing current under control (G) and under BSC condition (H); individual traces (different colors) span 16–20 trials and thick grey traces represent averages. (I-K) Normalized cumulative probability for spontaneous EPSP amplitude (I), 20%−80% rise time (J), and full width at half maximum duration, FWHM (K), under control (black) and rhythmic with BSC (cyan) conditions and after washout of BSC with control ACSF (pink); p values for comparison of color-coded experimental sets vs. control; N=5 neurons from 5 brain slices. (L) Rin of I-M SST+ neurons recorded in control and BSC conditions. (M) % change in Rin of I-M SST+ neurons recorded under BIC and BSC conditions. (N) τm of I-M SST+ neurons recorded in control and BSC conditions. (O) % change in τm of I-M SST+ neurons recorded under BIC and BSC conditions. For (B), (L) and (N), p-values are for Wilcoxon signed rank test; for (C), (I-K), (M) and (O), p-values for Wilcoxon rank sum test.
Figure 7.
Figure 7.. Propagation of preBötC bursts to XIIn is dependent upon strength of input synchrony onto I-M SST+ neurons.
(A-B) preBötC activity, XIIn activity and Vm of an I-M SST+ neuron under control (3 mM [K+]ACSF) (A) and rhythmic (9 mM [K+]ACSF) (B) conditions. Note more bouts of input synchrony in Vm than preBötC and/or XIIn I-bursts in B, i.e., burstlets. (C) Frequency-time plot concurrent with recordings of first 7 seconds from (B). (D-E) Representative Vm (raw (red) and median filtered (black)) from another neuron during an XIIn I-burst (D) and when preBötC input synchrony was not accompanied by an I-burst (E). (F-G) Summary plots for measurements in (D-E); n = number of events. (H) plot of FWHM−1 vs amplitude of Vm deflections from I-M SST+ neurons (n=4) during bouts of input synchrony. The data is color coded for synchronous inputs that resulted in XIIn I-bursts (black) and those that did not (red). An arbitrary blue line with slope of ~1 ms x mV separates the data into the two groups. (I) Schematic representation of inputs onto I-M SST+ neurons (as inferred from data); these neurons receive synchronized inputs from SST glutamatergic neurons, some of which are presumptively rhythmogenic and connected through excitatory synapses among themselves (Rekling et al., 2000). I-M SST+ neurons also receive glycinergic inputs. Glycinergic neurons are in turn regulated by GABAA inhibition.
Figure 8.
Figure 8.. Synchronous propagation of preBötC activity to motor nuclei
Diagrammatic representation of synchronized preBötC output that propagates through premotor and motor inspiratory networks. Synchrony arises from correlated activity of preBötC rhythmogenic neurons, which are SST, and propagates via preBötC output neurons, a subset of which are SST+, to inspiratory premotoneurons, in, e.g., parahypoglossal nucleus (paraXII) and rostral ventral respiratory group (rVRG) to inspiratory motoneurons, e.g., XII and phrenic motor nucleus. MFOs = Medium Frequency (15–50 Hz) Oscillations; HFO = High Frequency (50–120 Hz) Oscillations. The schematic is based on data presented here as well as in (Christakos et al., 1991; Ellenberger et al., 1990; Feldman et al., 1980; Funk and Parkis, 2002; Huang et al., 1996; Liu et al., 1990; Mitchell and Herbert, 1974; Parkis et al., 2003; Schmid et al., 1990; Tan et al., 2010; Wang et al., 2002; Yang and Feldman, 2018).

Similar articles

Cited by

References

    1. Ashhad S, Johnston D, and Narayanan R. (2015). Activation of InsP3 receptors is sufficient for inducing graded intrinsic plasticity in rat hippocampal pyramidal neurons. J Neurophysiol 113, 2002–2013. - PMC - PubMed
    1. Ashhad S, and Narayanan R. (2019). Stores, Channels, Glue, and Trees: Active Glial and Active Dendritic Physiology. Mol Neurobiol 56, 2278–2299. - PMC - PubMed
    1. Baertsch NA, Baertsch HC, and Ramirez JM (2018). The interdependence of excitation and inhibition for the control of dynamic breathing rhythms. Nat Commun 9, 843. - PMC - PubMed
    1. Baertsch NA, Severs LJ, Anderson TM, and Ramirez JM (2019). A spatially dynamic network underlies the generation of inspiratory behaviors. Proc Natl Acad Sci U S A 116, 7493–7502. - PMC - PubMed
    1. Barlow HB (1961). Possible principles underlying the transformation of sensory messages. In Sensory communication, Rosenblith WA, ed. (Cambridge, MA: The MIT Press; ), pp. 217–234.

Publication types

Substances