. 2020 Mar 3;31(3):623-641.e8.
doi: 10.1016/j.cmet.2020.02.002.

Restoring Cellular Energetics Promotes Axonal Regeneration and Functional Recovery after Spinal Cord Injury

Affiliations

Restoring Cellular Energetics Promotes Axonal Regeneration and Functional Recovery after Spinal Cord Injury

Qi Han et al. Cell Metab. .

Abstract

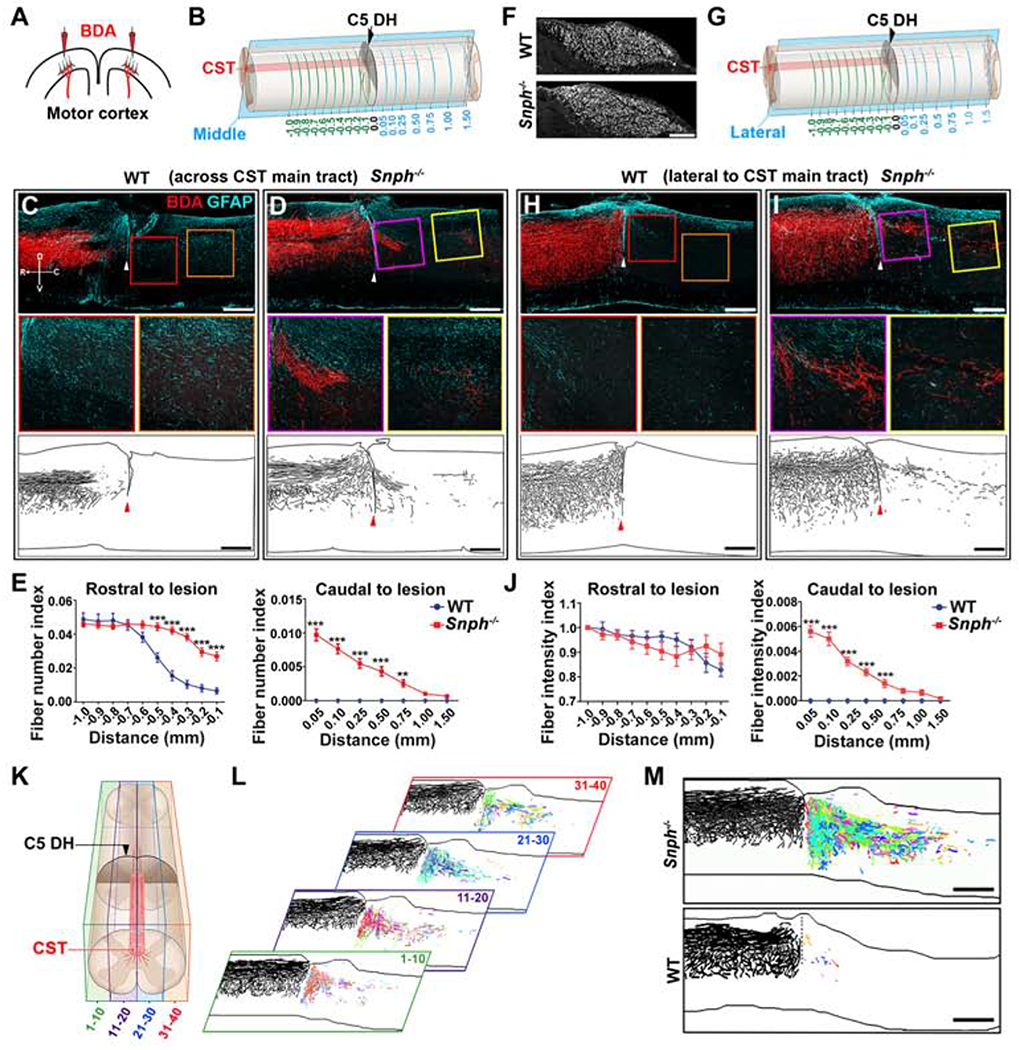
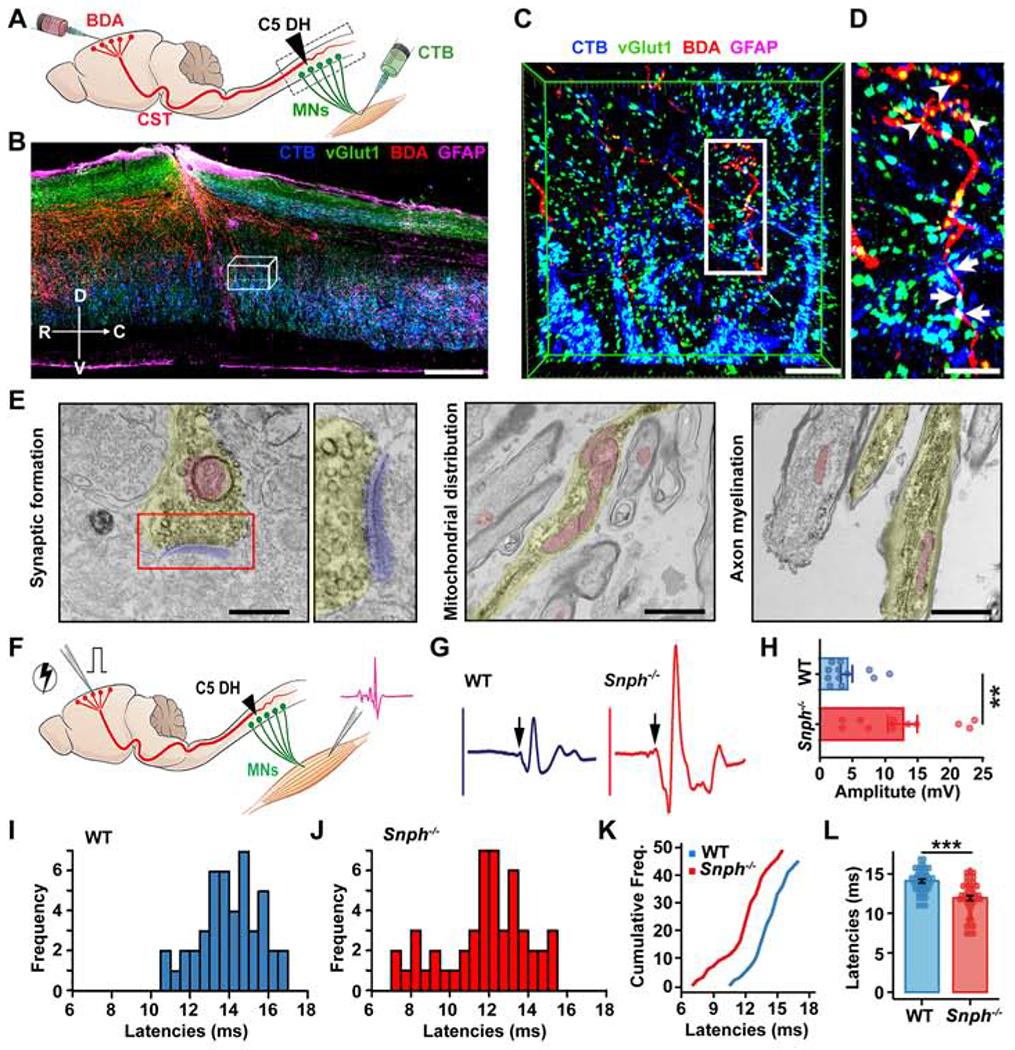
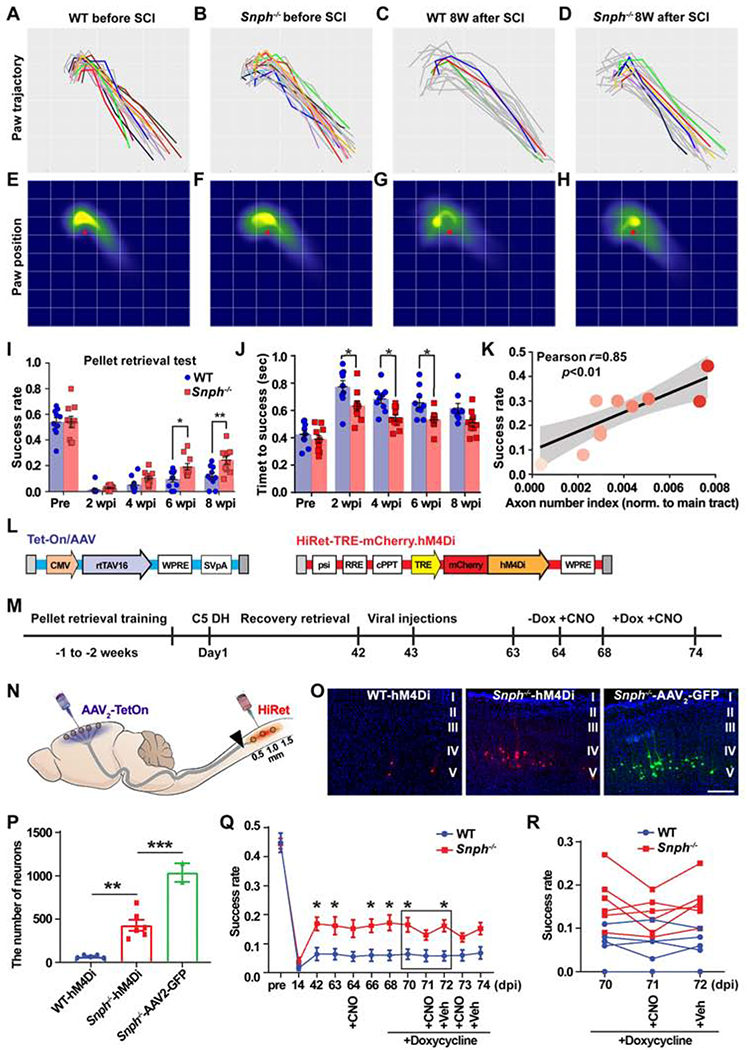
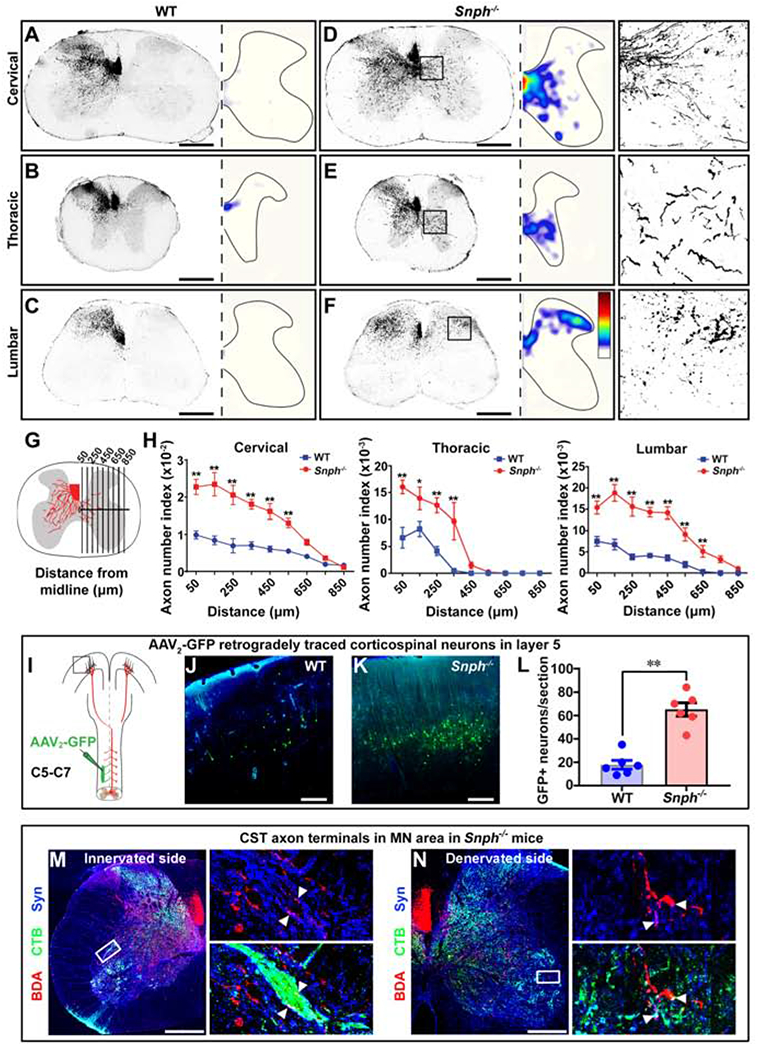
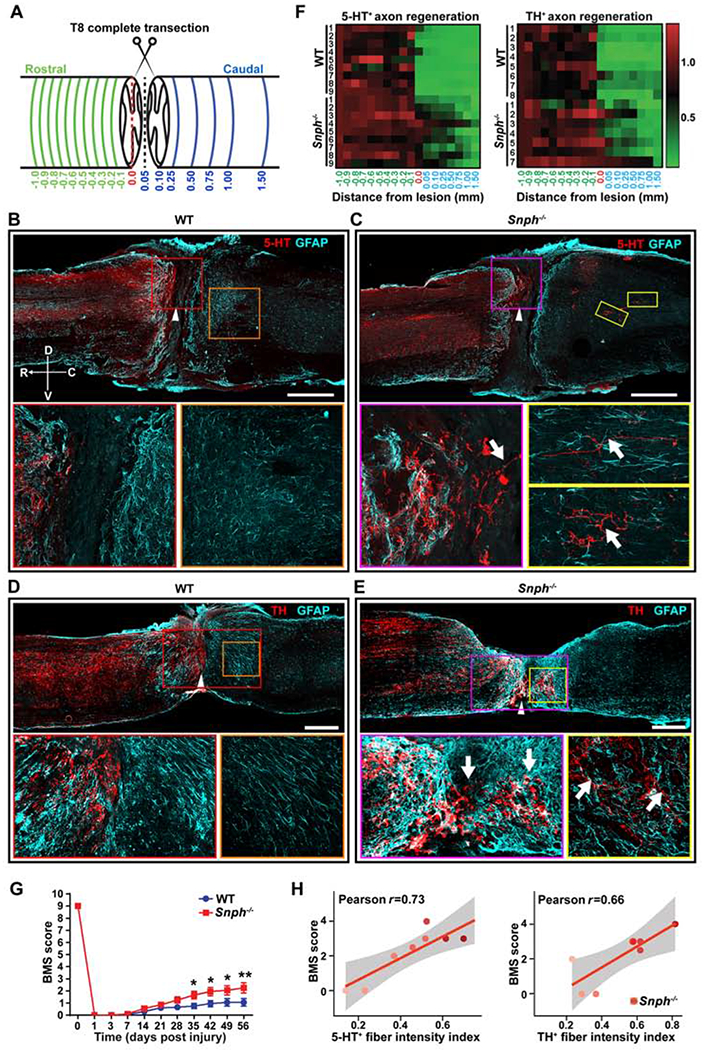
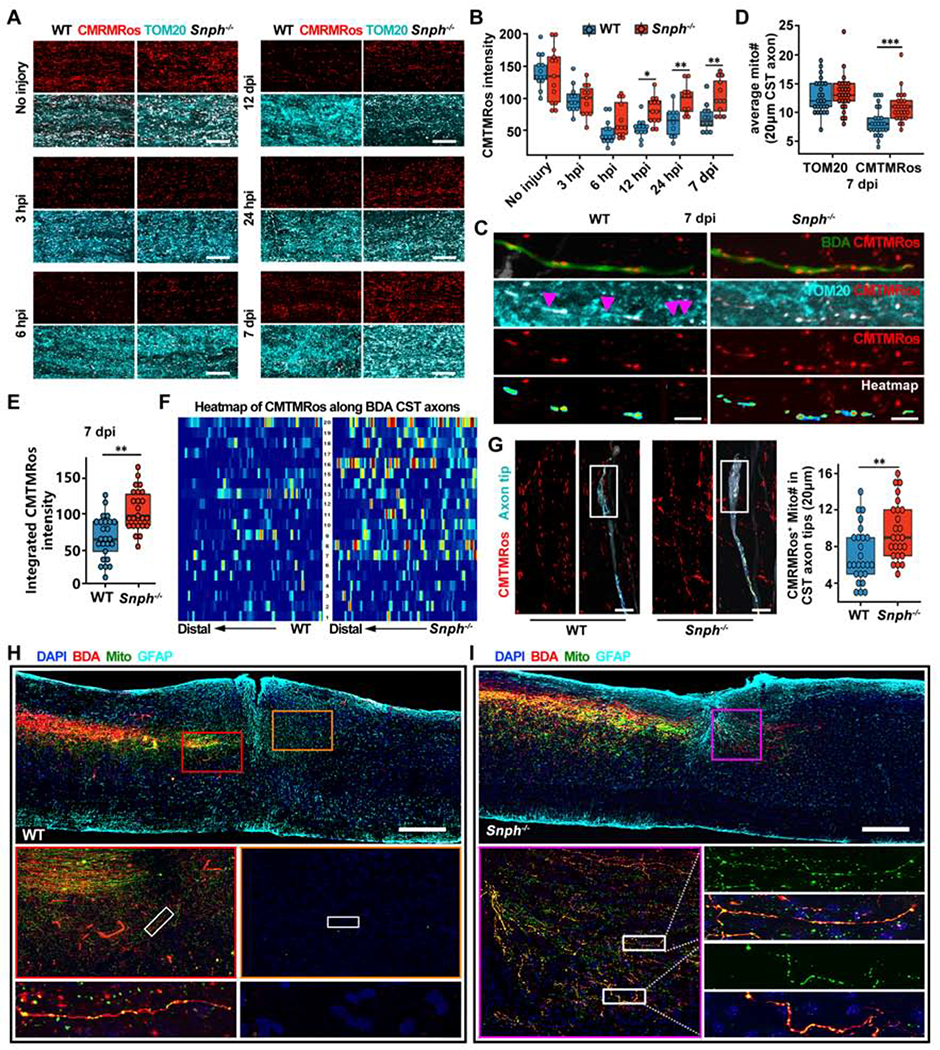
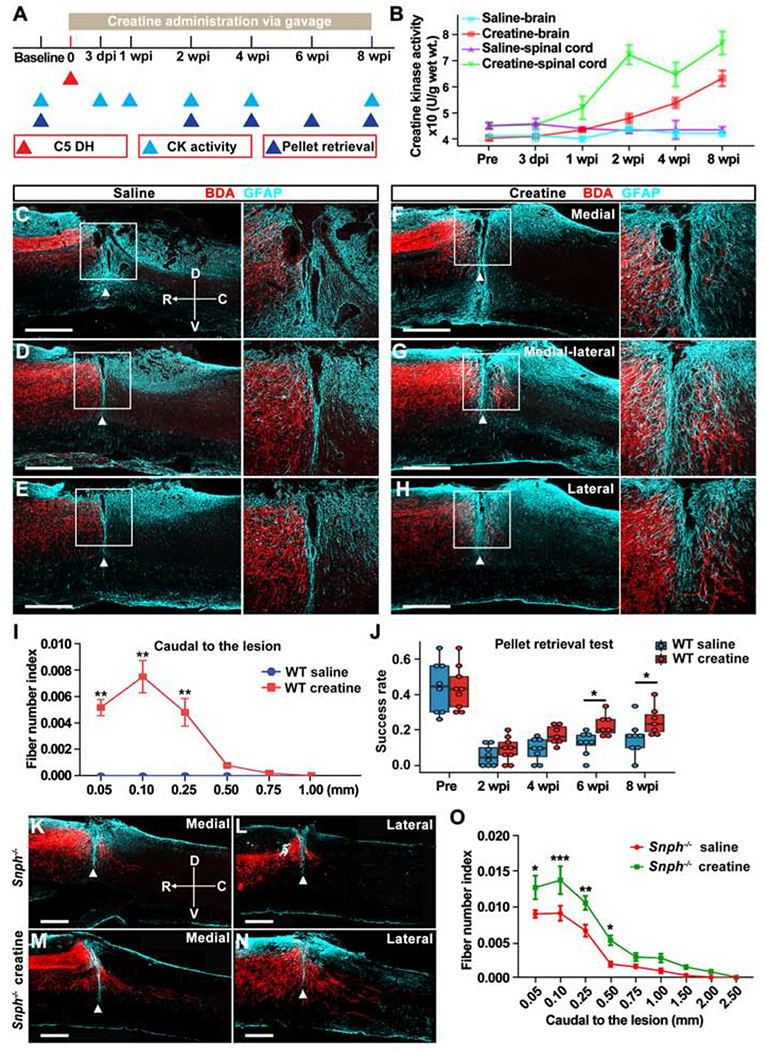
Axonal regeneration in the central nervous system (CNS) is a highly energy-demanding process. Extrinsic insults and intrinsic restrictions lead to an energy crisis in injured axons, raising the question of whether recovering energy deficits facilitates regeneration. Here, we reveal that enhancing axonal mitochondrial transport by deleting syntaphilin (Snph) recovers injury-induced mitochondrial depolarization. Using three CNS injury mouse models, we demonstrate that Snph-/- mice display enhanced corticospinal tract (CST) regeneration passing through a spinal cord lesion, accelerated regrowth of monoaminergic axons across a transection gap, and increased compensatory sprouting of uninjured CST. Notably, regenerated CST axons form functional synapses and promote motor functional recovery. Administration of the bioenergetic compound creatine boosts CST regenerative capacity in Snph-/- mice. Our study provides mechanistic insights into intrinsic regeneration failure in CNS and suggests that enhancing mitochondrial transport and cellular energetics are promising strategies to promote regeneration and functional restoration after CNS injuries.

Keywords: CNS injury; axon regeneration; axonal transport; creatine; energy deficits; energy metabolism; mitochondria; spinal cord injury; syntaphilin.


Conflict of interest statement

Declaration of Interests The authors declare no competing financial interests.

Figures

Figure 1.
Figure 1.. Snph−/− Mice Display Enhanced CST Axonal Regeneration after the C5 DH
(A) Schematic diagram of BDA injections into bilateral sensorimotor cortices to anterogradely label the CST axons. (B) Schematic diagram of a C5 DH SCI model. CST axonal density was measured at various distances rostral (green lines, up to −1 mm) and caudal (blue lines, up to 1.5 mm) to the C5 DH (0 mm). The parasagittal rectangle indicates a cut through the BDA-labelled CST main tract. (C, D) BDA labeling of the CST main tract in the dorsal column after the C5 DH in WT and Snph−/− mice, 8 wpi. Arrowheads indicate the lesion sites. Middle panels: high magnifications of boxed areas. Bottom panels: Imaris reconstruction images from WT and Snph−/− mice. Compass in C shows the dorsal (D), ventral (V), rostral (R), and caudal (C) orientation. (E) Quantification of CST axon (fiber) number index at various distances rostral (left) and caudal (right) to the C5 DH. (F) BDA-labeled CST axons through transverse sections of the medullary pyramids. (G) Schematic showing BDA-labeled axons lateral to CST main tract. (H, I) Lateral CST distribution after the C5 DH (arrowheads). Middle panels: high magnifications of boxed areas showing BDA-labeled regenerated axons caudal to the injury 8 wpi. Bottom panels: Imaris reconstruction images from WT and Snph−/− mice. (J) Quantitative analysis of BDA-labeled CST fiber intensity index at various distances rostral (left) and caudal (right) to the lesion. (K, L) Schematic showing a spinal cord segment divided into four longitudinal blocks, each containing 10 sections (K). BDA-labeled CST axons in each section were traced and color-coded using Imaris (L). Each of the four color-coded blocks on the right was generated by overlaying 10 consecutive sections. Each color represents a trace of BDA-labeled axons caudal to the lesion in a single section of one block. (M) Reconstruction of a stack of all color-coded images shows robust CST regeneration across and beyond the lesion in a Snph−/− mouse at 8 wpi. Data were presented as mean ± sem. n = 10-11 mice/group. Two-way ANOVA with Bonferroni post hoc test. **P < 0.01, ***P < 0.001. Scale bars: 100 μm (F), 400 μm (C, D, H, I), and 500 μm (M). (Also see Figure S1)
Figure 2.
Figure 2.. Regenerated CST Axons Form Functional Cortico-Motoneuron Connections
(A) Illustration showing bilateral injections of BDA into the motor cortex to label CST axons and CTB into the bicep’s muscles to label cervical motoneurons (MNs) after the C5 DH. (B-D) BDA-labeled regenerated CST axons (red) formed synapse-like connections (vGlut1, green) with CTB retrogradely labeled MNs (blue) caudal to the C5 DH (GFAP-IR, magenta) in Snph−/− mice. (C) 3D magnification of boxed area in B. (D) High magnification of boxed area in C. Arrowheads (in C) indicate vGlut1 distribution along BDA-labeled CST axons. Arrows indicate vGlut1 co-labeled with both BDA-labeled CST axons and CTB-labeled MNs. Compass: D, dorsal; V, ventral; R, rostral; C, caudal. (E) Electron micrographs showing synaptic formation of regenerated CST axons in caudal spinal cords. Left: BDA-labeled CST axon (yellow colored) caudal to the lesion site that formed a presynaptic terminal containing synaptic vesicle clusters in the active zone and contacts on a postsynaptic density (blue colored). Middle: mitochondria were enriched and clustered within BDA-labeled newly growing axon tip in sections caudal to the injury. Right: BDA-labeled myelinated CST axons below the lesion. (F-L) Schematic diagram (F) and electromyography (EMG) analysis (F-L) showing signals recorded from forelimb biceps in response to motor cortex single-pulse stimulation. Sample EMG traces (G) from WT (blue) and Snph−/− (red) mice were recorded in response to single-pulse stimulations after the C5 DH. Arrows indicate evoked-potential onset. (H) Average peak-to-peak EMG amplitude in WT (n = 12) and Snph−/− (n = 11) mice, P < 0.01. (I, J) Frequency distributions of EMG latencies from WT and Snph−/− mice, respectively. (K) Cumulative frequency distribution plot for WT (blue) and Snph−/− mice (red). (L) EMG latencies in WT (14.08 ± 0.23, n = 45 stimulation sites from 11 animals) and Snph−/− mice (11.95 ± 0.31, n = 49 stimulation sites from 10 animals). Data were presented as mean ± sem. Unpaired two-tailed Student’s t-test. **P < 0.01, ***P < 0.001). Scale bars: 400 μm (B), 50 μm (C), 25 μm (D), 400 nm (E, left), 1200 nm, (E, middle and right). (Also see Figure S1).
Figure 3.
Figure 3.. Regenerated CST Axons Contribute to Recovery in Manual Dexterity
(A-D) Paw motion trajectories in the reaching phase of pellet retrieval test in WT and Snph−/− mice before and 8 weeks after the C5 DH (8 wpi). Successful reaches are colored and unsuccessful attempts are grey. (E-H) Heat maps of paw spatial positions in the grasping phase relative to the food pellet (red spot) in WT and Snph−/− mice before and at 8 wpi. (I-K) Analysis of the success rate of skilled reaching (I) and time to successful retrieval (J) shows that Snph−/− mice outperformed WT mice in the dexterity task. (K) Correlation between success rate and BDA-labeled CST axon number index. (L-N) Schematics showing dual viral vectors (L) and experimental design (M) of DREADDs-mediated silencing of CST neurons (N). (O) Labeling of corticospinal neurons in the motor cortex that received dual viral or AAV2-GFP infection. (P) Total number of dual-virus infected corticospinal neurons in WT and Snph−/− mice, as well as corticospinal neurons infected by AAV2-GFP virus in Snph−/− mice. (Q, R) Changes of forelimb dexterity in pellet retrieval test via administration of CNO either before or after induction of hM4Di expression with doxycycline treatment. Data were presented as mean ± sem. n = 10 mice/group in pellet retrieval test (A-K); n = 5-6 mice/group in DREADDs study (N-R). Two-way ANOVA with Bonferroni post hoc test. * P < 0.05, ** P < 0.01, *** P < 0.001. Scale bar: 200 μm (O). (Also see Figure S2).
Figure 4.
Figure 4.. Snph−/− Mice Display Enhanced Compensatory CST Spouting after Unilateral Pyramidotomy
(A-F) Cross-sectional images showing midline-crossing of BDA-labeled CST axons at cervical, thoracic, and lumbar levels following unilateral (left) pyramidotomy. The distribution of axonal sprouting into the denervated side was converted to heatmaps; red represents the highest numbers of axon pixels, blue represents the lowest, and white represents background (D-F). Right panels in D-F: details of boxed areas showing BDA-labeled CST terminal sprouting at denervated regions of the cervical, thoracic, and lumbar cords, respectively, in a Snph−/− mouse. (G, H) Schematic (G) and analysis (H) showing BDA-labeled midline-crossing CST axons. (I) Unilateral injection of AAV2-GFP into the denervated (right) side of the C5-C7 spinal intermediate gray matter to retrogradely label corresponding corticospinal neurons in the motor cortex. (J-L) Images of boxed area in I (J, K) and analysis (L) showing GFP-labeled CST neurons in layer V of WT and Snph−/− mice. (M, N) Close apposition of BDA-labeled CST (red), synaptophysin (Syn)-labeled presynaptic terminals (blue), and CTB-labeled MNs (green) in both innervated (M) and denervated (N) spinal cord in Snph−/− mice. Left panels: high magnifications of boxed areas in M and N, respectively. Arrowheads indicate triple-positive appositions. Data were presented as mean ± sem. n = 6 mice/group (H, L). Unpaired two-tailed Student’s t-test. * P < 0.05, ** P < 0.01. Scale bars: 500 μm (A-F), 250 μm (J, K), 400 μm (M, N). (Also see Figure S3)
Figure 5.
Figure 5.. Monoaminergic Axon Regeneration after T8 Complete Transection in Snph−/− Mice
(A) Diagram illustrates a complete thoracic (T8) transection model. Green lines indicate various cross-sections spaced 0.1 mm apart up to 1 mm rostral to the lesion border; blue lines indicate cross-sections at various distances caudal to the lesion border up to 1.5 mm caudal to the rostral lesion border. The red-dashed line indicates the edge of the rostral lesion border, which is set to 0 mm for both rostral and caudal directions. (B, C) Images of 5-HT-immunoreactive (IR) serotonergic axons (red) costained for GFAP (cyan) in sagittal sections following a complete T8 transection in WT (B) and Snph−/− mice (C). Arrowheads indicate the lesion center, which was magnified in lower left panels. Lower right panels: high magnifications of boxed areas in B or C respectively. Compass: D, dorsal; V, ventral; R, rostral; C, caudal. (D, E) TH-IR dopaminergic axons (red) costained for GFAP (cyan) in sagittal sections following T8 transection in WT (D) and Snph−/− mice (E). Arrowheads indicate the lesion centers, which were magnified in lower left panels, respectively. Lower right panels: high magnifications of boxed areas of the caudal spinal cord in D or E, respectively. (F) Color-coded density heatmap indicates the mean intensity of 5-HT-IR and TH-IR fibers after T8 transection. The horizontal axis indicates the distance rostral and caudal to the rostral lesion border (0.0). The vertical axis indicates individual mice in WT or Snph−/− group, respectively. n = 7-9 mice/group. (G, H) BMS scores in Snph−/− mice were significantly higher than WT mice from 35 to 56 days post-injury (*P < 0.05; ** P < 0.01) (G) and correlated to 5-HT and TH fiber intensity (r = 0.73, r = 0.06, respectively) (H). Scale bars: 500 μm (B-E). (Also see Figure S4).
Figure 6.
Figure 6.. Snph−/− Mice Recover Local CST Axonal Mitochondrial Integrity after SCI
(A, B) Images (A) and analysis (B) of CMTMRos-labeled polarized mitochondria over TOM20-immunostained total mitochondria in the spinal cord dorsal white matter at different times following C5 DH. Data were presented as mean ± sem; n = 3-4 mice/group at each time. (C) Distribution of polarized mitochondria along individual BDA-labeled CST axons in the rostral lesion site vicinity at 7 days after the C5 DH (7 dpi). Arrowheads represent TOM20-positive but CMTMRos-negative depolarized mitochondria along WT axons, indicating injury-induced damage of mitochondrial integrity. CMTMRos-labeled mitochondria along CST axons were isolated and converted to color-coded heatmaps, in which red and blue indicate the highest and lowest CMTMRos fluorescent intensity, respectively. (D) Average number of TOM20-labeled or CMTMRos-labeled mitochondria along 20 μm BDA-labeled CST axons rostral to the lesion in WT (blue) and Snph−/− mice (red) at 7 dpi. Data were presented as mean ± sem; n = 25 axons from 4 mice/group. (E) Analysis of integrated CMTMRos fluorescence intensity within TOM20 masked area along individual BDA-labeled CST axons in WT (blue) and Snph−/− mice (red) at 7 dpi. Data were presented as mean ± sem. n = 25 axons from 4 mice/group. (F) Pseudo-colored heatmaps represent CMTMRos-labeled mitochondria along BDA-labeled CST axons rostral to the injury in WT and Snph−/− mice at 7 dpi. In heatmaps, red and blue indicate the highest and lowest CMTMRos fluorescent intensity, respectively. n = 20 axons from 4 mice/group. (G) CMTMRos-labeled mitochondria were distributed within growing tips of BDA-labeled CST axons 7 days after the C5 DH in WT and Snph−/− mice. Boxplot shows the average number of CMTMRos-labeled mitochondria in the distal 20 mm of CST axon tips. n = 25 axons from 4 mice/group. (H, I) Relative distribution of motor cortex-derived mitochondria, labeled by AAV9-mito-GFP, in BDA-labeled CST axons at 8 weeks following the C5 DH in WT (H) and Snph−/− mice (I). Middle panels (H): magnification of boxed area in the top panel; Bottom panels (H): high magnification of boxed area in middle panels; lower left panel (I): magnification of boxed area in the upper panel, lower right panels (I): high magnification of boxed area in left panels. Differences were analyzed by two-way ANOVA with Bonferroni post hoc correction (B, D) or unpaired two-tailed Student’s t-test (E, G). *P < 0.05; ** P < 0.01. ***P < 0.001. Scale bars: 20 μm (A), 5 μm (C), 10 μm (G), 500 μm (H, I). (Also see Figure S5).
Figure 7.
Figure 7.. Systemic Administration of Creatine Promotes CST Axonal regeneration after the C5 DH
(A) Schematic of experimental design for creatine administration and analysis. (B) Creatine kinase (CK) activity in the brain and spinal cord before and after the C5 DH. (C-H) BDA-labeled CST axons in sagittal sections at medial (100 μm, C, F), medial-lateral (400 μm, D, G), and lateral (700 μm, E, H) distances from the midline in saline-treated (C-E) and creatine-treated (F-H) WT mice at 8 wpi. Arrowheads indicate lesion sites (GFAP, cyan). Right panels: magnification of boxed area. Compass: D, dorsal; V, ventral; R, rostral; C, caudal. (I) Analysis of BDA-labeled CST axon number index caudal to the lesion. (J) Analysis of the success rate in a single pellet retrieval test between saline-treated and creatine-treated WT mice over 8 wpi. (K-N) BDA-labeled CST axons in sagittal sections at medial (K, M) and lateral (L, N) distances from the midline in saline-treated (K and L) and creatine-treated (M and N) Snph−/− mice at 8 wpi. (O) Analysis of BDA-labeled CST axonal number index caudal to the lesion. Data were presented as mean ± sem. n = 3-4 mice/group at each timepoin (B), n = 8 mice/group (I), n = 7-9 mice/group (J), and n = 7 mice/group (O). Two-way ANOVA with Bonferroni post hoc test. * P < 0.05; ** P < 0.01; *** P < 0.001. Scale bars: 500 mm (C-H, K-N). (Also see Figure S6).

References

    1. Ahuja CS, Wilson JR, Nori S, Kotter MRN, Druschel C, Curt A, and Fehlings MG (2017). Traumatic spinal cord injury. Nature Reviews Disease Primers 3, 17018. - PubMed
    1. Al-Ali H, Ding Y, Slepak T, Wu W, Sun Y, Martinez Y, Xu XM, Lemmon VP, and Bixby JL (2017). The mTOR Substrate S6 Kinase 1 (S6K1) Is a Negative Regulator of Axon Regeneration and a Potential Drug Target for Central Nervous System Injury. J Neurosci 37, 7079–7095. - PMC - PubMed
    1. Anderson MA, Burda JE, Ren Y, Ao Y, O’Shea TM, Kawaguchi R, Coppola G, Khakh BS, Deming TJ, and Sofroniew MV (2016). Astrocyte scar formation aids central nervous system axon regeneration. Nature 532, 195–200. - PMC - PubMed
    1. Anderson MA, O’Shea TM, Burda JE, Ao Y, Barlatey SL, Bernstein AM, Kim JH, James ND, Rogers A, Kato B, et al. (2018). Required growth facilitators propel axon regeneration across complete spinal cord injury. Nature. - PMC - PubMed
    1. Asante CO, and Martin JH (2013). Differential Joint-Specific Corticospinal Tract Projections within the Cervical Enlargement. Plos One 8. - PMC - PubMed

Publication types

MeSH terms