

Ultrasensitive Genetically Encoded Indicator for Hydrogen Peroxide Identifies Roles for the Oxidant in Cell Migration and Mitochondrial Function
- PMID: 32130885
- PMCID: PMC7088435
- DOI: 10.1016/j.cmet.2020.02.003
Ultrasensitive Genetically Encoded Indicator for Hydrogen Peroxide Identifies Roles for the Oxidant in Cell Migration and Mitochondrial Function
Abstract
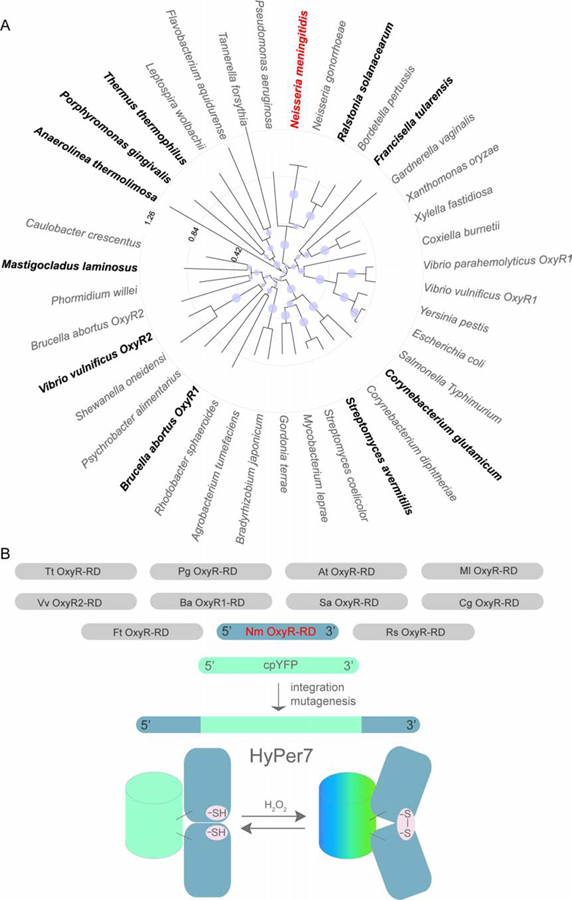
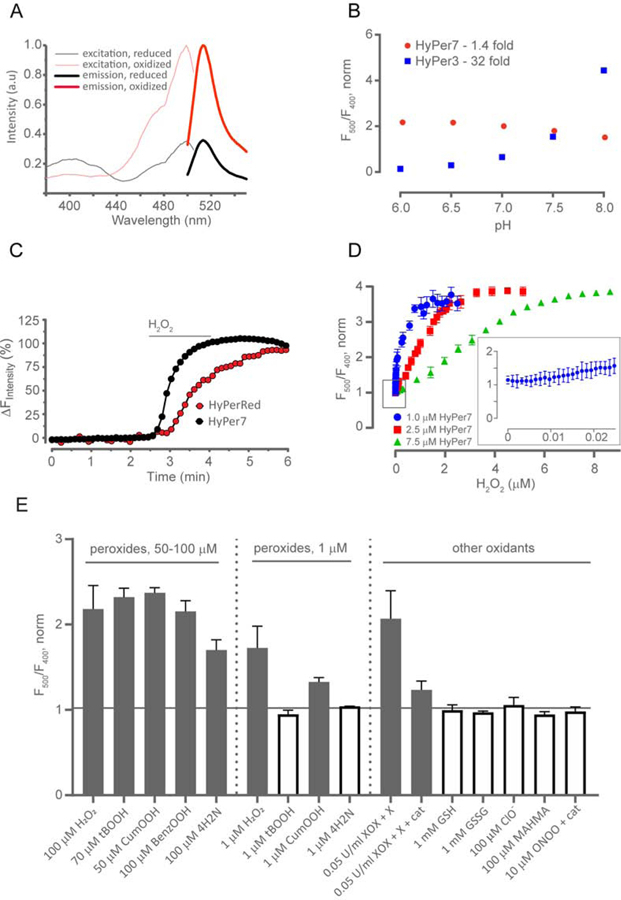
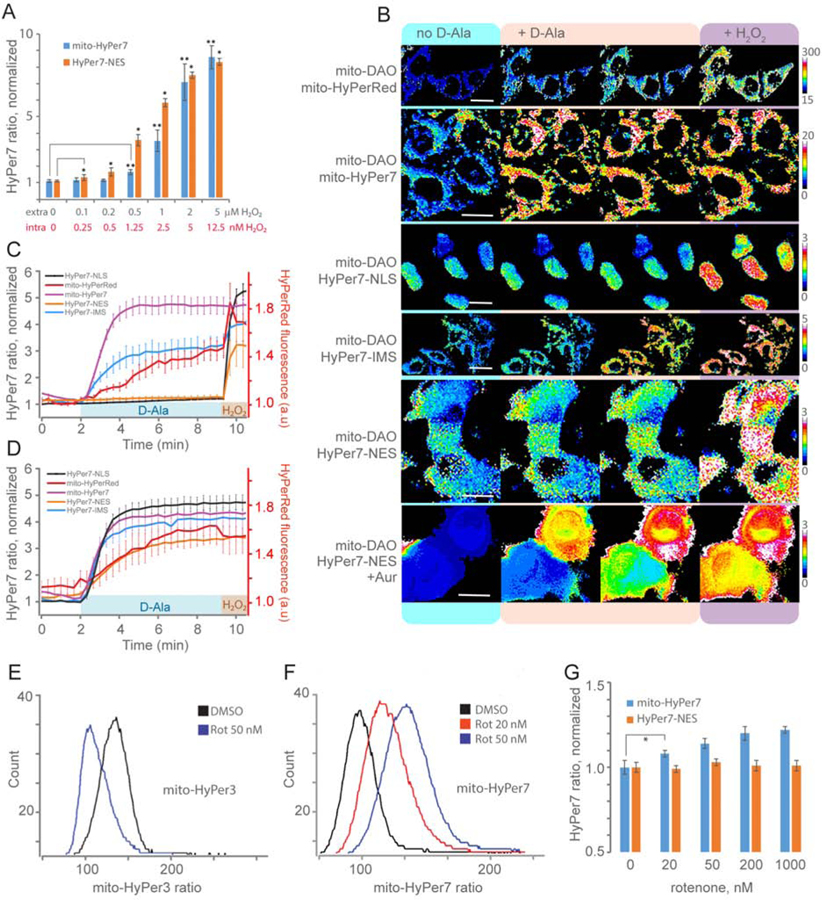
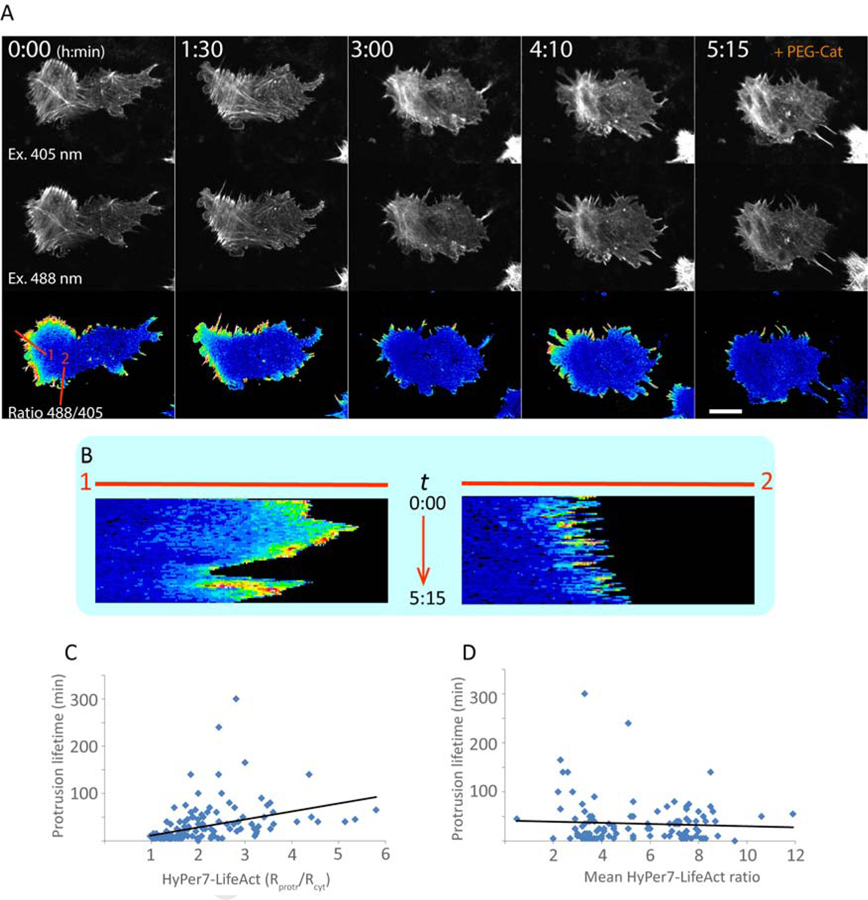
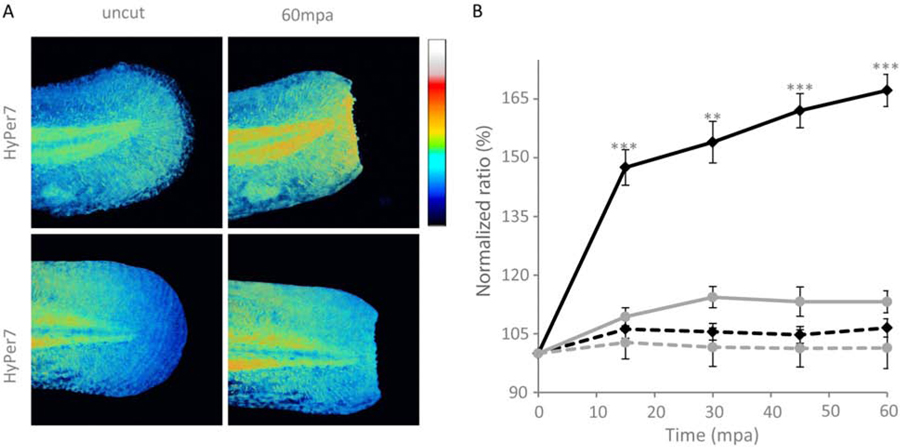
Hydrogen peroxide (H2O2) is a key redox intermediate generated within cells. Existing probes for H2O2 have not solved the problem of detection of the ultra-low concentrations of the oxidant: these reporters are not sensitive enough, or pH-dependent, or insufficiently bright, or not functional in mammalian cells, or have poor dynamic range. Here we present HyPer7, the first bright, pH-stable, ultrafast, and ultrasensitive ratiometric H2O2 probe. HyPer7 is fully functional in mammalian cells and in other higher eukaryotes. The probe consists of a circularly permuted GFP integrated into the ultrasensitive OxyR domain from Neisseria meningitidis. Using HyPer7, we were able to uncover the details of H2O2 diffusion from the mitochondrial matrix, to find a functional output of H2O2 gradients in polarized cells, and to prove the existence of H2O2 gradients in wounded tissue in vivo. Overall, HyPer7 is a probe of choice for real-time H2O2 imaging in various biological contexts.
Keywords: D-amino acid oxidase; H(2)O(2); H(2)O(2) gradients; HyPer7; cell migration; chemogenetics; genetically encoded probes; hydrogen peroxide; mitochondria; redox signaling.
Copyright © 2020 Elsevier Inc. All rights reserved.
Conflict of interest statement
Declaration of Interests The authors declare no competing financial interests.
Figures
Similar articles
-
Slowly Reducible Genetically Encoded Green Fluorescent Indicator for In Vivo and Ex Vivo Visualization of Hydrogen Peroxide.Int J Mol Sci. 2019 Jun 27;20(13):3138. doi: 10.3390/ijms20133138. Int J Mol Sci. 2019. PMID: 31252566 Free PMC article.
-
Complexities of the chemogenetic toolkit: Differential mDAAO activation by d-amino substrates and subcellular targeting.Free Radic Biol Med. 2021 Dec;177:132-142. doi: 10.1016/j.freeradbiomed.2021.10.023. Epub 2021 Oct 20. Free Radic Biol Med. 2021. PMID: 34687864 Free PMC article.
-
Imaging of mtHyPer7, a Ratiometric Biosensor for Mitochondrial Peroxide, in Living Yeast Cells.J Vis Exp. 2023 Jun 2;(196):10.3791/65428. doi: 10.3791/65428. J Vis Exp. 2023. PMID: 37335116 Free PMC article.
-
An update on methods and approaches for interrogating mitochondrial reactive oxygen species production.Redox Biol. 2021 Sep;45:102044. doi: 10.1016/j.redox.2021.102044. Epub 2021 Jun 16. Redox Biol. 2021. PMID: 34157640 Free PMC article. Review.
-
Teaching the fundamentals of electron transfer reactions in mitochondria and the production and detection of reactive oxygen species.Redox Biol. 2015;4:381-98. doi: 10.1016/j.redox.2015.02.001. Epub 2015 Feb 7. Redox Biol. 2015. PMID: 25744690 Free PMC article. Review.
Cited by
-
Scabertopin Derived from Elephantopus scaber L. Mediates Necroptosis by Inducing Reactive Oxygen Species Production in Bladder Cancer In Vitro.Cancers (Basel). 2022 Dec 2;14(23):5976. doi: 10.3390/cancers14235976. Cancers (Basel). 2022. PMID: 36497458 Free PMC article.
-
Multiparameter in vivo imaging in plants using genetically encoded fluorescent indicator multiplexing.Plant Physiol. 2021 Oct 5;187(2):537-549. doi: 10.1093/plphys/kiab399. Plant Physiol. 2021. PMID: 35237819 Free PMC article. Review.
-
Inhibiting Succinate Release Worsens Cardiac Reperfusion Injury by Enhancing Mitochondrial Reactive Oxygen Species Generation.J Am Heart Assoc. 2022 Jul 5;11(13):e026135. doi: 10.1161/JAHA.122.026135. Epub 2022 Jun 29. J Am Heart Assoc. 2022. PMID: 35766275 Free PMC article.
-
Reactive oxygen species (ROS) as pleiotropic physiological signalling agents.Nat Rev Mol Cell Biol. 2020 Jul;21(7):363-383. doi: 10.1038/s41580-020-0230-3. Epub 2020 Mar 30. Nat Rev Mol Cell Biol. 2020. PMID: 32231263 Review.
-
Hydrogen peroxide sensor HyPer7 illuminates tissue-specific plastid redox dynamics.Plant Physiol. 2023 Aug 31;193(1):217-228. doi: 10.1093/plphys/kiad307. Plant Physiol. 2023. PMID: 37226328 Free PMC article.
References
-
- Arteel GE, and Sies H (2001). The biochemistry of selenium and the glutathione system. Environ. Toxicol. Pharmacol 10, 153–158. - PubMed
-
- Bae YS, Kang SW, Seo MS, Baines IC, Tckle E, Chock PB, and Rhee SG (1997). Epidermal growth factor (EGF)-induced generation of hydrogen peroxide. Role in EGF receptor-mediated tyrosine phosphorylation. J. Biol. Chem 272, 217–221. - PubMed
-
- Bedard K, and Krause KH (2007). The NOX family of ROS-generating NADPH oxidases: physiology and pathophysiology. Physiol Rev 87, 245–313. - PubMed
-
- Belousov VV, Fradkov AF, Lukyanov KA, Staroverov DB, Shakhbazov KS, Terskikh AV, and Lukyanov S (2006). Genetically encoded fluorescent indicator for intracellular hydrogen peroxide. Nat Methods 3, 281–286. - PubMed
Publication types
MeSH terms
Substances
Grants and funding
LinkOut - more resources
Full Text Sources
Other Literature Sources
Research Materials
