. 2020 Mar 3;30(9):2889-2899.e6.
doi: 10.1016/j.celrep.2020.02.042.

Mitochondrial Pyruvate Carrier 1 Promotes Peripheral T Cell Homeostasis through Metabolic Regulation of Thymic Development

Affiliations

Mitochondrial Pyruvate Carrier 1 Promotes Peripheral T Cell Homeostasis through Metabolic Regulation of Thymic Development

Andrew G Ramstead et al. Cell Rep. .

Abstract

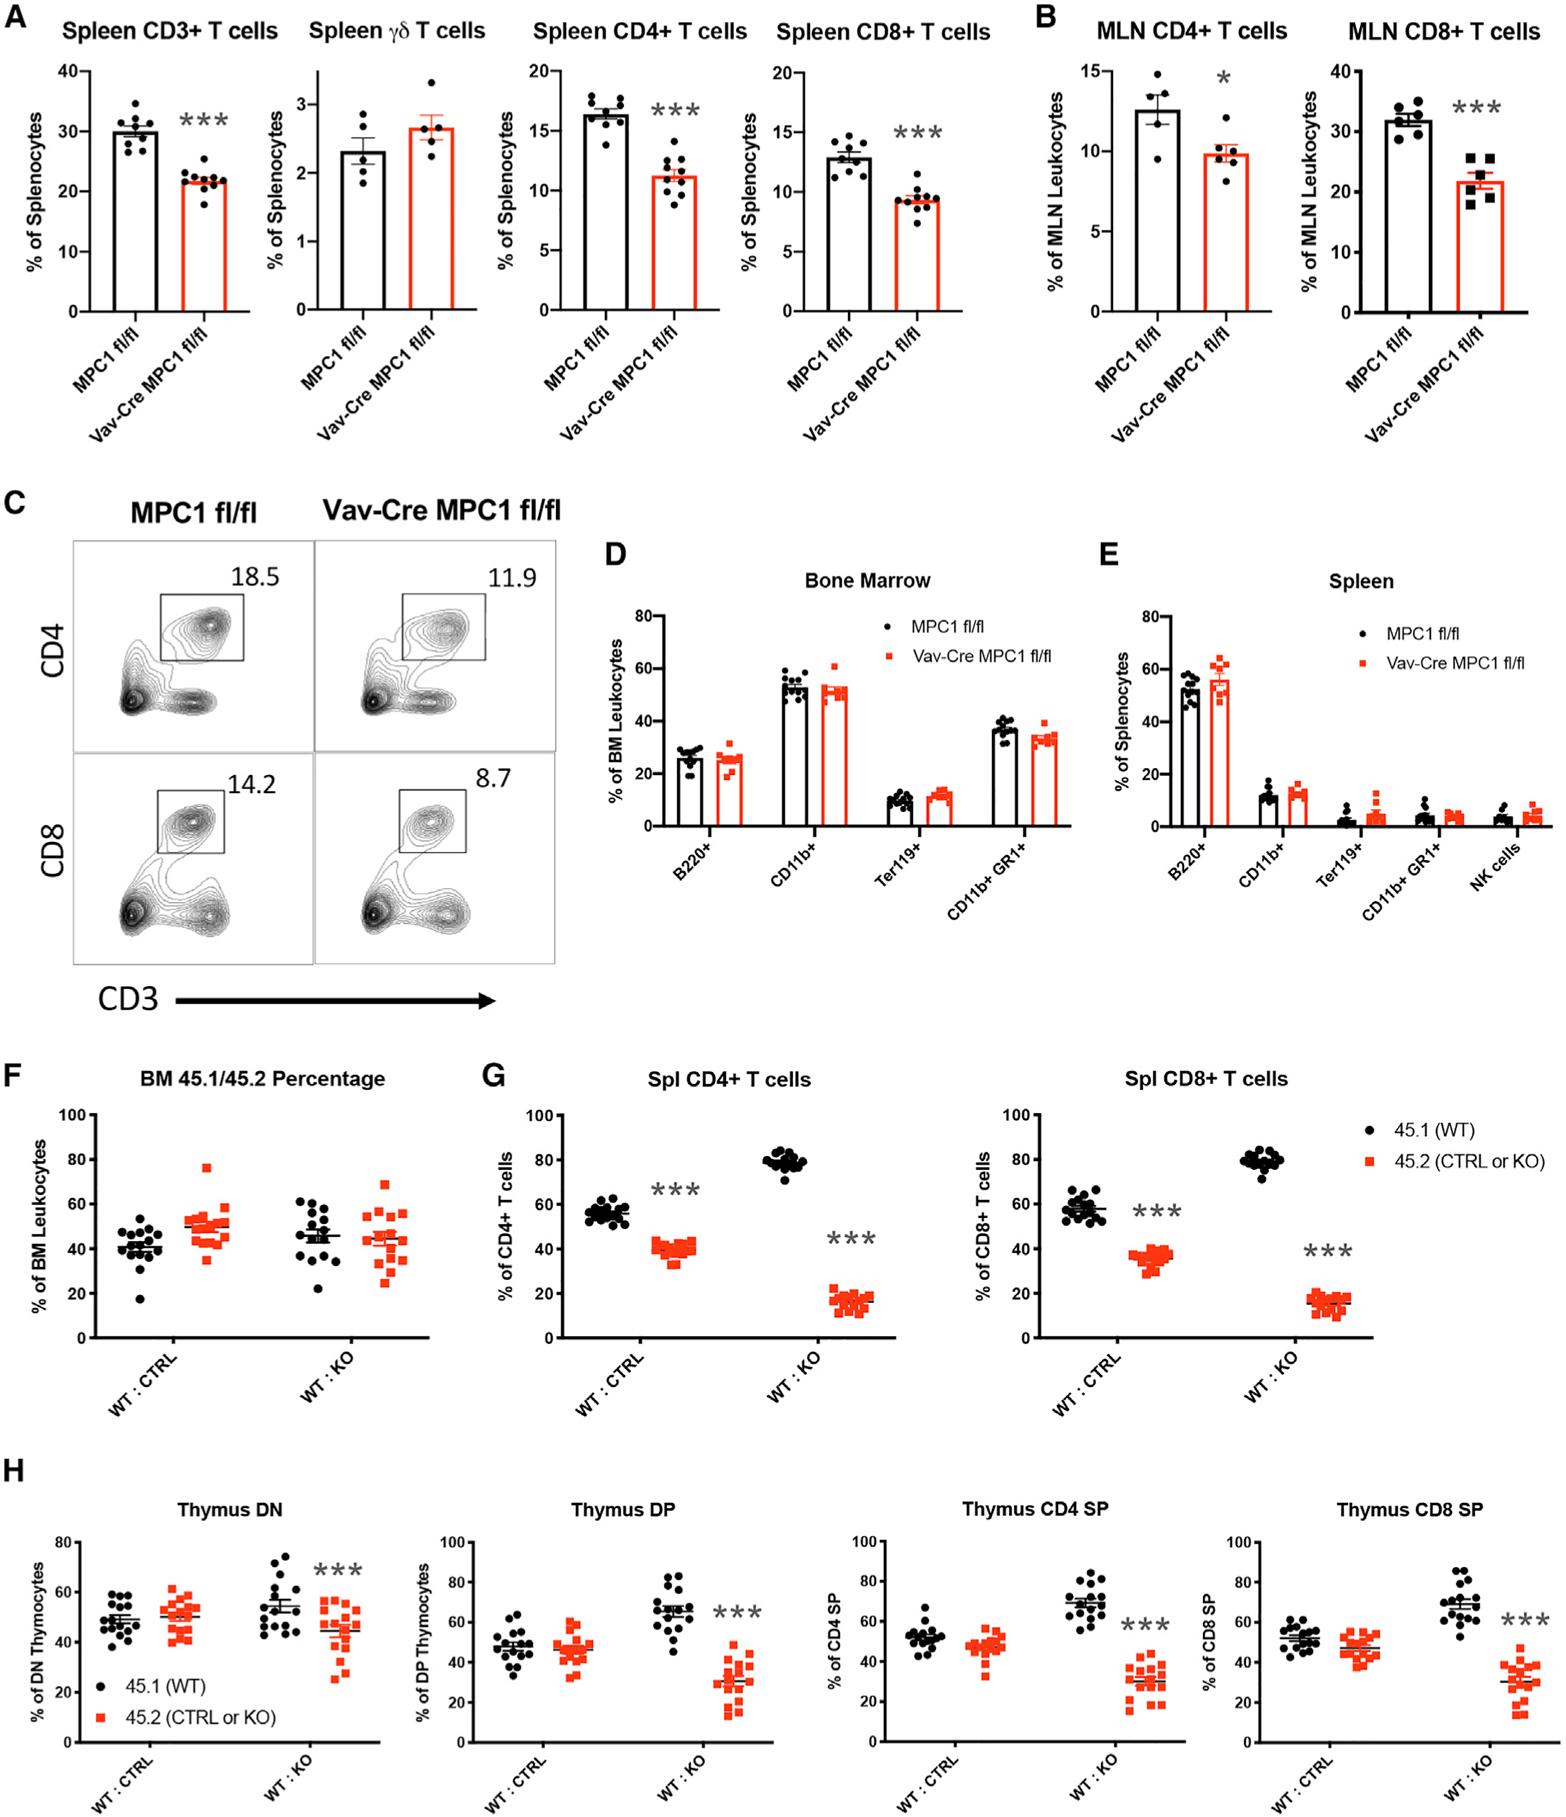
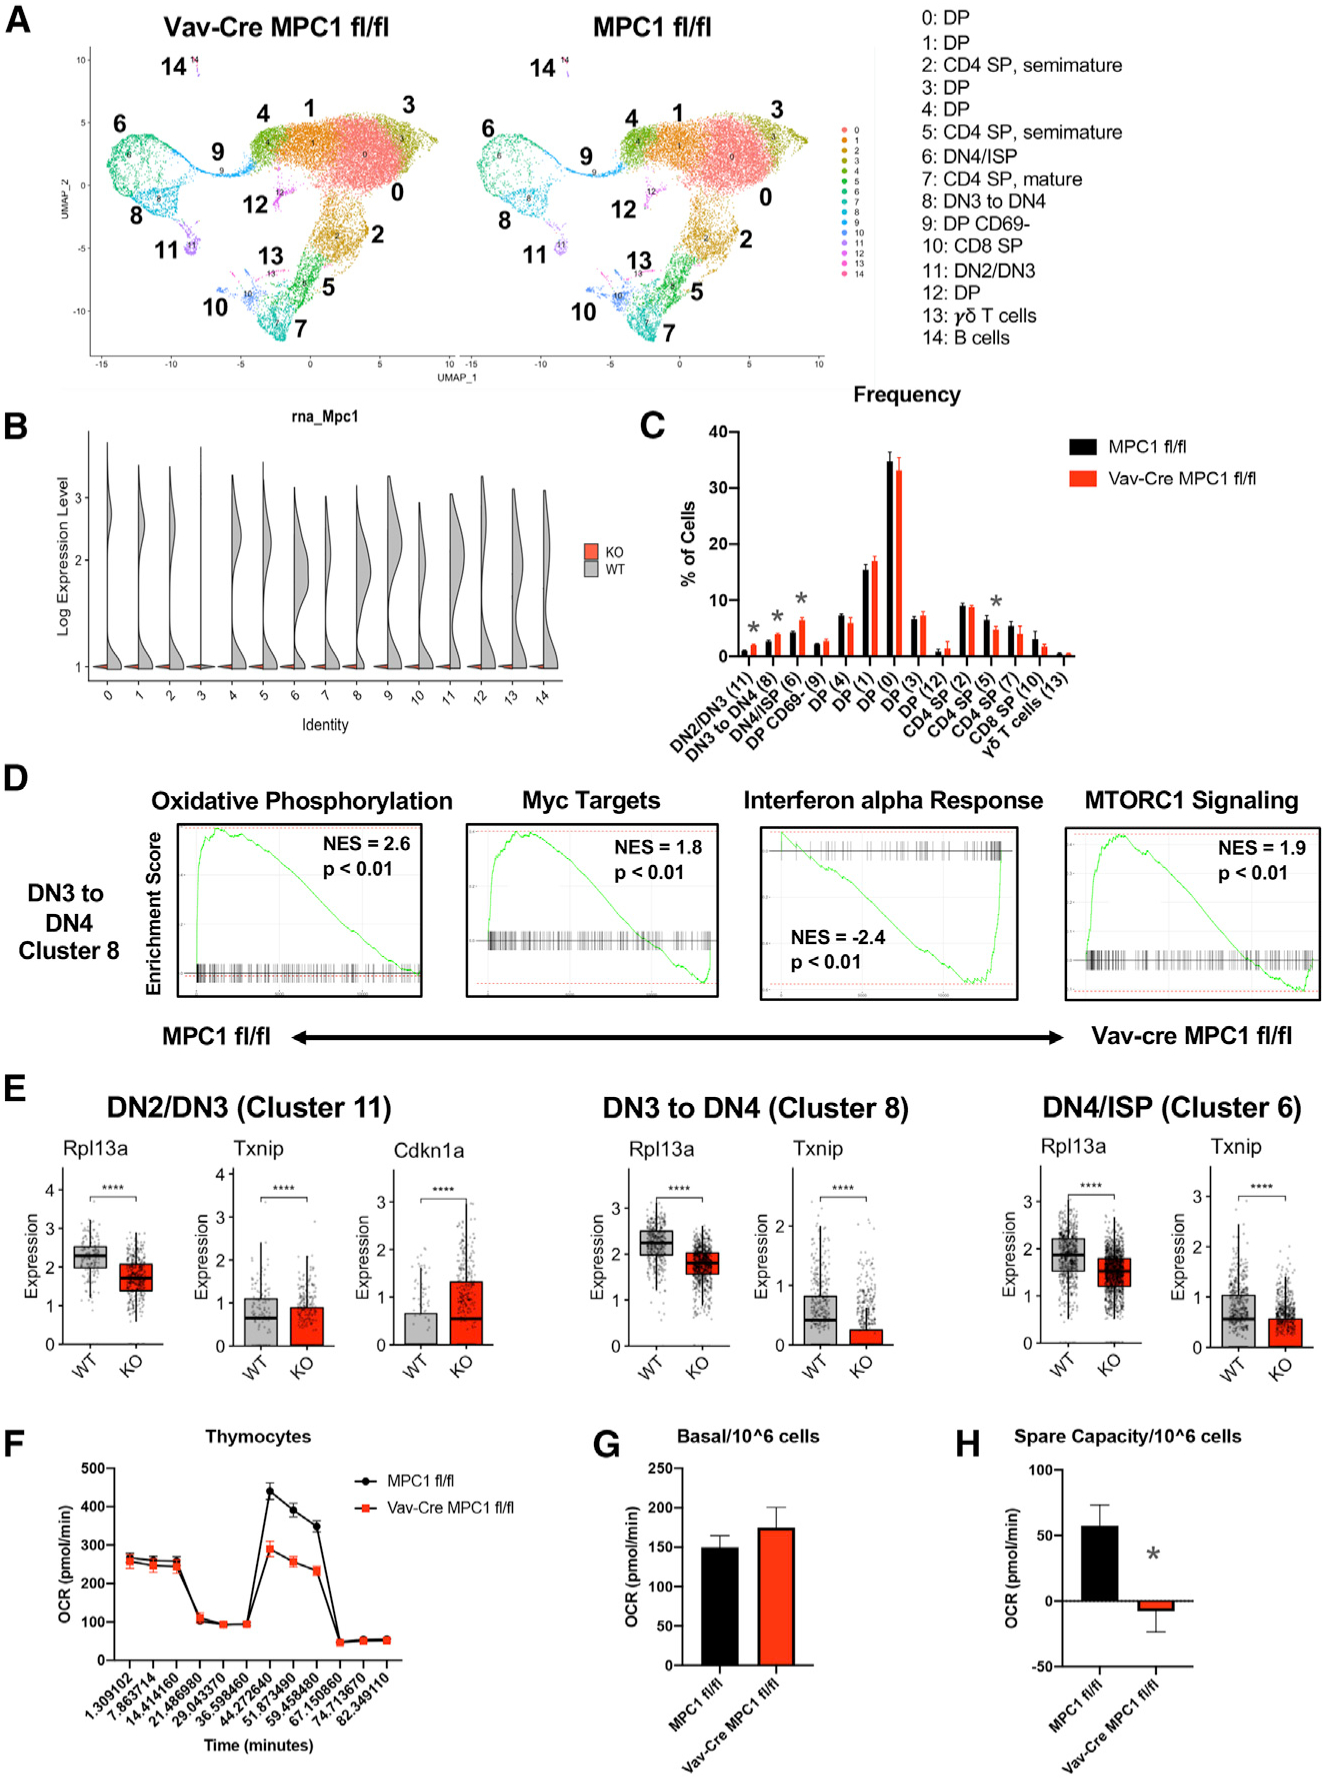
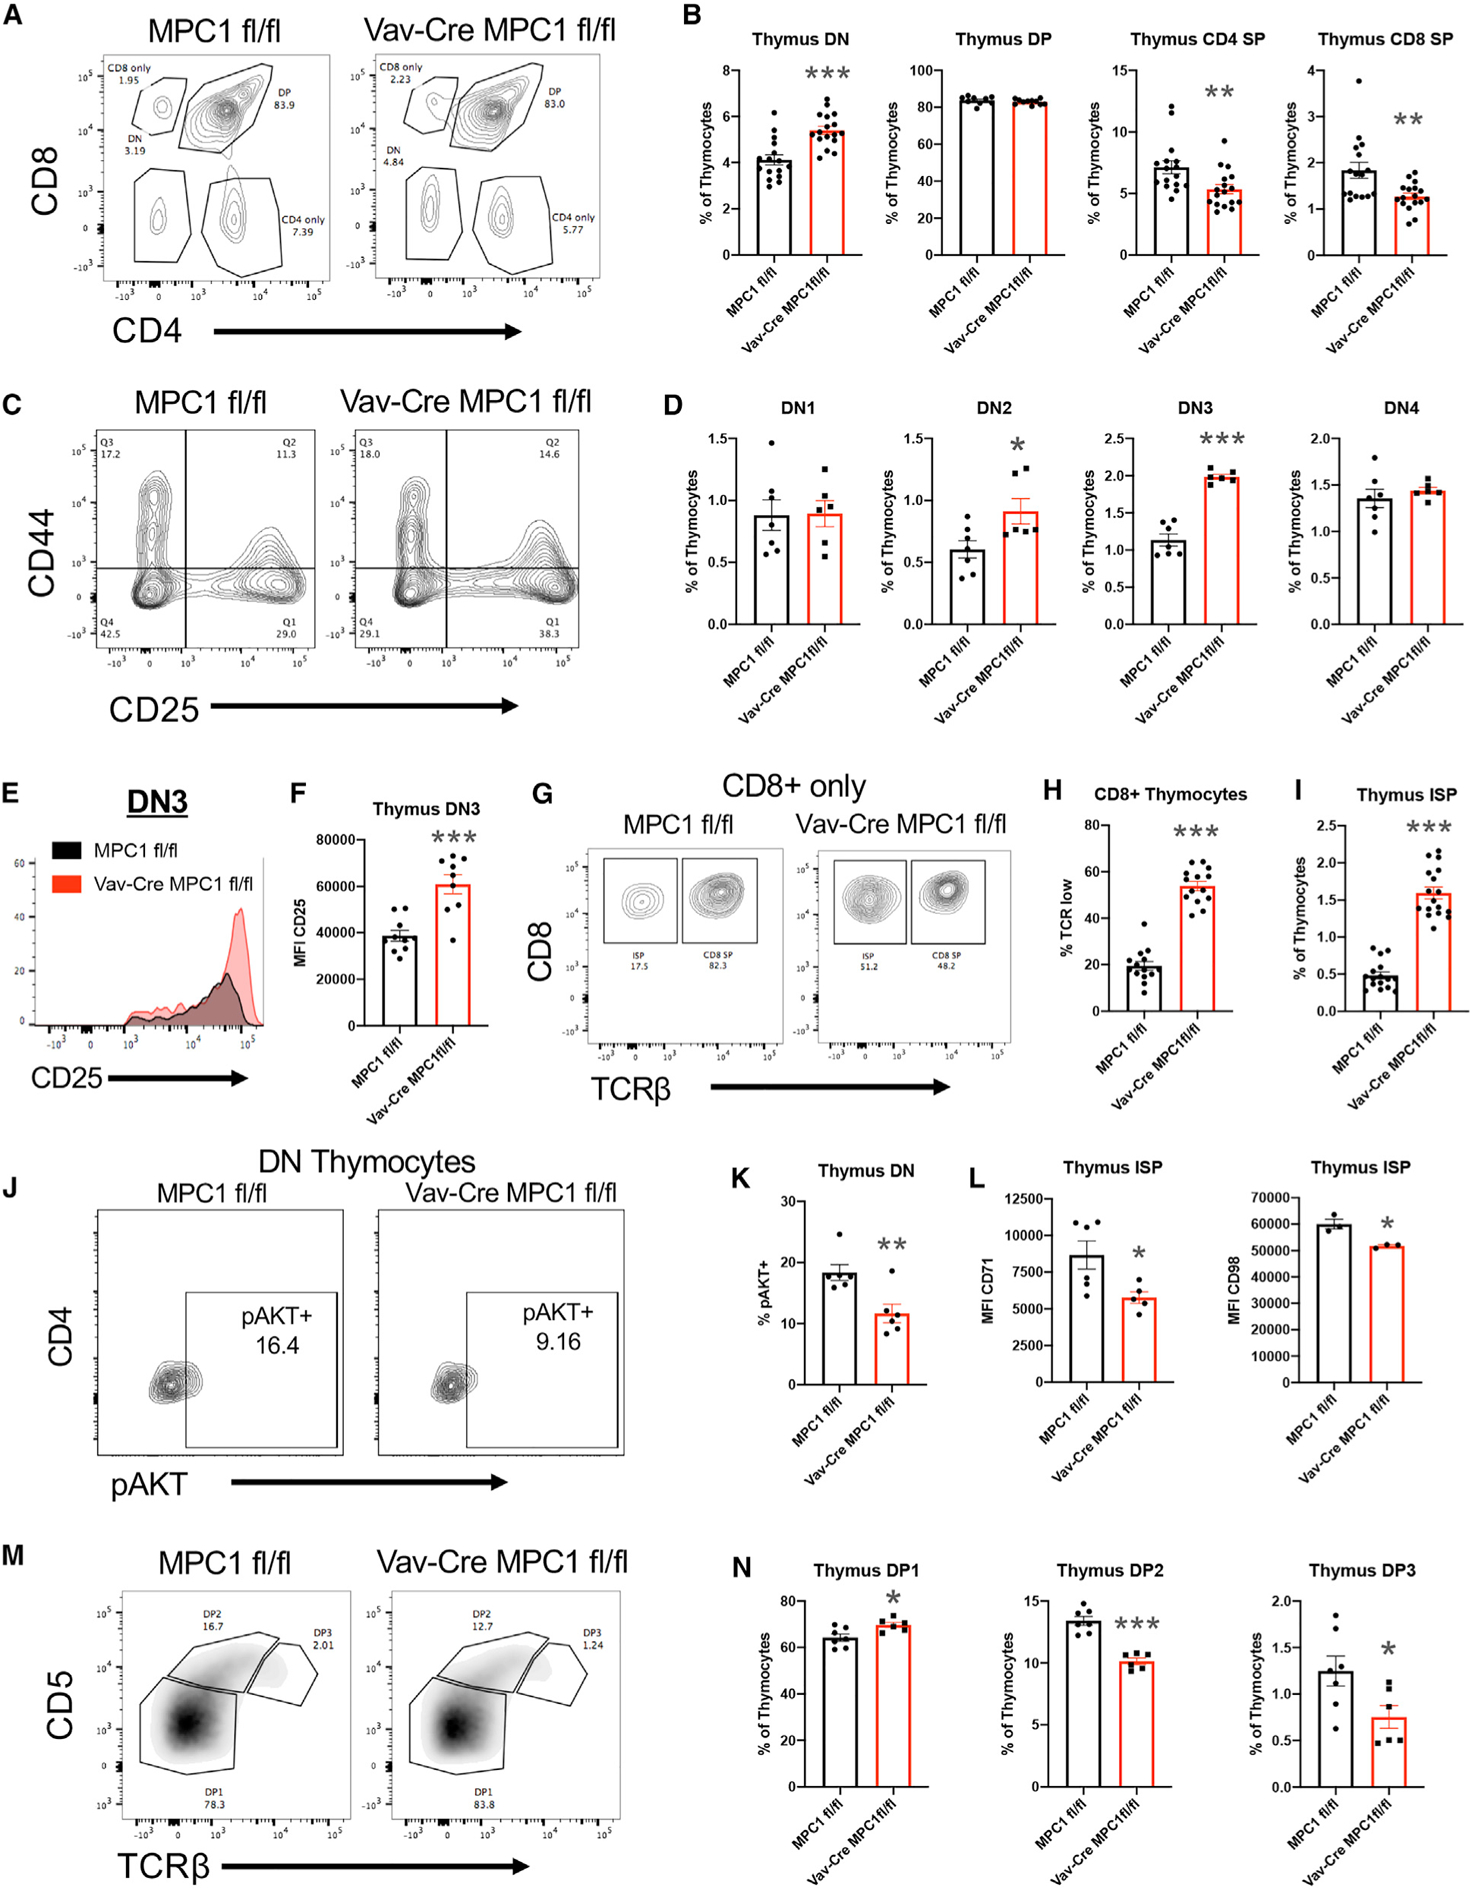
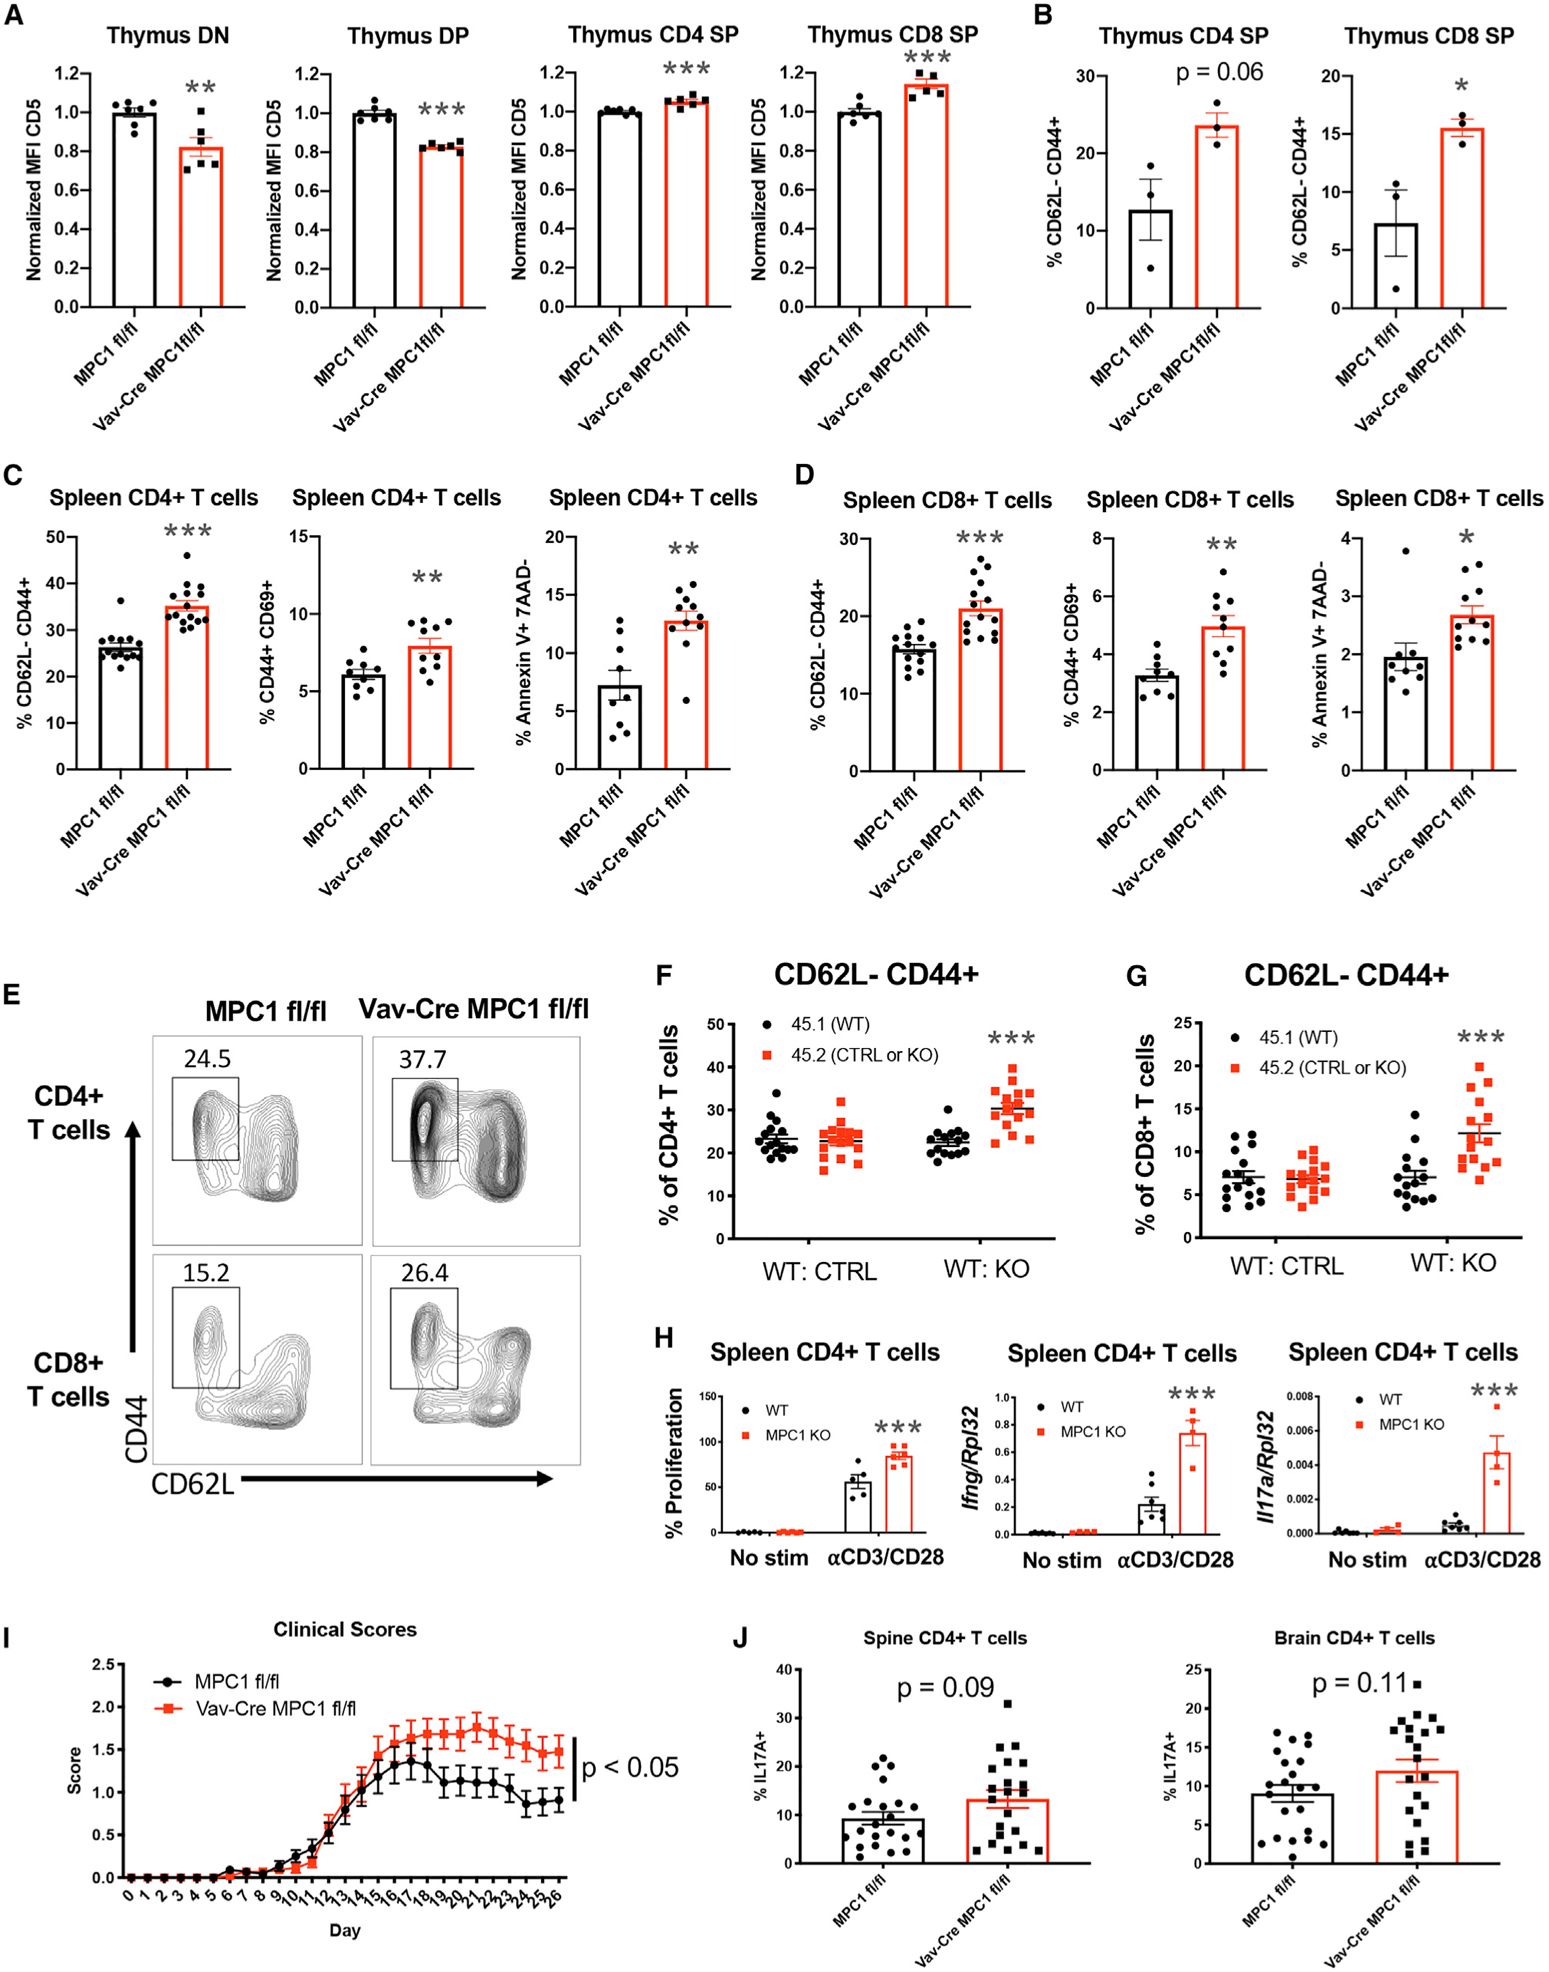
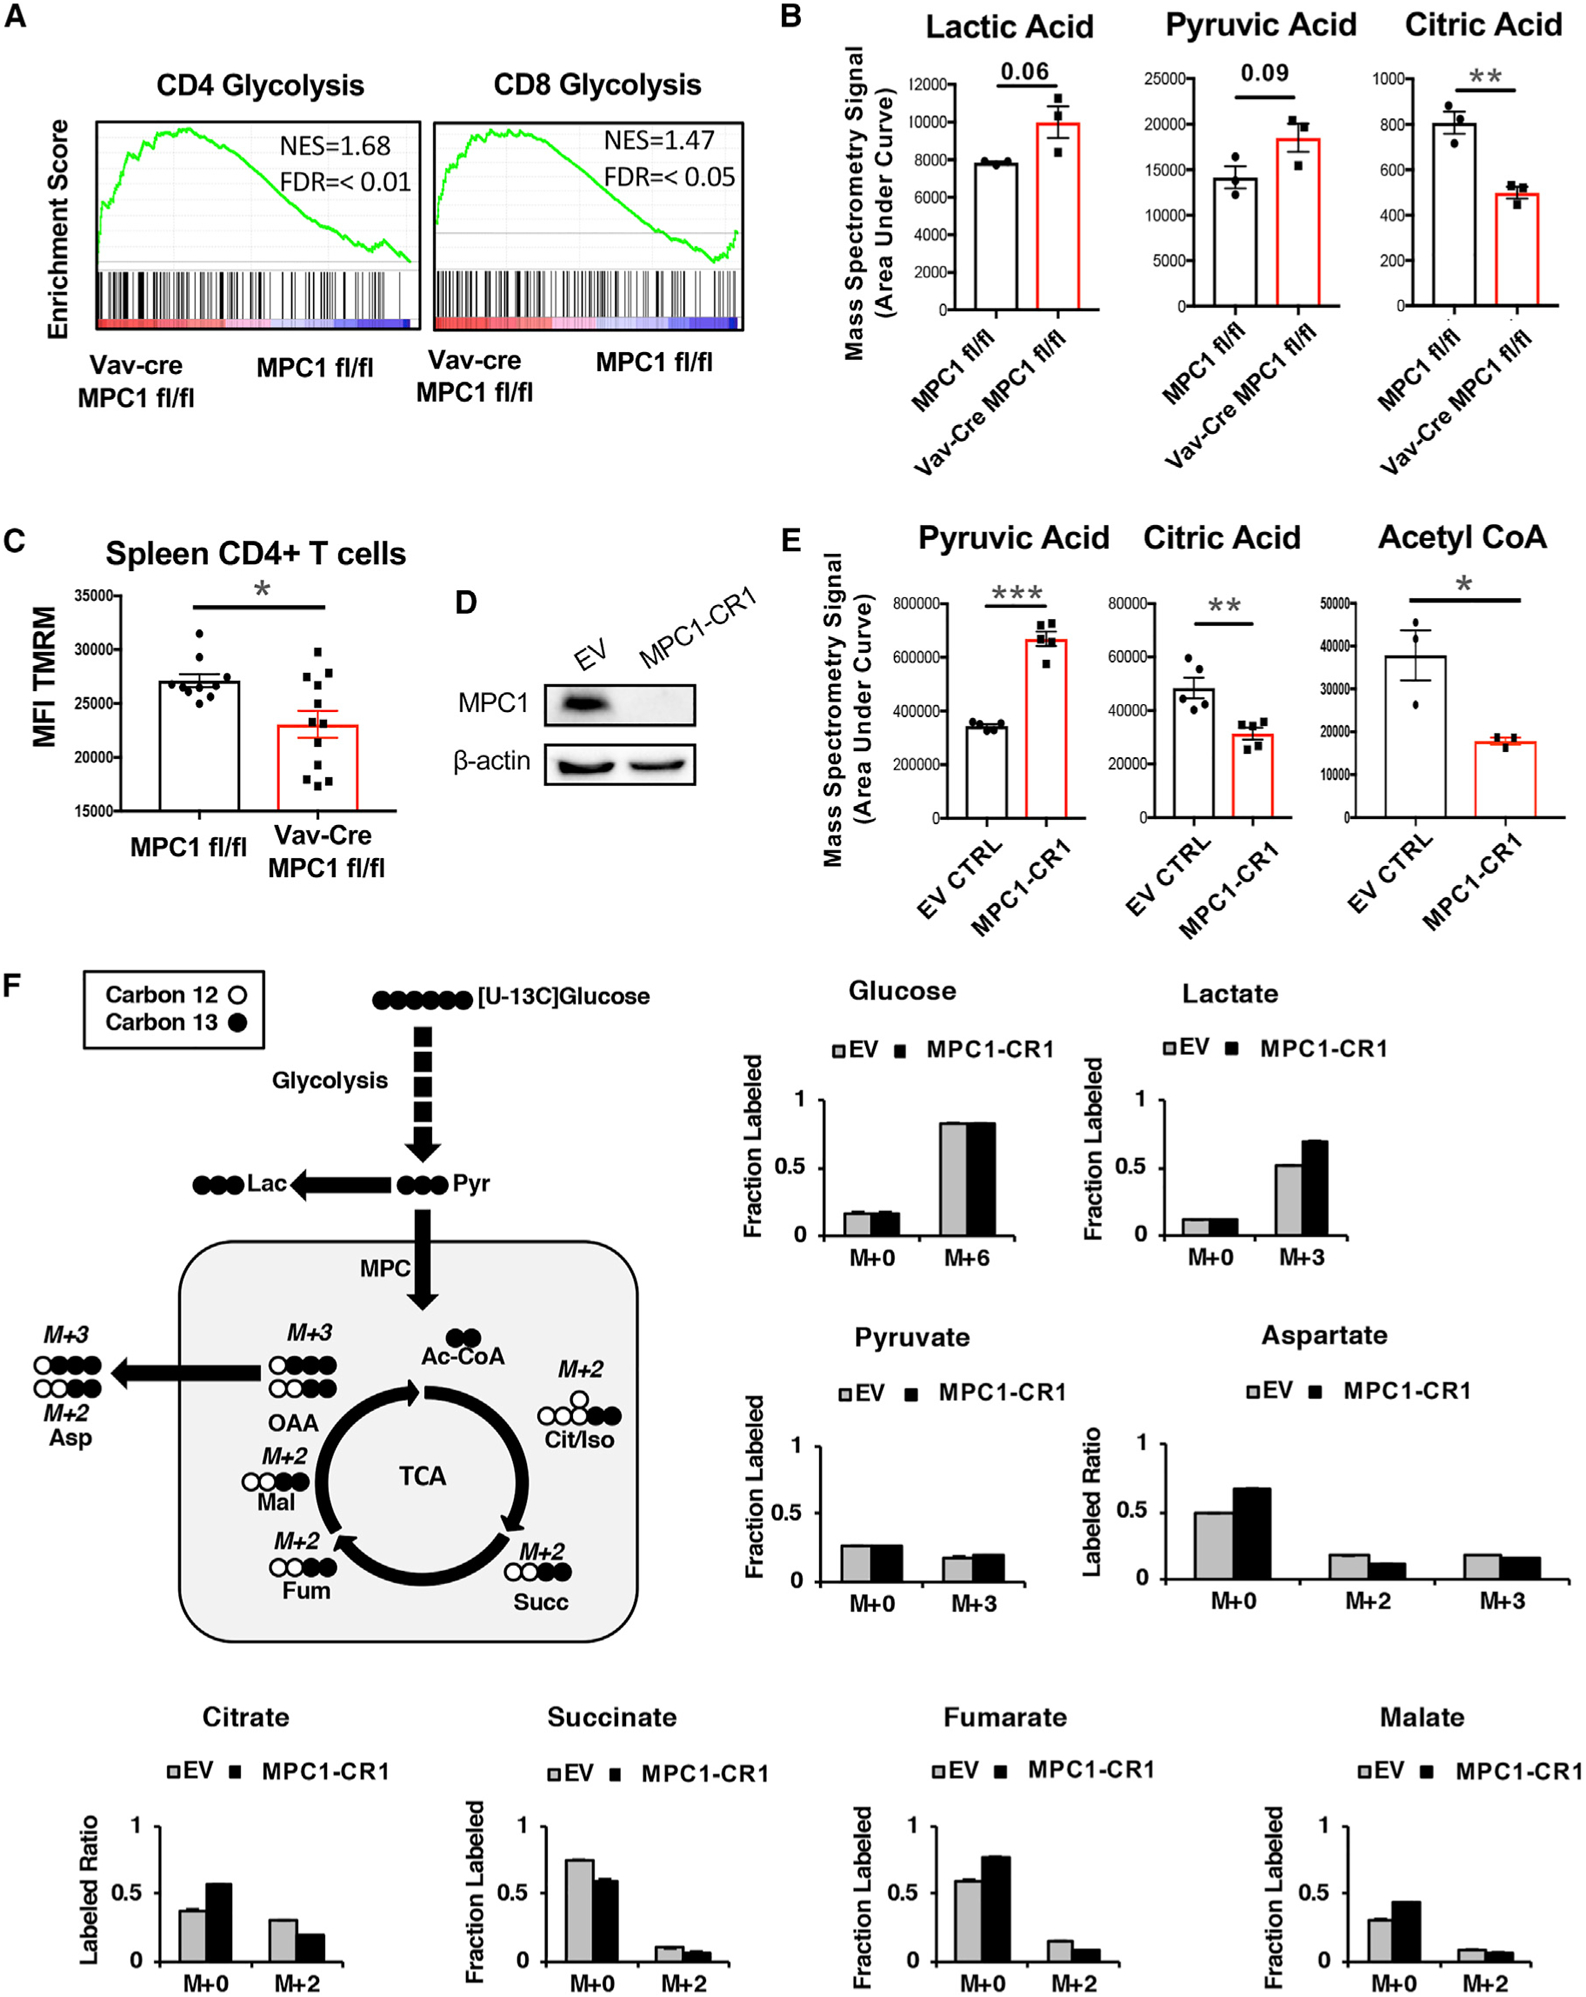
Metabolic pathways regulate T cell development and function, but many remain understudied. Recently, the mitochondrial pyruvate carrier (MPC) was identified as the transporter that mediates pyruvate entry into mitochondria, promoting pyruvate oxidation. Here we find that deleting Mpc1, an obligate MPC subunit, in the hematopoietic system results in a specific reduction in peripheral αβ T cell numbers. MPC1-deficient T cells have defective thymic development at the β-selection, intermediate single positive (ISP)-to-double-positive (DP), and positive selection steps. We find that early thymocytes deficient in MPC1 display alterations to multiple pathways involved in T cell development. This results in preferred escape of more activated T cells. Finally, mice with hematopoietic deletion of Mpc1 are more susceptible to experimental autoimmune encephalomyelitis. Altogether, our study demonstrates that pyruvate oxidation by T cell precursors is necessary for optimal αβ T cell development and that its deficiency results in reduced but activated peripheral T cell populations.


Conflict of interest statement

Declaration of Interests The authors declare no competing interests.

Figures

Figure 1.
Figure 1.. Loss of Hematopoietic MPC1 Expression Does Not Alter Baseline Hematopoiesis but Leads to a Cell-Intrinsic Decrease in Thymocytes and Peripheral αβ T Cell Populations
(A) Percentage of T cells in the spleen. (B) Percentage of αβ T cells in mesenteric lymph nodes (MLNs). (C) Representative flow plots of T cells in the spleen. (D and E) Percentage of bone marrow cells (D) and splenocytes (E) expressing the indicated markers, measured by flow cytometry. (F and G) Percent contributions by each donor to total bone marrow cells (F) and αβ T cells (G) after reconstitution. (H) Percent contributions by each donor to thymocyte subsets. All graphs represent mean ± SEM and contain data from multiple experiments. Statistical significance was measured by Student’s t test (A–E) or two-way ANOVA with Sidak post test (F–H). *p < 0.05, **p < 0.01, ***p < 0.001. See also Figure S1.
Figure 2.
Figure 2.. scRNA-Seq Reveals Altered Thymic Development and Metabolism in the Absence of MPC1
(A) Uniform Manifold Approximation and Projection (UMAP) clustering of Vav-Cre MPC1 fl/fl and MPC1 fl/fl thymocytes. (B) Expression of Mpc1 in clusters. (C) Percentage of total cells made up by each cluster. (D) GSEA gene expression plots for cluster 8. (E) Expression of select genes in clusters 11, 8, and 6. The graph represents box-and-whisker plots, and statistical significance was measured by Wilcoxon test with Holm correction for multiple testing. (F) Representative Seahorse plot for thymocytes. (G and H) Basal respiration (G) and spare respiratory capacity (H) per 106 cells with n = 5 for MPC1 fl/fl and n = 4 for Vav-Cre MPC1 fl/fl samples from two separate experiments. Graphs represent mean ± SEM, and statistical significance was measured by Student’s t test unless otherwise noted. *p < 0.05, **p < 0.01, ***p < 0.001. See also Figure S2.
Figure 3.
Figure 3.. Flow Cytometry Analysis of Thymic Populations
(A) Representative plot of CD4 and CD8 expression in the thymus. (B) Percentage of total thymocytes for CD4− CD8− (DN), CD4+ CD8+ (DP), CD4+ CD8− TCRβ+ (CD4 SP), and CD4− CD8+ TCRβ+ (CD8 SP) populations. (C) Representative plot of CD44 and CD25 expression in DN cells. (D) Percentage of total thymocytes for CD44+ CD25− (DN1), CD44+ CD25+ (DN2), CD44− CD25+ (DN3), and CD44− CD25− (DN4) DN cells. (E) Representative histogram of CD25 expression on DN3 cells. (F) Mean fluorescence intensity for CD25 expression on DN3 cells. (G) Representative plot for TCRβ expression on CD8+ CD4− thymocytes. (H) Percentage of CD8+ CD4− thymocytes expressing low levels of TCRβ. (I) Percentage of total thymocytes for the CD4− CD8+ TCRβ− CD3− (ISP) population. (J) Representative plot of phospho-AKT expression in DN thymocytes. (K) Percentage of DN thymocytes that express phospho-AKT. (L) Mean fluorescence intensity for CD71 and CD98 expression on ISP cells. (M) Representative plot of CD5 and TCRβ expression on DP cells. (N) Percent of total thymocytes for CD5 low TCRβ low (DP1), CD5 high TCRβ intermediate (DP2), and CD5 intermediate TCRβ high (DP3) DP cells. All graphs represent mean ± SEM and contain data from multiple experiments. Statistical significance was measured by Student’s t test. *p < 0.05, **p < 0.01, ***p < 0.001. See also Figure S3.
Figure 4.
Figure 4.. Loss of MPC1 Expression in Thymocytes Leads to Increased Homeostatic Activation of Peripheral T Cells
(A) Mean fluorescence intensity for CD5 expression on DN, DP, CD4 SP, and CD8 SP cells. (B) Percentage of CD73− CD4 SP and CD73− CD8 SP cells that are CD62L− CD44+. (C and D) Percentages of CD62L− CD44+, CD44+ CD69+, and Annexin V+ 7AAD− expression on splenic CD4+ T cells (C) and CD8+ T cells (D). (E) Representative flow plot for CD44 and CD62L expression on splenic T cells. (F and G) Percentage of CD4+ T cells (F) and CD8+ T cells (G) from each donor that are CD62L− CD44+ after two separate mixed bone marrow reconstitutions. Significance compares 45.2 to 45.1 cells. (H) Percentage of proliferation measured by Cell Trace Violet and gene expression measured by qPCR after in vitro activation of CD4+ T cells with αCD3 and αCD28. Significance compares KO to WT cells within each treatment. (I) Clinical scores during EAE. n = 22 mice per group from three separate experiments. (J) Percentage of CD4+ T cells in the spines and brains of EAE mice expressing IL-17A, measured by flow cytometry. All graphs represent mean ± SEM from multiple experiments. Statistical significance was measured by Student’s t test or two-way ANOVA with Sidak post test (F–I). *p < 0.05, **p < 0.01, ***p < 0.001. See also Figure S4.
Figure 5.
Figure 5.. Deletion of MPC1 Decreases Pyruvate Oxidation in CD4+ T Cells
(A) GSEA of the glycolysis pathway in splenic T cells. (B) Metabolites from primary spleen CD4+ T cells, measured by mass spectrometry. (C) Mean fluorescence of Tetramethylrhodamine, Methyl Ester, Perchlorate (TMRM) staining on splenic CD4+ T cells, measured by flow cytometry. (D) Human MPC1 protein expression in Jurkat T cells, measured by western blot. (E) Metabolites from empty vector (EV) or MPC1-deficient (MPC1-CR1) Jurkat T cells, measured by mass spectrometry. (F) 13C-glucose tracing after 4-h culture of EV or MPC1-CR1 Jurkat T cells, measured by mass spectrometry in triplicate. All graphs represent mean ± SEM. Statistical significance was measured by Student’s t test. *p < 0.05, **p < 0.01, ***p < 0.001. See also Figure S5.

References

    1. Almeida L, Lochner M, Berod L, and Sparwasser T (2016). Metabolic pathways in T cell activation and lineage differentiation. Semin. Immunol 28, 514–524. - PubMed
    1. Anderson SJ, Lauritsen JP, Hartman MG, Foushee AM, Lefebvre JM, Shinton SA, Gerhardt B, Hardy RR, Oravecz T, and Wiest DL (2007). Ablation of ribosomal protein L22 selectively impairs alphabeta T cell development by activation of a p53-dependent checkpoint. Immunity 26, 759–772. - PubMed
    1. Azzam HS, Grinberg A, Lui K, Shen H, Shores EW, and Love PE (1998). CD5 expression is developmentally regulated by T cell receptor (TCR) signals and TCR avidity. J. Exp. Med 188, 2301–2311. - PMC - PubMed
    1. Bantug GR, Fischer M, Grahlert J, Balmer ML, Unterstab G, Develioglu L, Steiner R, Zhang L, Costa ASH, Gubser PM, et al. (2018). Mitochondria-Endoplasmic Reticulum Contact Sites Function as Immunometabolic Hubs that Orchestrate the Rapid Recall Response of Memory CD8+ T Cells. Immunity 48, 542–555.e6. - PMC - PubMed
    1. Beier UH, Angelin A, Akimova T, Wang L, Liu Y, Xiao H, Koike MA, Hancock SA, Bhatti TR, Han R, et al. (2015). Essential role of mitochondrial energy metabolism in Foxp3+ T-regulatory cell function and allograft survival. FASEB J. 29, 2315–2326. - PMC - PubMed

Publication types

MeSH terms

Substances