Germline Features Associated with Immune Infiltration in Solid Tumors
- PMID: 32130895
- PMCID: PMC7082123
- DOI: 10.1016/j.celrep.2020.02.039
Germline Features Associated with Immune Infiltration in Solid Tumors
Abstract
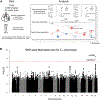
The immune composition of the tumor microenvironment influences response and resistance to immunotherapies. While numerous studies have identified somatic correlates of immune infiltration, germline features that associate with immune infiltrates in cancers remain incompletely characterized. We analyze seven million autosomal germline variants in the TCGA cohort and test for association with established immune-related phenotypes that describe the tumor immune microenvironment. We identify one SNP associated with the amount of infiltrating follicular helper T cells; 23 candidate genes, some of which are involved in cytokine-mediated signaling and others containing cancer-risk SNPs; and networks with genes that are part of the DNA repair and transcription elongation pathways. In addition, we find a positive association between polygenic risk for rheumatoid arthritis and amount of infiltrating CD8+ T cells. Overall, we identify multiple germline genetic features associated with tumor-immune phenotypes and develop a framework for probing inherited features that contribute to differences in immune infiltration.
Keywords: SNPs; cancer; germline; gwas; immune; immunotherapy; somatic.
Copyright © 2020 The Author(s). Published by Elsevier Inc. All rights reserved.
Conflict of interest statement
Declaration of Interests E.M.V.A. serves in an advisory/consulting role for the following corporations: Tango Therapeutics, Genome Medical, Invitae, Illumina, Ervaxx, and Janssen. He receives research support from Novartis and Bristol-Myers Squibb. He owns equity in Tango Therapeutics, Genome Medical, Syapse, Microsoft, and Ervaxx. He has received travel reimbursement from Roche/Genentech. He holds institutional patents filed on ERCC2 mutations and chemotherapy response, chromatin mutations and immunotherapy response, and methods for clinical interpretation.
Figures


Similar articles
-
Germline genetic polymorphisms influence tumor gene expression and immune cell infiltration.Proc Natl Acad Sci U S A. 2018 Dec 11;115(50):E11701-E11710. doi: 10.1073/pnas.1804506115. Epub 2018 Nov 21. Proc Natl Acad Sci U S A. 2018. PMID: 30463956 Free PMC article.
-
Association of Germline Variants in Natural Killer Cells With Tumor Immune Microenvironment Subtypes, Tumor-Infiltrating Lymphocytes, Immunotherapy Response, Clinical Outcomes, and Cancer Risk.JAMA Netw Open. 2019 Sep 4;2(9):e199292. doi: 10.1001/jamanetworkopen.2019.9292. JAMA Netw Open. 2019. PMID: 31483464 Free PMC article.
-
Germline genetic contribution to the immune landscape of cancer.Immunity. 2021 Feb 9;54(2):367-386.e8. doi: 10.1016/j.immuni.2021.01.011. Immunity. 2021. PMID: 33567262 Free PMC article.
-
Differentiation and Regulation of TH Cells: A Balancing Act for Cancer Immunotherapy.Front Immunol. 2021 May 3;12:669474. doi: 10.3389/fimmu.2021.669474. eCollection 2021. Front Immunol. 2021. PMID: 34012451 Free PMC article. Review.
-
Germline genetic variability in pancreatic cancer risk and prognosis.Semin Cancer Biol. 2022 Feb;79:105-131. doi: 10.1016/j.semcancer.2020.08.003. Epub 2020 Aug 18. Semin Cancer Biol. 2022. PMID: 32818625 Review.
Cited by
-
Mapping inherited genetic variation with opposite effects on autoimmune disease and cancer identifies candidate drug targets associated with the anti-tumor immune response.medRxiv [Preprint]. 2023 Dec 28:2023.12.23.23300491. doi: 10.1101/2023.12.23.23300491. medRxiv. 2023. Update in: Genes (Basel). 2025 May 14;16(5):575. doi: 10.3390/genes16050575. PMID: 38234717 Free PMC article. Updated. Preprint.
-
Mechanism of inert inflammation in an immune checkpoint blockade-resistant tumor subtype bearing transcription elongation defects.Cell Rep. 2023 Apr 25;42(4):112364. doi: 10.1016/j.celrep.2023.112364. Epub 2023 Apr 10. Cell Rep. 2023. PMID: 37043352 Free PMC article.
-
Protein-based immune profiles of basal-like vs. luminal breast cancers.Lab Invest. 2021 Jun;101(6):785-793. doi: 10.1038/s41374-020-00506-0. Epub 2021 Feb 23. Lab Invest. 2021. PMID: 33623115 Free PMC article.
-
Integrated Germline and Somatic Features Reveal Divergent Immune Pathways Driving Response to Immune Checkpoint Blockade.Cancer Immunol Res. 2024 Dec 3;12(12):1780-1795. doi: 10.1158/2326-6066.CIR-24-0164. Cancer Immunol Res. 2024. PMID: 39255339 Free PMC article.
-
Germline mechanisms of immunotherapy toxicities in the era of genome-wide association studies.Immunol Rev. 2023 Sep;318(1):138-156. doi: 10.1111/imr.13253. Epub 2023 Jul 28. Immunol Rev. 2023. PMID: 37515388 Free PMC article. Review.
References
-
- Ahola-Olli AV, Würtz P, Havulinna AS, Aalto K, Pitkänen N, Lehtimäki T, Kähönen M, Lyytikäinen LP, Raitoharju E, Seppälä I, et al. (2017). Genome-wide association study identifies 27 loci influencing concentrations of circulating cytokines and growth factors. Am. J. Hum. Genet 100, 40–50. - PMC - PubMed
-
- Alarcón-Riquelme ME, Ziegler JT, Molineros J, Howard TD, Moreno-Estrada A, Sánchez-Rodríguez E, Ainsworth HC, Ortiz-Tello P, Comeau ME, Rasmussen A, et al. (2016). Genome-wide association study in an Amerindian ancestry population reveals novel systemic lupus erythematosus risk loci and the role of European admixture. Arthritis Rheumatol. 68, 932–943. - PMC - PubMed
Publication types
MeSH terms
Grants and funding
LinkOut - more resources
Full Text Sources
Medical
Research Materials

