. 2020 Mar 3;30(9):2923-2933.e7.
doi: 10.1016/j.celrep.2020.02.021.

Interplay of Staphylococcal and Host Proteases Promotes Skin Barrier Disruption in Netherton Syndrome

Affiliations

Interplay of Staphylococcal and Host Proteases Promotes Skin Barrier Disruption in Netherton Syndrome

Michael R Williams et al. Cell Rep. .

Abstract

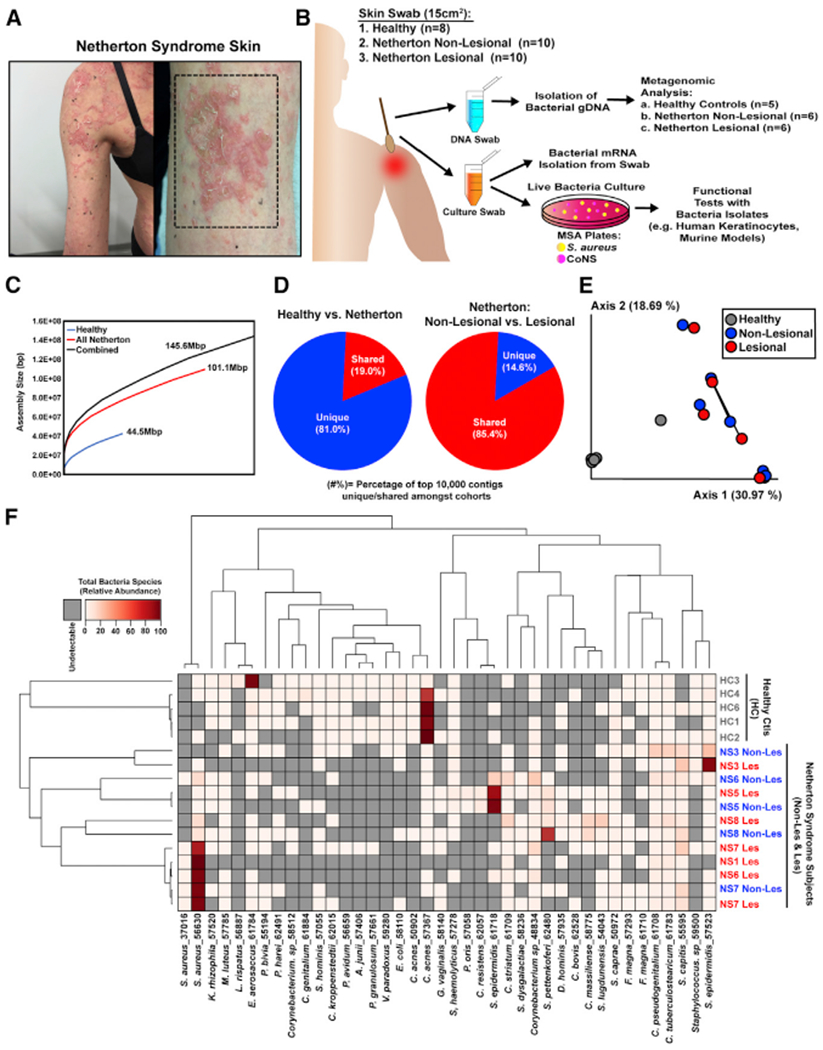
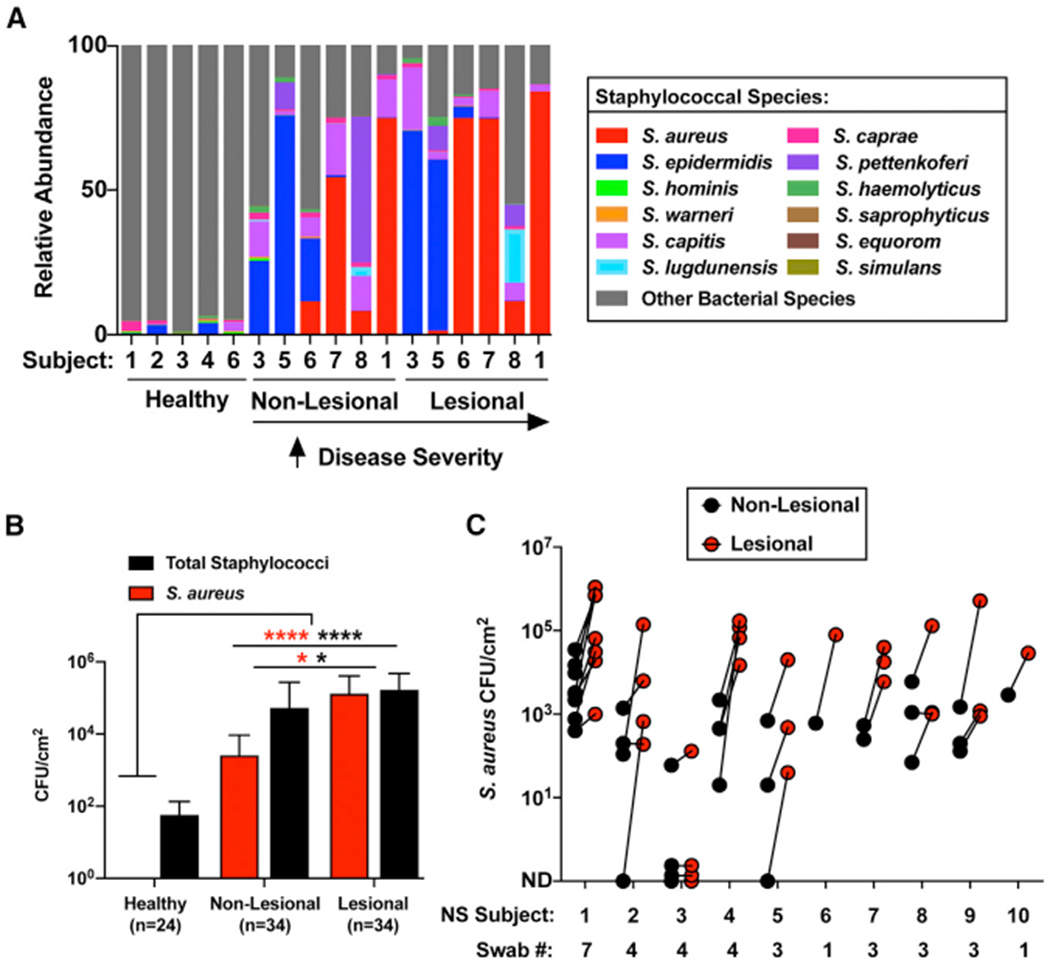
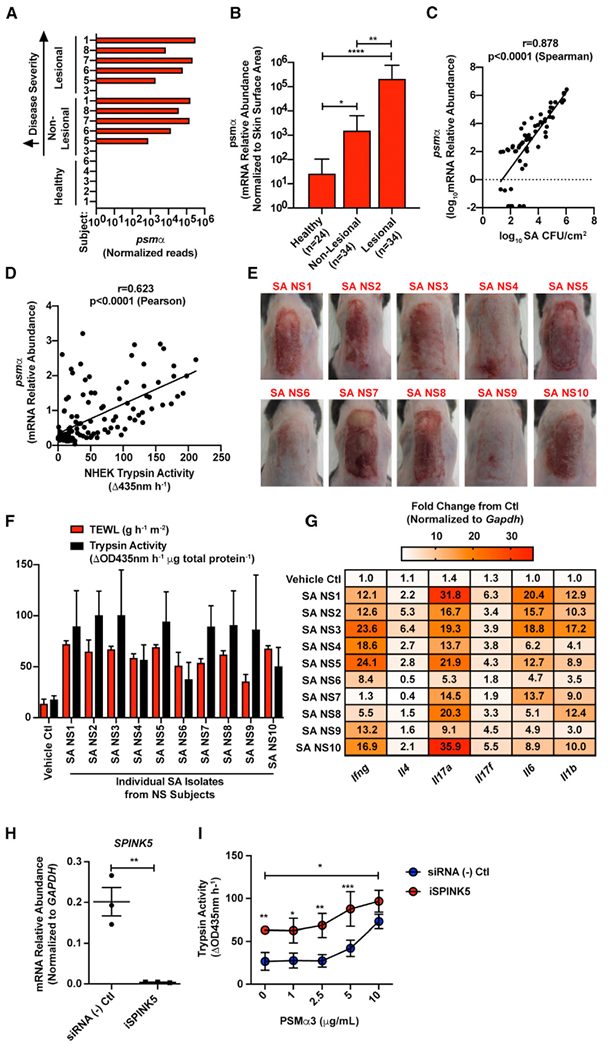
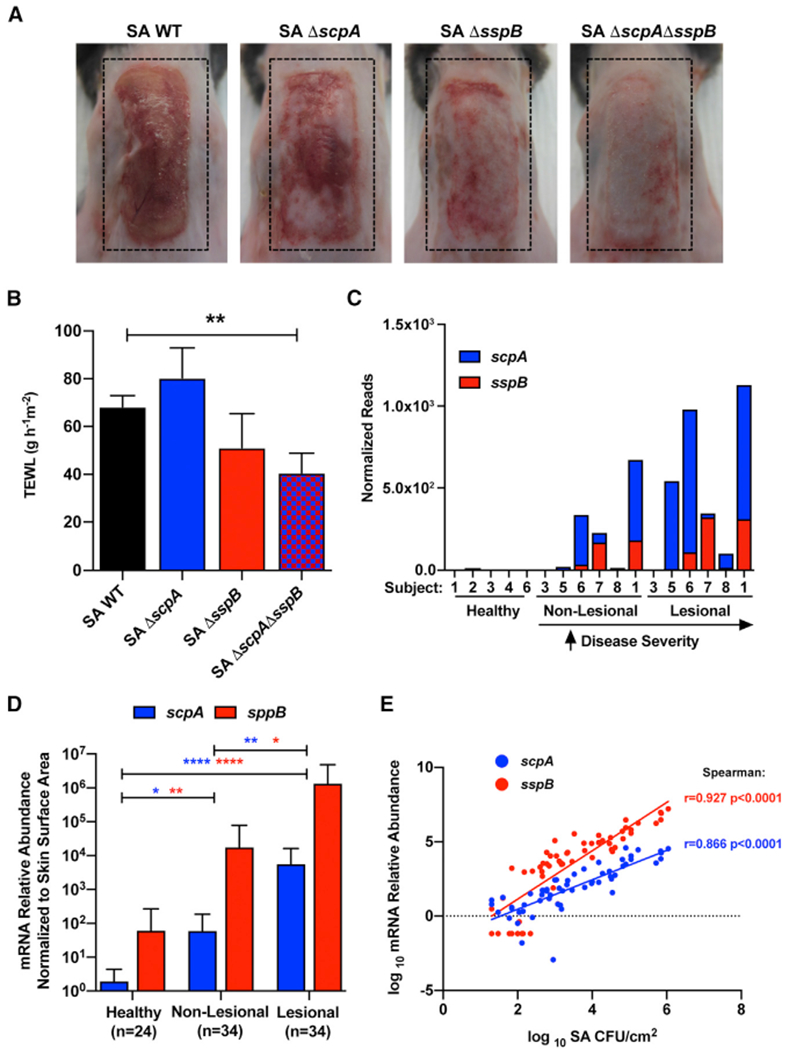
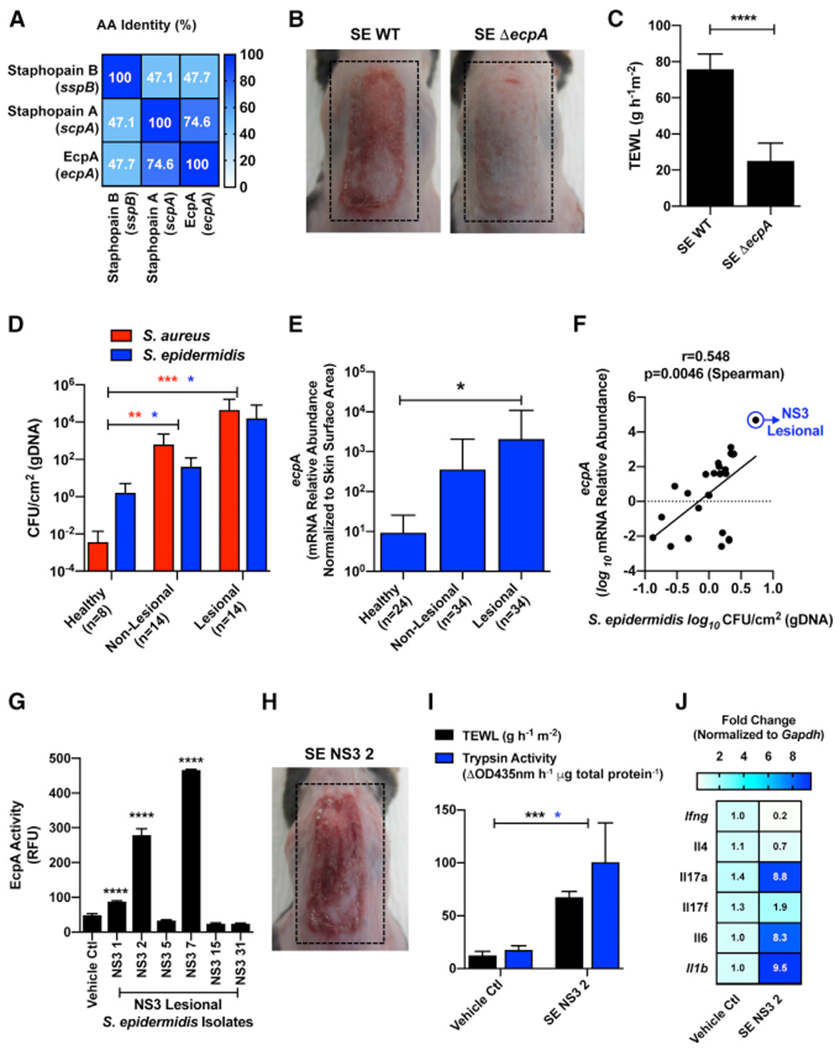
Netherton syndrome (NS) is a monogenic skin disease resulting from loss of function of lymphoepithelial Kazal-type-related protease inhibitor (LEKTI-1). In this study we examine if bacteria residing on the skin are influenced by the loss of LEKTI-1 and if interaction between this human gene and resident bacteria contributes to skin disease. Shotgun sequencing of the skin microbiome demonstrates that lesional skin of NS subjects is dominated by Staphylococcus aureus (S. aureus) and Staphylococcus epidermidis (S. epidermidis). Isolates of either species from NS subjects are able to induce skin inflammation and barrier damage on mice. These microbes promote skin inflammation in the setting of LEKTI-1 deficiency due to excess proteolytic activity promoted by S. aureus phenol-soluble modulin α as well as increased bacterial proteases staphopain A and B from S. aureus or EcpA from S. epidermidis. These findings demonstrate the critical need for maintaining homeostasis of host and microbial proteases to prevent a human skin disease.

Keywords: Netherton syndrome; S. aureus; S. epidermidis; epidermal barrier; proteases; skin inflammation; skin microbiome.


Conflict of interest statement

Declaration of Interests R.L.G. is a co-founder, scientific advisor, consultant, and has equity in MatriSys Biosciences and is a consultant, receives income, and has equity in Sente. All other authors declare no competing interests.

Figures

Figure 1.
Figure 1.. Netherton Skin Microbiome Differs from Healthy Skin
(A) Representative picture of Netherton syndrome skin with severe disease. (B) Workflow of Netherton skin microbiome collection and analysis. (C) QUAST plots to assess the size of contigs for all assemblies. Three different co-assemblies were performed: reads from all samples (healthy and infected) (black), reads from only the Netherton cohort (red), and reads from only the healthy samples (blue). (D) Pie chart representing the percentage of the top 10,000 contigs unique (blue) or shared (red) between healthy subjects and Netherton syndrome patients (left chart) and between Netherton syndrome non-lesional skin and lesional skin (right chart). (E)Principal-coordinates analysis (PCoA) plot of beta diversity among samples using the Bray-Curtis dissimilarity metric. Each dot represents an individual swab. Swabs fromlesional and non-lesional skin from the same subject are connected by a black line. (F) Hierarchical clustering of samples showing the top 40 most prevalent species across all samples. See also Figures S1–S3.
Figure 2.
Figure 2.. Staphylococcus aureus Colonization Is Increased on Netherton Syndrome Skin
(A) Percentage relative abundance of staphylococcal species within the total bacterial population on healthy controls, NS non-lesional, and NS lesional skin. NS subjects are arranged according to disease severity. (B) S. aureus (red) and total staphylococci (black) colony-forming units (CFUs) per square centimeter of skin from healthy controls and NS non-lesional and lesional skin (n, number of swabs assessed per condition). Results represent mean ± SEM, and the non-parametric unpaired Kruskal-Wallis test was used to determine statistical significance: *p < 0.05, **p < 0.01, ***p < 0.001, and ****p < 0.0001. (C) S. aureus CFUs per square centimeter of skin of NS non-lesional (black) and lesional (red) skin swabs at different visits (swab number) for each subject within the NS cohort. Each dot represents a swab sample. Different numbers of swabs were collected for the different subjects depending on the number of visits they had during the time of the study. See also Figure S4.
Figure 3.
Figure 3.. Staphylococcus aureus PSMα Is Increased on Netherton syndrome Skin and Promotes Epidermal Protease Activity
(A) Normalized counts of the gene psmα detected from metagenomic samples. (B) Relative abundance of S. aureus psmα mRNA isolated from skin swabs of healthy and NS non-lesional and lesional skin (n, number of swabs assessed per condition). Results represent mean ± SEM, and a non-parametric unpaired Kruskal-Wallis test was used to determine statistical significance: *p < 0.05, **p < 0.01, ***p < 0.001, and ****p < 0.0001. (C) Spearman correlation between S. aureus (SA) CFU/cm2 and the relative abundance of S. aureus psmα mRNA isolated from skin swabs. Each dot represents an individual swab. (D) Pearson correlation between the trypsin activity induced in neonatal human epidermal keratinocytes (NHEKs) after culture for 24 h with 5% supernatant of clinical S. aureus (SA) isolates from NS skin and the relative abundance of psmα mRNA level in the same SA isolates. Each dot represents an individual SA isolate. (E–G) Epicutaneous application of 1e7 CFU/cm2 of S. aureus clinical isolates on murine back skin for 48 h (n = 3 per group). For each NS subject, one lesional S. aureus isolate with a high psmα expression was selected for mouse skin application. (E) Visual representation of murine back skin after 48 h colonization with 1e7 CFU/cm2 SA isolates. (F and G) Analysis of (F) epidermal barrier damage (TEWL), trypsin activity, and (G) qPCR analysis of inflammatory cytokines stimulated in murine skin by clinical SA NS isolates 1–10. qPCR cytokine levels (Ifng, Il4, Il17a, Il17f, Il6, and Il1b) are normalized to the housekeeping gene Gapdh. (H) Relative abundance of SPINK5 mRNA in NHEKs that were treated with scrambled control or SPINK5 siRNA (iSPINK5) (n = 3 per condition). Each dot represents an individual sample. Results represent mean ± SEM, and Student’s t test was used to determine statistical significance: *p < 0.05, **p < 0.01, ***p < 0.001, and ****p < 0.0001. (I) Trypsin activity from conditioned medium of NHEKs that were pretreated with scrambled control or SPINK5 siRNA (iSPINK5) and then cultured for 24 h with S. aureus synthetic PSMα3 peptide (0, 1, 2.5, 5, and 10 μg/mL) (n = 4 per condition). Results represent mean ± SEM, and two-way ANOVA was used to determine statistical significance: *p < 0.05, **p < 0.01, ***p < 0.001, and ****p < 0.0001. In (E)–(I), experiments are representative of two independent experiments. See also Figure S5.
Figure 4.
Figure 4.. Staphylococcus aureus Staphopain A (scpA) and B (sspB) Are Increased in Netherton Syndrome and Induce Epithelial Barrier Damage
(A and B) (A) Representative picture and (B) TEWL measurement of female C57BL/6J murine back skin after epicutaneous application of 1e7 CFU/cm2 of S. aureus (SA) wild-type (WT), SA scpA knockout (−ΔscpA), SA sspB knockout (ΔsspB), or SA scpA/sspB double knockout (ΔscpAΔsspB) for 48 h (n = 5 per group). Results represent mean ± SEM, and one-way ANOVA was used to determine statistical significance: *p < 0.05, **p < 0.01, ***p < 0.001, and ****p < 0.0001. (C) Number of reads from metagenomic data corresponding to S. aureus scpA (red) and sspB (blue) genes normalized per library size for each sample. (D) Relative abundance of S. aureus scpA (red) and sspB (blue) mRNA isolated from swabs of healthy control and NS non-lesional and lesional skin normalized to skin area (n, number of individual skin swabs per condition). Results represent mean ± SEM, and a non-parametric unpaired Kruskal-Wallis test was used to determine statistical significance: *p < 0.05, **p < 0.01, ***p < 0.001, and ****p < 0.0001. (E) Spearman correlation between the relative abundance of either scpA (red) or sspB (blue) mRNA and S. aureus (SA) CFU/cm2 from all skin swabs. Each dot represents an individual swab. Results are represented as mean ± SEM. In (A) and (B), data are representatives of at least two independent experiments. See also Figure S5.
Figure 5.
Figure 5.. Staphylococcus epidermidis Colonization Is Increased in Netherton Syndrome Skin and Can Induce Epithelial Barrier Damage through the Expression of the Cysteine Protease EcpA
(A) Percentage amino acid sequence identity of the mature forms of the two S. aureus secreted cysteine proteases staphopain A (scpA) and staphopain B (sspB) and the S. epidermidis secreted cysteine protease EcpA (ecpA). (B and C) (B) Representative pictures and (C) TEWL measurement of female C57BL/6J murine back skin after epicutaneous application of 1e7 CFU/cm2 of S. epidermidis (SE) wild-type (WT) or SE ecpA knockout (ΔecpA) strains for 48h (n = 5 per group). Results represent mean ± SEM, and Student’s t test was used to determine statistical significance: *p < 0.05, **p < 0.01, ***p < 0.001, and ****p < 0.0001. (D) Measurement of gDNA absolute abundance of S. epidermidis (blue bars) and S. aureus (red bars) CFU/cm2 on NS (non-lesional and lesional) versus healthy skin (n, number of individual skin swabs per condition). Results represent mean ± SEM, and a non-parametric unpaired Kruskal-Wallis test was used to determine statistical significance: *p < 0.05, **p < 0.01, ***p < 0.001, and ****p < 0.0001. (E) Relative abundance of S. epidermidis ecpA mRNA isolated from swabs of healthy control and NS non-lesional and lesional skin normalized to skin area (n, number of individual skin swabs per condition). Results represent mean ± SEM, and a non-parametric unpaired Kruskal-Wallis test was used to determine statistical significance: *p < 0.05, **p < 0.01, ***p < 0.001, and ****p < 0.0001. (F) Spearman correlation between the relative abundance of S. epidermidis ecpA mRNA and S. epidermidis CFU/cm2 (gDNA) from skin swabs. (G) Assessment of subject NS3 isolated S. epidermidis isolates from lesional skin swabs for specific cleavage of EcpA substrate (n = 3). Results represent mean ± SEM, and a one-way ANOVA was used to determine statistical significance: *p < 0.05, **p < 0.01, ***p < 0.001, and ****p < 0.0001. (H) Representative picture of murine back skin after 48 h colonization with 1e7 CFU/cm2 of clinical S. epidermidis isolate NS3 2 (SE. NS3 2). (I and J) Analysis of epidermal barrier damage (TEWL), trypsin activity, and qPCR analysis of inflammatory cytokines stimulated in murine skin by S. epidermidis isolate SE. NS3 2. qPCR cytokine levels (Ifng, Il4, Il17a, Il17f, Il6, and Il1b) are normalized to the housekeeping gene Gapdh. In (B), (C), and (G)–(J), data are representatives of at least two independent experiments. See also Figures S5 and S6.

References

    1. Alsterholm M, Strömbeck L, Ljung A, Karami N, Widjestam J, Gillstedt M, Åhren C, and Faergemann J (2017). Variation in Staphylococcus aureus colonization in relation to disease severity in adults with atopic dermatitis during a five-month follow-up. Acta Derm. Venereol 97, 802–807. - PubMed
    1. Bennett K, Callard R, Heywood W, Harper J, Jayakumar A, Clayman GL, Di WL, and Mills K (2010). New role for LEKTI in skin barrier formation: label-free quantitative proteomic identification of caspase 14 as a novel target for the protease inhibitor LEKTI. J. Proteome Res 9, 4289–4294. - PubMed
    1. Bitoun E, Chavanas S, Irvine AD, Lonie L, Bodemer C, Paradisi M, Hamel-Teillac D, Ansai S, Mitsuhashi Y, Taieb A, de Prost Y, Zambruno G, Harper JI, and Hovnanian A (2002). Netherton syndrome: disease expression and spectrum of SPINK5 mutations in 21 families. J Invest Dermatol 118, 352–361. - PubMed
    1. Bonnart C, Deraison C, Lacroix M, Uchida Y, Besson C, Robin A, Briot A, Gonthier M, Lamant L, Dubus P, et al. (2010). Elastase 2 is expressed in human and mouse epidermis and impairs skin barrier function in Netherton syndrome through filaggrin and lipid misprocessing. J. Clin. Invest 120, 871–882. - PMC - PubMed
    1. Briot A, Deraison C, Lacroix M, Bonnart C, Robin A, Besson C, Dubus P, and Hovnanian A (2009). Kallikrein 5 induces atopic dermatitis-like lesions through PAR2-mediated thymic stromal lymphopoietin expression in Netherton syndrome. J. Exp. Med 206, 1135–1147. - PMC - PubMed

Publication types

MeSH terms