. 2020 Mar 3;30(9):3004-3019.e5.
doi: 10.1016/j.celrep.2020.02.028.

Microglial Homeostasis Requires Balanced CSF-1/CSF-2 Receptor Signaling

Affiliations

Microglial Homeostasis Requires Balanced CSF-1/CSF-2 Receptor Signaling

Violeta Chitu et al. Cell Rep. .

Abstract

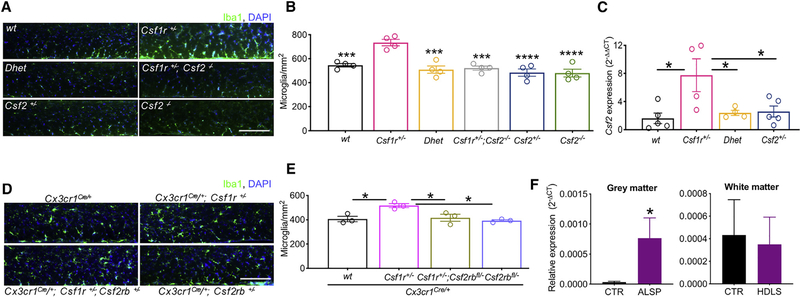
CSF-1R haploinsufficiency causes adult-onset leukoencephalopathy with axonal spheroids and pigmented glia (ALSP). Previous studies in the Csf1r+/- mouse model of ALSP hypothesized a central role of elevated cerebral Csf2 expression. Here, we show that monoallelic deletion of Csf2 rescues most behavioral deficits and histopathological changes in Csf1r+/- mice by preventing microgliosis and eliminating most microglial transcriptomic alterations, including those indicative of oxidative stress and demyelination. We also show elevation of Csf2 transcripts and of several CSF-2 downstream targets in the brains of ALSP patients, demonstrating that the mechanisms identified in the mouse model are functional in humans. Our data provide insights into the mechanisms underlying ALSP. Because increased CSF2 levels and decreased microglial Csf1r expression have also been reported in Alzheimer's disease and multiple sclerosis, we suggest that the unbalanced CSF-1R/CSF-2 signaling we describe in the present study may contribute to the pathogenesis of other neurodegenerative conditions.

Keywords: ALSP; CSF-1R; GM-CSF; demyelination; leukodystrophy; microglia; neurodegeneration.


Conflict of interest statement

Declaration of Interests The authors declare no competing interests.

Figures

Figure 1.
Figure 1.. Involvement of CSF-2 in the Pathology of ALSP
(A) Microglial densities in the corpus callosum of 4- to 5-month-old mice. (B) Quantification of microglial densities. Two-way ANOVA followed by Dunnett’s post hoc test. (C) Restoration of normal Csf2 expression in 3- to 4-month-old Csf1r+/− mice by monallelic targeting of Csf2. One-way ANOVA followed by Tukey’s multiple comparisons test. (D and E) Evidence of direct regulation of the increase of Iba1+ cell density by Csf2. Microglial densities (D) and quantification (E). Data ± SEM, 3-month-old mice, one-way ANOVA followed by Tukey’s multiple comparisons test. (F) Expression of CSF2 in the periventricular white matter and adjacent gray matter of ALSP patients and healthy controls, determined by real-time qPCR and normalized to RPL13. n = 5 control or ALSP specimens; *p < 0.05, one- tailed Student’s t test. Scale bars, 100 μm, applies to all panels in the corresponding composite image. Data are presented as means ± SEM, and only the significantly different changes are marked by asterisks. See also Figure S1 and Tables S1 and S9.
Figure 2.
Figure 2.. Deletion of a Single Csf2 Allele Prevents the Cognitive Deficit and Depression in ALSP (Csf1r+/−) Mice
(A–D) Cognitive assessment. The test performed, age of the mice, and retention interval (RI) are indicated in each panel. The number of mice per genotype in each experiment is shown in the bars in the left panel. (A) Left (training): preference for the left side by Csf1r+/− mice exploring two familiar identical objects. Right (testing): Csf1r+/− mice spent less time exploring the novel object (left side). (B) Left: similar exploration of the arms of the Y-maze in all experimental groups. Right: lower discrimination for the novel arm by Csf1r+/− mice is corrected in Csf1r+/−; Csf2+/− (Dhet) mice. (C) Left: all experimental groups exhibited similar times of exploration of either object. Right: lower preference for the displaced object by Csf1r+/− mice is corrected in Dhet mice. (D) Left (training): all experimental groups exhibited similar times of exploration of two familiar identical objects. Right (testing): reduced long-term memory for the novel object by Csf1r+/− mice was corrected in Dhet mice. (E) Increased depression-like behavior in male Csf1r+/− mice is corrected in Dhet mice. Data were analyzed using two-way ANOVA followed by Bonferroni’s (A–C); Holm-Sidak’s (D); or Benjamini, Krieger, and Yekutieli’s (E) post hoc tests. The left panel in (B) was analyzed by one-way ANOVA (not significant). Data are presented as means ± SEM. See also Figure S2 and Table S9.
Figure 3.
Figure 3.. Attenuation of the Olfactory and Motor Coordination Deficits of Csf1r+/− Mice by Csf2 Heterozygosity
(A) Odor discrimination at 7 months of age. Csf1r+/− mice showed no significant increase in exploring the pure odorant vanilla. (B) Odor threshold to the pure odorant 2-phenylethanol by 11.5-month-old mice. Absence of a significant threshold in Csf1r+/− mice is corrected in Dhet mice. (C) Locomotor coordination in mice, assessed as number of slips in the balance beam test. (D) Ataxia score in mice, assessed as sum of the ledge, hindlimb, and gait scores. Data were analyzed using two-way ANOVA followed by Bonferroni’s (A) and Dunnett’s (B) post hoc tests or by Kruskal-Wallis test followed by Dunn’s post hoc tests (C and D). Data are presented as means ± SEM. See also Figure S2 and Table S9.
Figure 4.
Figure 4.. Csf2 Heterozygosity Prevents Cerebral Microgliosis in Aged ALSP Mice
(A) Iba1+ cell densities (green) in different areas of brains of 18-month-old mice. Cb, cerebellum; CC, corpus callosum; Cb WM, cerebellar white matter; Cx, primary motor cortex; DCN, deep cerebellar nuclei; Hp, hippocampus; OB, olfactory bulb. (B) Quantification of Iba1+ cell densities. (C) Morphology of Iba1+ cells. The dotted line indicates the border between the CC and the adjacent gray matter. (D and E) Quantification of microglia ramification in the white (D) and gray (E) matter regions shown in (C). (F) Quantification of microglia and infiltrating leukocytes by flow cytometry. μG, microglia; AμG, activated microglia; BLΦ, B lymphocytes; G+μG, Ly6G+ P2ry12high microglia; Gr, Ly6G+P2ry12 granulocytes; MΦ/DC, Ly6C macrophages/dendritic cells; Mo, Ly6C+ infiltrated monocytes; NK, natural killer cells; TCD4 and TCD8, CD4 and CD8+ T lymphocytes; Tγδ, γδ T cells. Data were obtained from 16-month-old WT (n = 4) and Csf1r+/− (n = 5) mice. (G) Colocalization of P2ry12 (red) with Iba1+ cells (green). (H) Quantification of P2ry12 expression in Iba1+ cells in WT and Csf1r+/− mice; 5 mice/genotype. (I) Expression of Cx3Cr1 (GFP, green) and Ccr2 (RFP, red) reporters in 11-month-old Cx3Cr1GFP/+;Ccr2RFP/+;Csf1r+/+ (+/+) and Cx3Cr1GFP/+;Ccr2RFP/+;Csf1r+/− (+/−) mice. (J) Quantification of mononuclear phagocytes in Cx3Cr1GFP/+;Ccr2RFP/+ reporter mice (5 mice/genotype). Significance was analyzed using two-way ANOVA (B, F, H, and J) or one-way ANOVA (D and E), followed by Benjamini Krieger and Yekutieli post hoc analyses. Data are presented as means ± SEM. Scale bars, 100 μm, apply to all panels in the corresponding composite image. Minor irregularities in (A) images Csf2+/ Cx and Csf1r+/ CC, (G) images Csf1r+/ Hp and WT Cb, and (I) WT and Csf1r+/ Cb images arise from automated image stitching in Photoshop. See also Figures S3 and S4 and Table S9.
Figure 5.
Figure 5.. Csf2 Heterozygosity Restores the Csf1r+/− Microglial Transcriptomics Profile
(A) Differences in gene expression profile in Csf1r+/−, Csf2+/−, and Dhet microglia compared with WT controls. (B) Volcano plot highlighting DEGs of interest in Csf1r+/− microglia. (C) Validation of changes in expression of selected upregulated (top panel) and downregulated (lower panel) genes in microglia isolated from 4 WT, 5 Csf1r+/−, 5 Dhet, and 4 Csf2+/− mice. Two-way ANOVA followed by Dunnett’s post hoc test. (D) Expression of Cystatin F in the CC of WT, single heterozygous, and Dhet mice. Scale bar, 100 μm, applies to all panels. N = 5 mice/genotype, one-way ANOVA followed by Tukey’s post hoc test; n.s., not significant (p = 0.33). (E and F) Ingenuity Pathway Analysis (IPA)-generated list of pathways (E) and biological processes (F) affected by Csf1r heterozygosity and their predicted activation status in Csf2+/− and Dhet microglia. Dots indicate no significant difference. (G) Heatmap showing the expression of Csf1r+/− DEGs across individual samples. (H) Illustration of the overlap of Csf1r+/− DEGs with genes differentially expressed in other mouse models of neurodegenerative disease. Note decreased Csf1r expression in a model of Alzheimer’s disease (AD) (APPswe/PS1dEp) and in disease-associated microglia (DAMs-AD, DAMs-ALS). The Csf1r targeting strategy (Dai et al., 2002) does not affect transcription, precluding confident detection of decreased Csf1r expression in Csf1r+/− microglia using RNA sequencing (RNA-seq) (log2FC = −1.15, p = 0.01, adjusted p = 0.1). Data are presented as means ± SEM. See also Figure S5 and Tables S2, S3, and S4–S10.
Figure 6.
Figure 6.. Pathways Dysregulated in Csf1r+/− Mice and ALSP Patients
(A and B) Predicted maladaptive functions (A) and hypothetical pathways (B) dysregulated in Csf1r+/− mouse microglia. (C) Evidence of oxidative stress: colocalization of the poly (ADP-ribose) signal with callosal microglial patches in periventricular white matter. Scale bar, 100 μm, applies to all panels. (D) Quantification of the callosal area positive for poly (ADP-Ribose) in 2–3 sections/mouse, 5–9 mice/genotype. One-way ANOVA followed by Kruskal-Wallis test. (E) Transcriptomics changes potentially critical for pathology also occur in the periventricular white matter of ALSP patients (n = 5); *p < 0.05, one- tailed Student’s t test. Data are presented as means ± SEM. See also Tables S9 and S10.
Figure 7.
Figure 7.. Csf2 Heterozygosity in ALSP Mice Prevents Callosal Atrophy and Improves Myelination
(A) Myelin and axonal ultrastructure in callosal cross-sections from 9- to 11-month-old mice. Arrows point to examples of changes in myelin thickness in axons of small and medium diameters. (B–E) Changes in G-ratio in Csf1r+/− (B and C) and Csf2+/− (B and E) mice are attenuated by double heterozygosity (B and D). (B) shows average values per mouse (2–6 mice/genotype); values in the bars indicate the total numbers of fibers examined in each fiber diameter range. (C)–(E) show individual G-ratio values. (F) Quantification of MBP staining in white matter tracts, including CC, fimbria (Fb), and Cb. n = 3–7 mice/genotype. (G) Changes in myelination are not accompanied by a decrease in early oligodendrocyte precursors (PDGFRα+) or oligodendrocytes (CC1+). (H) Quantification of age-induced myelin pathology in WT and mutant mice (2–7 mice/genotype, >900 neurons/genotype). The top panels show representative examples of structural abnormalities. (I) Quantification of age-induced axonal pathology in WT and mutant mice (data from 3–6 mice/genotype, >900 neurons/genotype). The top panels show representative examples of structural abnormalities. (J) Neuronal loss in cortical layer V at 18 months of age. Scale bar, 100 μm. (K) Average NeuN-positive cells per layer. n = 4 mice/genotype. (L) Csf2 heterozygosity prevents callosal atrophy in 19-month-old Csf1r+/− mice. Significance was analyzed using two-way ANOVA followed by Holm-Sidak’s (B, F, and K) or Benjamini, Krieger, and Yekutieli’s (H and I) post hoc tests and one-way ANOVA followed by Tukey’s post hoc test (H and L). Scale bars, 1 μm (A), 50 μm (F), 100 μm (G and J), and 500 nm (H and I); apply to all images in the corresponding panels. Data are presented as means ± SEM. See also Table S9.

Similar articles

Cited by

References

    1. Achuthan A, Cook AD, Lee MC, Saleh R, Khiew HW, Chang MW, Louis C, Fleetwood AJ, Lacey DC, Christensen AD, et al. (2016). Granulocyte macrophage colony-stimulating factor induces CCL17 production via IRF4 to mediate inflammation. J. Clin. Invest 126, 3453–3466. - PMC - PubMed
    1. Andero R, Daniel S, Guo JD, Bruner RC, Seth S, Marvar PJ, Rainnie D, and Ressler KJ (2016). Amygdala-Dependent Molecular Mechanisms of the Tac2 Pathway in Fear Learning. Neuropsychopharmacology 41, 2714–2722. - PMC - PubMed
    1. Baldwin GC, Benveniste EN, Chung GY, Gasson JC, and Golde DW (1993). Identification and characterization of a high-affinity granulocyte-macrophage colony-stimulating factor receptor on primary rat oligodendrocytes. Blood 82, 3279–3282. - PubMed
    1. Bennett ML, Bennett FC, Liddelow SA, Ajami B, Zamanian JL, Fernhoff NB, Mulinyawe SB, Bohlen CJ, Adil A, Tucker A, et al. (2016). New tools for studying microglia in the mouse and human CNS. Proc. Natl. Acad. Sci. USA 113, E1738–E1746. - PMC - PubMed
    1. Berrebi D, Bruscoli S, Cohen N, Foussat A, Migliorati G, Bouchet-Delbos L, Maillot MC, Portier A, Couderc J, Galanaud P, et al. (2003). Synthesis of glucocorticoid-induced leucine zipper (GILZ) by macrophages: an anti-inflammatory and immunosuppressive mechanism shared by glucocorticoids and IL-10. Blood 101, 729–738. - PubMed

Publication types

MeSH terms

Substances