. 2020 Mar 3;30(9):3020-3035.e3.
doi: 10.1016/j.celrep.2020.02.009.

Microcircuit Rules Governing Impact of Single Interneurons on Purkinje Cell Output In Vivo

Affiliations

Microcircuit Rules Governing Impact of Single Interneurons on Purkinje Cell Output In Vivo

Charlotte Arlt et al. Cell Rep. .

Abstract

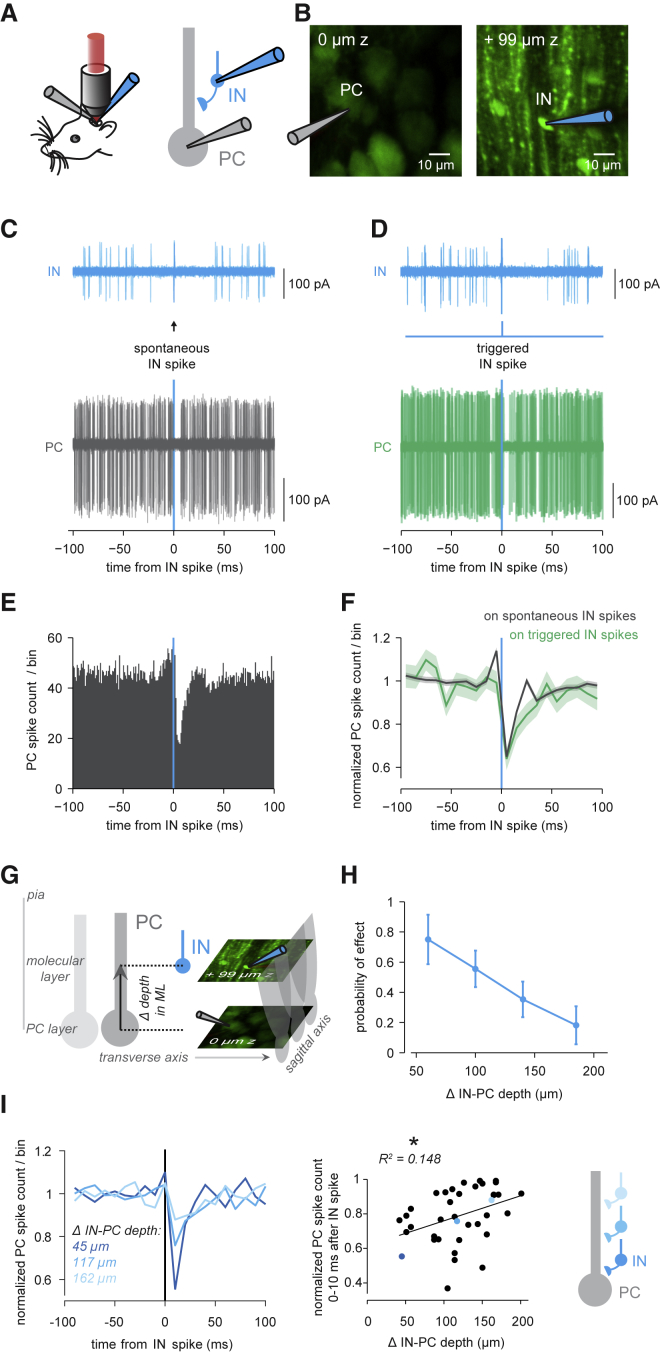
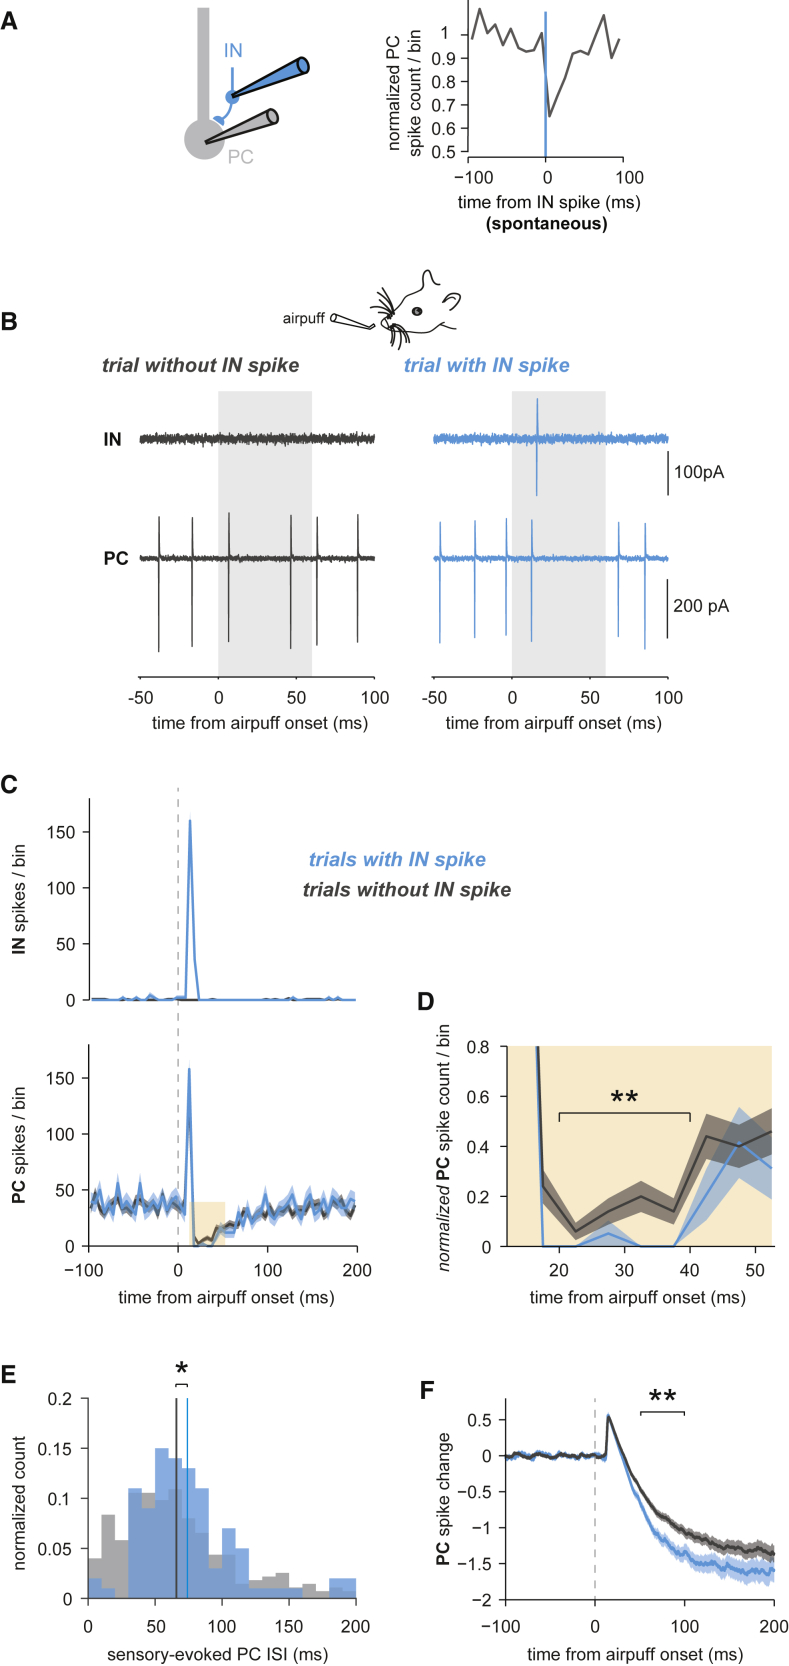
The functional impact of single interneurons on neuronal output in vivo and how interneurons are recruited by physiological activity patterns remain poorly understood. In the cerebellar cortex, molecular layer interneurons and their targets, Purkinje cells, receive excitatory inputs from granule cells and climbing fibers. Using dual patch-clamp recordings from interneurons and Purkinje cells in vivo, we probe the spatiotemporal interactions between these circuit elements. We show that single interneuron spikes can potently inhibit Purkinje cell output, depending on interneuron location. Climbing fiber input activates many interneurons via glutamate spillover but results in inhibition of those interneurons that inhibit the same Purkinje cell receiving the climbing fiber input, forming a disinhibitory motif. These interneuron circuits are engaged during sensory processing, creating diverse pathway-specific response functions. These findings demonstrate how the powerful effect of single interneurons on Purkinje cell output can be sculpted by various interneuron circuit motifs to diversify cerebellar computations.

Keywords: Purkinje cell; cerebellum; climbing fiber; glutamate spillover; in vivo; inhibition; interneuron; patch clamp; synaptic integration; two-photon imaging.


Conflict of interest statement

Declaration of Interests The authors declare no competing interests.

Figures

None
Graphical abstract
Figure 1
Figure 1
Single IN Spikes Inhibit PC Spiking In Vivo (A) Left: dual two-photon targeted patch-clamp recordings from INs and PCs in vivo. Right: schematic of paired recording configuration. (B) Two-photon average intensity projections showing a dual PC (left) and IN (right) cell-attached recording configuration. (C) IN trace triggered on 20 consecutive spontaneous IN spikes, traces overlaid; below, corresponding overlaid traces of simultaneous PC recording (complex spikes removed). IN spikes before or after time point 0 ms were used to align PC activity in previous or consecutive trials, respectively. PC pauses were not present after IN spikes before or after the 0 ms time point because previous or following IN spikes were irregularly timed. (D) IN spikes directly triggered by a brief (0.2 ms) voltage pulse via the patch pipette. Below: corresponding overlaid PC traces. (E) PC simple spike histogram aligned to spontaneous IN spikes (bin size = 1 ms). (F) Normalized PC spike probability/bin aligned to spontaneous (gray) and triggered (green) IN spikes (bin size = 10 ms). Shadings denote ±SEM. (B)–(F) are from the same dual recording. (G) Illustration of intersomatic Euclidean IN-PC distance in the transverse plane and sagittal plane and as the Δ depth in the molecular layer (ML). The center of the PC soma denotes a 0 μm distance. (H) Fraction of pairs with significant (PC Z score < −3) IN-PC inhibition across ML depth IN-PC distance. Error bars show SD based on bootstrap analysis. (I) Left: baseline-normalized PC spike counts/bin for 3 example pairs with the IN soma positioned deep (dark blue), intermediate (blue), and superficial (light blue) in ML. Middle: for IN-PC pairs within the 30 μm intersomatic transverse distance, the ML depth IN-PC distance is plotted versus the normalized PC spike count in the 0–10 ms bin after the IN spike. The black line indicates the linear regression line, p = 0.017. Colors indicate the pairs shown on the left. Right: schematic of IN-PC inhibition graded by IN depth in ML.
Figure 2
Figure 2
Interneurons Inhibit Each Other with a Top to Bottom Organization in the Molecular Layer (A) Left: two-photon average intensity projection showing a dual IN-IN cell-attached recording. Middle: spontaneous activity of the IN-IN pair. Right: average IN2 spike count/bin aligned to IN1 spikes (bin size = 5 ms). (B) Cross-correlograms of 8 IN-IN pairs with significant unidirectional spike probability decreases, dark blue: average. The trigger, presumed to be presynaptic IN, was denoted as IN1, and the target was denoted as IN2. Middle: schematic illustrating the measurement of IN-IN distance in the molecular layer (ML) as normalized ML positions. Right: ML positions of trigger INs and target INs (mean + SD, p = 0.02, Wilcoxon signed-rank test). (C) Left: cross-correlogram of another IN-IN pair (5 ms bin size) exhibiting precise synchrony. Right: higher temporal resolution (bin size = 0.5 ms) version of cross-correlogram on left, showing two peaks at ±1 ms lag. Purple shading indicates the temporal window shown at a higher resolution. (D) Across all IN-IN pairs, distribution of fraction of synchronized spikes (spikes within ±5 ms of the spike in the other IN) per IN pair. The dotted black line shows the distribution median.
Figure 3
Figure 3
CF Input Activates Many INs but Inhibits INs Deeper in the Molecular Layer (A) Left: schematic of the recording configuration. Right: Z scores of IN spikes aligned to PC complex spikes (color axis clipped at Z score = ±10 for better visualization, bin size = 10 ms). Pairs were sorted by minimal Z score in 0–10 ms bin. (B) Top: raw overlaid PC traces aligned to 50 consecutive complex spikes. Overlays of raw traces always show a small subset of all traces for better illustration. The colored bar on the top left indicates the identity of the cross-correlogram in the overview in (A), right. Second row: corresponding overlaid IN traces aligned to 150 additional complex spikes. Third row: IN histogram aligned to complex spikes (bin size = 5 ms, left y axis), and Z scores of IN spike count/bin aligned to complex spikes (bin size = 10 ms, right y axis). (C) Analogous to (B), but for another recording. Overlaid PC and IN traces aligned to 76 consecutive complex spikes. (D) Another dual recording. Overlaid IN traces aligned to 60 consecutive complex spikes. (E) Left: schematic illustrating the measurement of the IN-PC depth distance in the molecular layer (ML). Prevalence of pure CF-IN excitation (red, n = 13) and pure CF-IN inhibition (blue, n = 8) across the IN-PC ML depth distance. Error bars show SD based on bootstrap analysis. Right: IN-PC depth distance in INs with CF-IN inhibition, INs with CF-IN excitation, and those with no significant CF-IN effect (mean + SD, p = 0.038 (CF-IN- versus CF-IN+), p = 0.008 (CF-IN- versus no CF-IN effect), p = 0.976 (CF-IN+ versus no CF-IN effect), Kruskal-Wallis plus multiple comparisons test). (F) Schematic illustrating CF-IN excitation and delayed CF-IN inhibition in a deeper IN via directional IN-IN inhibition.
Figure 4
Figure 4
CF Input Inhibits Those INs with an Impact on PC Spiking (A) Schematics of possible CF-IN-PC motifs. Left: CF-IN-PC feed-forward inhibition circuit; i.e., CF-IN excitation (CF-IN+) co-occurring with IN-PC inhibition in the same IN-PC pairs. Right: schematic of a CF-IN-PC feed-forward disinhibition motif; i.e., CF-IN inhibition (CF-IN−) co-occurring with IN-PC inhibition. (B) Normalized mean IN spike counts/bin aligned to complex spikes. Pairs are grouped based on IN responses to CF input: significant excitation (red), inhibition (blue), or no response (gray). (C) Left: normalized PC spike counts/bin aligned to IN spikes, same grouping as in (B). Shadings denote ±SEM. Right: normalized PC spike count in the 0–10 ms bin after the IN spike in CF-IN− pairs and CF-IN+ pairs (mean + SD, p = 0.018, Wilcoxon rank-sum test). (D) Absolute probabilities of observing significant IN-PC inhibition (gray stripes), CF-IN+ (red), and CF-IN− (blue), and conditional probabilities of observing IN-PC inhibition given CF-IN+ or CF-IN− in a given IN-PC pair. The occurrence of IN-PC inhibition and CF-IN+ in a given pair was independent of one another (p = 0.13), whereas the association between IN-PC inhibition and CF-IN− was significant (p = 0.01, two-tailed Fisher’s exact tests). (E) Diagram of the resulting microcircuit motif.
Figure 5
Figure 5
Millisecond Recruitment of IN-PC Inhibition by Sensory Stimulation (A) Example of a single trial of simultaneously recorded IN and PC responses to an airpuff directed at the ipsilateral whisker pad. Left: recording of IN (top) and PC (bottom) activity. Gray rectangle indicates airpuff duration. Black circles indicate PC complex spikes. Middle: same as left but showing 40 consecutive trials overlaid. Right: PSTHs (peri-stimulus time histograms) of IN spikes (top), PC simple spikes (middle), and PC complex spikes (bottom). Bin size = 5 ms. (B) Same as (A, right) but for another IN-PC pair. (C) Mean spike changes across all IN-PC pairs, i.e., mean number of delta spikes per stimulus, for IN spikes (blue), PC simple spikes (gray), and PC complex spikes (black). Shadings denote ±SEM. (D) Left: mean distributions of latencies from stimulus onset to first spike for IN spikes, PC simple spikes and complex spikes across all IN-PC pairs. Bin size = 2 ms. Inset: bin size = 0.5 ms. Shadings denote ±SEM. Right: PC response latencies plotted versus IN response latencies. Values are maxima of response latency distributions (bin size = 0.5 ms). (E) Left: IN-PC pairs were grouped into connected (blue, n = 6) and unconnected (gray, n = 4) pairs based on baseline-normalized PC spike counts/bin after spontaneous IN spikes. Right: for the same groups, mean baseline-normalized PC spike counts/bin aligned to IN spikes recruited by rapid granule-cell input, i.e., within 20 ms of stimulus onset. Trials with sensory-evoked complex spikes were removed. Shadings denote ±SEM. Bin size = 5 ms. (F) Amplitudes of spontaneous and sensory-evoked IN-PC inhibition plotted against each other for each connected pair. Amplitudes are measured as mean baseline-normalized PC spike counts/bin 5–10 ms post-IN spike. The dotted line represents the unity line.
Figure 6
Figure 6
The Contribution of Single INs to Sensory-Evoked Feedforward Inhibition (A) Left: recording configuration. Right: Mean PC spike counts aligned to spontaneous IN spikes indicating IN-PC inhibition. (B) In the same IN-PC pair as shown in (A), sensory stimulation trials were categorized into trials without (gray) and trials with (blue) sensory-evoked rapid IN spikes. Single trials are shown. (C) PSTHs of IN spikes (top panel) and of PC simple spikes (bottom panel) for the two categories defined in (B). Trials with sensory-evoked complex spikes were removed. Shadings denote ±SEM. (D) Zoom-in on the bottom plot in (C) as indicated by the orange shading. Brackets indicate the temporal window in which the significance of difference in PC inhibition with and without sensory responses in the simultaneously recorded IN was assessed (20–40 ms postairpuff onset, p = 0.0037, Wilcoxon rank-sum test). (E) Distributions of PC ISIs around the mean time point of sensory-evoked IN responses for the same categories as in (B) and (C). Bin size = 10 ms. Vertical lines indicate distribution means (p = 0.015, Wilcoxon rank-sum test). (F) PC spike changes corresponding to same categories as in (B)–(D). Brackets indicate the time window in which the significance of difference between PC spike changes with and without sensory-evoked IN spikes was assessed (50–100 ms postairpuff onset, p = 0.0021, Wilcoxon rank-sum test). Shadings denote ±SEM.
Figure 7
Figure 7
The Recruitment of INs during Sensory Processing Is Pathway-Specific and Spatially Organized by IN Depth in the Molecular Layer (A) Left: diagram of the relevant microcircuit. Red: INs with excitation after spontaneous CF input (CF-IN+, n = 5), blue: INs with inhibition (CF-IN−, n = 3). Right: normalized mean IN spike counts/bin aligned to spontaneous PC complex spikes are used for IN grouping. Shadings denote ±SEM. (B) Left: mean IN spike changes after an airpuff for the same IN groups as in (A). Right: comparison of maximum IN spike change within 20 ms after airpuff onset for the CF-IN+ and CF-IN− group (mean + SD, p = 0.036, Wilcoxon rank-sum test). (C) Left: example of airpuff-evoked mean spike changes in a single IN (CF-IN+ type) for trials with simultaneously recorded sensory-evoked PC complex spikes (black/dark red) and trials without (gray/light red). Note the larger secondary IN response in trials with local PC complex spikes. Right: same as left, but for another recording with IN inhibition after spontaneous CF input (CF-IN− type). Note the absence of delayed secondary sensory responses. Shadings denote ±SEM. (D) Differences of IN spike changes 0–140 ms from airpuff onset between trials with and trials without local PC complex spikes for same IN groups as in (A) and (B) (mean + SD, p = 0.036, Wilcoxon rank-sum test). (E) Left: individual (blue) and mean (black) IN sensory-evoked spike changes (n = 26 INs). IN spike changes were separated into a fast component (0–20 ms from airpuff onset, purple) and a delayed component (50–120 ms from airpuff onset, orange). Middle: amplitude of fast IN spike change plotted versus IN depth in the molecular layer. Black line: linear regression line, p = 0.003. Right: amplitude of delayed IN spike change (difference between delayed and fast amplitude) plotted versus IN molecular-layer position. Black line: regression line, p = 0.107. (F) Summary diagrams of IN microcircuit principles organized by IN depth in the molecular layer.

Similar articles

Cited by

References

    1. Albus J.S. A theory of cerebellar function. Math. Biosci. 1971;10:25–61.
    1. Armstrong D.M., Rawson J.A. Activity patterns of cerebellar cortical neurones and climbing fibre afferents in the awake cat. J. Physiol. 1979;289:425–448. - PMC - PubMed
    1. Asztely F., Erdemli G., Kullmann D.M. Extrasynaptic glutamate spillover in the hippocampus: dependence on temperature and the role of active glutamate uptake. Neuron. 1997;18:281–293. - PubMed
    1. Auger C., Attwell D. Fast removal of synaptic glutamate by postsynaptic transporters. Neuron. 2000;28:547–558. - PubMed
    1. Badura A., Schonewille M., Voges K., Galliano E., Renier N., Gao Z., Witter L., Hoebeek F.E., Chédotal A., De Zeeuw C.I. Climbing fiber input shapes reciprocity of Purkinje cell firing. Neuron. 2013;78:700–713. - PubMed

Publication types

LinkOut - more resources