. 2020 Mar 3;30(9):3051-3066.e7.
doi: 10.1016/j.celrep.2020.02.030.

Single-Cell Analysis of Foxp1-Driven Mechanisms Essential for Striatal Development

Affiliations

Single-Cell Analysis of Foxp1-Driven Mechanisms Essential for Striatal Development

Ashley G Anderson et al. Cell Rep. .

Abstract

The striatum is a critical forebrain structure integrating cognitive, sensory, and motor information from diverse brain regions into meaningful behavioral output. However, the transcriptional mechanisms underlying striatal development at single-cell resolution remain unknown. Using single-cell RNA sequencing (RNA-seq), we examine the cellular diversity of the early postnatal striatum and show that Foxp1, a transcription factor strongly linked to autism and intellectual disability, regulates the cellular composition, neurochemical architecture, and connectivity of the striatum in a cell-type-dependent fashion. We also identify Foxp1-regulated target genes within distinct cell types and connect these molecular changes to functional and behavioral deficits relevant to phenotypes described in patients with FOXP1 loss-of-function mutations. Using this approach, we could also examine the non-cell-autonomous effects produced by disrupting one cell type and the molecular compensation that occurs in other populations. These data reveal the cell-type-specific transcriptional mechanisms regulated by Foxp1 that underlie distinct features of striatal circuitry.

Keywords: FOXP1; autism; neurodevelopment; single-cell RNA sequencing; striatum.


Conflict of interest statement

Declaration of Interests The authors declare no competing interests.

Figures
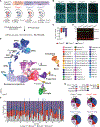
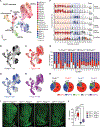
Figure 1.
Figure 1.. Early Postnatal scRNA-Seq of Striatal Cells across Foxp1 cKOs
(A) Schematic of the scRNA-seq experiment using striatal tissue from P9 mice (n = 4/genotype) with cell-type-specific conditional deletion of Foxp1 within the dopamine receptor 1 (Foxp1D1), dopamine receptor 2 (Foxp1D2), or both (Foxp1DD) cell types. (B–D) Foxp1 is reduced in the striatum via immunohistochemistry (P7 and P56) (B) and quantitative RT-PCR (P7) (C) within each cKO line, with near-complete reduction in Foxp1DD striatal tissue via immunoblot (P7) (D) (scale bar, 100 μm). (E) Non-linear dimensionality reduction with UMAP of all 62,778 post-filtered cells combined across genotype and used for downstream analyses. Cell-type annotation is overlaid to identify the major cell type represented by each cluster (43 total clusters). (F) Stacked bar plots of the contribution of cells from each genotype to each cluster, with arrows indicating genotype-driven changes within SPN (blue arrow) orneurogenic progenitor (purple arrow) clusters. (G) Pie charts using colors from (E) show the striatal cell-type composition as a percentage of total cells within each genotype. See also Figures S1 and S2 and Tables S1 and S2.
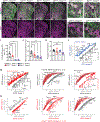
Figure 2.
Figure 2.. Foxp1 Specifies Distinct SPN Subpopulations
(A) UMAP plot showing each neuronal subcluster by color with overlay showing neuronal subpopulation identity. (B–E) UMAP plots of cells from (A) color-coded to identify each cell by genotype. (F) Violin plots of the normalized UMI expression of markers of SPN subpopulations: dSPNs (Drd1, Tac1, and Foxp2), iSPNs (Drd2 and Penk), ddSPNs (Drd2, Drd1, and Tac1), eSPNs (Casz1), and imSPNs (Sox4). (G) Stacked bar plots of the contribution of cells from each genotype to each cluster. Cluster numbers in red indicate dSPNs, blue indicate iSPNs, and italicizednumbers indicate Foxp1 cKO driven SPN clusters. (H) Pie charts showing altered composition of SPN subtypes within Foxp1 cKO mice (using colors from A). (I and J) Foxp1 cKO mice were crossed to D2eGFP reporter lines to label dopamine receptor 2 (D2) iSPNs in green (coronal section, scale bar, 500 μm) (I). Foxp1D2 and Foxp1DD mice had significantly fewer iSPNs compared to Foxp1CTL mice at P7, while Foxp1DD mice had significantly more iSPNs compared to Foxp1D2 animals. Data are represented as a boxplot (J); n = 3–6 mice/genotype; ****p <0.0001 and *** p <0.005, one-way ANOVA with Tukey’s multiple comparisons test. See also Figure S3 and Tables S1 and S2.
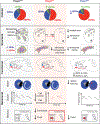
Figure 3.
Figure 3.. Foxp1 Regulates Striosome-Matrix Organization
(A–H) Immunohistochemistry for mu-opiod receptor (MOR) in P7 striatal sections from Foxp1CTL (A, E), Foxp1D1 (B, F), Foxp1D2 (C, G) and Foxp1DD (D, H) mice crossed to D2-eGFP reporter mice to label D2+ (EGFP) cells (scale bars represent 500 μm in A–D and 100 μm in E–H). (E–H) Zoomed in images of white-dashed squares in (A)-(D). (I) Quantification of the number of D2+ cells in striosomes (MOR+) relative to the total number of D2+ cells across control and Foxp1 cKO mice. Data are represented as mean ± SEM; n = 5–9 slices/2 mice/genotype; ***p < 0.0001, one-way ANOVA with Dunnett’s multiple comparisons test. (J and K) The striosome compartment was significantly reduced across all Foxp1 cKO mice as a percent of total striatal area (measuring only dorsal striosomes) (J), and the number of striosome “patches” was significantly reduced in Foxp1DD animals (K). Data are represented as mean ± SEM; n = 9 slices/3 mice/genotype; *p < 0.05, p** < 0.005, and ***p <0.0001, one-way ANOVA with Dunnett’s multiple comparisons test. (L) Scatterplots showing the percent expression of enriched transcripts between Foxp1CTL iSPN cluster 2 versus cluster 8. (M) Scatterplots showing pairwise comparison of percent expression of enriched transcripts between Foxp1CTL dSPN clusters (cluster 0 versus cluster 5, cluster 0 versus cluster 9, and cluster 5 versus cluster 9). (N) Scatterplots showing pairwise comparison of percent expression of enriched transcripts between Foxp1D1 dSPN clusters (cluster 1 versus cluster 3, cluster 1 versus cluster 4, cluster 3 versus cluster 4). Striosome and matrix markers are indicated within each scatterplot (p.adj < 0.05, percent expression > 0.2). See also Figure S4 and Table S3.
Figure 4.
Figure 4.. Foxp1 Regulates Cell-Type-Specific Molecular Pathways
(A and B) SPN cell-type-specific differential gene expression between genotypes. Upset plot showing the overlap of upregulated or downregulated DEGs across genotypes within iSPNs (A) or dSPNs (B). Genes shown within boxes are color-coded by categories indicated. (C) No significant difference between the number of DEGs within iSPNs and dSPNs that are cell-autonomous versus non-cell-autonomous (p = 0.0975, two-sidedFisher’s exact test). (D) There is a significant difference in the number of DEGs within Foxp1DD mice that overlap with Foxp1D2 or Foxp1D1 DEGs to specific Foxp1DD DEGs (interaction DEGs) (p < 0.0001, two-sided Fisher’s exact test). (E and F) Enrichment of ASD-risk genes SFARI score 1–4 with upregulated or downregulated iSPN-DEGs (E) blue) or dSPN-DEGs (F), red) across Foxp1 cKO samples using a hypergeometric overlap test (8,000 genes used as background). (G and H) Enrichment of upregulated or downregulated iSPN-DEGs (G) or dSPN-DEGs (H) across Foxp1 cKO samples in distinct SPN subtypes (top 50 most enriched genes/cluster) using a hypergeometric overlap test (8,000 genes used as background). See also Figure S5 and Tables S4 and S5.
Figure 5.
Figure 5.. Deletion of Foxp1 in iSPNs Alters Projection Patterns of Both dSPNs and iSPNs
(A–C) Representative Tissuecyte 1000 coronal sections (top panels) and 3D image of probability map projected onto reference brain (gray) (bottom panels) showing the projections of dSPNs and iSPNs using D1tdTom and D2eGFP reporter mice, respectively, crossed to Foxp1CTL (A), Foxp1D1 (B), or Foxp1D2(C). (D) Quantification of the normalized probability maps of iSPN (EGFP) projections within Foxp1CTL, Foxp1D1, and Foxp1D2 mice showing reduced GPe projections from iSPNs within Foxp1D2 mice. No significant changes were seen in projection patterns onto the SNc or SNr. Data are represented as mean ± SEM; n = 3–4 mice/genotype; ***p <0.0001, two-way ANOVA with Dunnett’s multiple comparisons test. (E) Quantification of the normalized probability maps of dSPN (tdTomato) projections within Foxp1CTL, Foxp1D1, and Foxp1D2 mice showing reduced GPi projections from dSPNs within Foxp1D2 mice. Data are represented as mean ± SEM; n = 2–4 mice/genotype; **p <0.01, two-way ANOVA with Dunnett’s multiple comparisons test. (F) Striatal area quantification of four serial slices from anterior to posterior at 400-μm increments within Foxp1CTL, Foxp1D1, and Foxp1D2 adult mice. Data are represented as mean ± SEM; n = 3–4 mice/genotype; ***p <0.001, one-way ANOVA with Dunnett’s multiple comparisons test. (G) Schematic of cell-autonomous and non-cell-autonomous projection deficits found to the GPe and GPi in Foxp1D2 animals. (H) Overlap of dSPN-DEGs within Foxp1D1 or Foxp1D2 cells. Foxp1D2 dSPN-DEGs that are involved in neuron projection are shown, with ASD-risk genes highlighted in purple. GPe, globus pallidus external; GPi, globus pallidus internal; SNc, substantia nigra pars compacta; SNr, substantia nigra pars reticulata; STR, striatum.
Figure 6.
Figure 6.. Foxp1 Regulates Behaviors via Distinct Striatal Circuits
(A) Latency to fall was measured on the accelerating rotarod. Foxp1D2 and Foxp1DD mice exhibit significant deficits. Data are represented as mean ± SEM, n = 11 Foxp1CTL; n = 17 Foxp1D1; n = 18 Foxp1D2; n = 12 Foxp1DD; *p < 0.05, **p < 0.005, and ***p < 0.0001, two-way ANOVA with Sidak’s multiple comparisons test. (B and C) Mice were tested within the open field paradigm with velocity (B) and percent time spent in the periphery versus center (C) plotted. Foxp1D2 and Foxp1DD mice had significant increase in activity with no difference in percent time spent in the periphery and center. Data are represented as mean ± SEM; n = 22 Foxp1CTL; n = 14 Foxp1D1; n = 17 Foxp1D2; n = 4 Foxp1DD; ***p <0.0001, one-way ANOVA with Sidak’s multiple comparisons test. (D–F) Neonatal isolation vocalizations were measured at P4, P7, and P10. (D) The number of isolation calls were significantly reduced in Foxp1D1 mice. (E) Mean frequency (kHz) of the isolation calls was significantly altered in Foxp1DD mice and at P4 within Foxp1D1 animals. (F) The call slope or “structure” of the call was significantly altered over postnatal development in Foxp1D1 pups and specifically at P10 within Foxp1DD pups. Data are represented as mean ± SEM; n = 71 Foxp1CTL; n = 47 Foxp1D1; n = 36 Foxp1D2; n = 11 Foxp1DD; *p < 0.05, **p < 0.005, and ***p < 0.0001, two-way ANOVA with Sidak’s multiple comparisons test. (G) Representative images of nests. (H) Foxp1D1 and Foxp1DD mice produced nests with significantly lower quality scores compared to Foxp1D2 and Foxp1DD mice. Data are represented as mean ± SEM; n = 7 Foxp1CTL; n = 4 Foxp1D1; n = 5 Foxp1D2; n = 5 Foxp1DD; **p < 0.005, one-way ANOVA with Sidak’s multiple comparisons test. (I and J) Associative fear memory was assessed using the fear-conditioning (FC) paradigm. All Foxp1 cKO mice displays deficits in cued FC (I) shown as the percent of time spent freezing. Only Foxp1D1 and Foxp1DD mice displayed deficits in contextual FC (J). Data are represented as mean ± SEM n = 23 Foxp1CTL; n = 22 Foxp1D1; n = 11 Foxp1D2; n = 15 Foxp1DD; *p < 0.05, **p < 0.005, and ***p < 0.0001, two-way ANOVA with Dunnett’s multiple comparisons test. See also Figure S6.
Figure 7.
Figure 7.. Summary of Cellular, Structural, Functional, and Behavioral Findings within Cell-Type-Specific Foxp1 Conditional Knockout Mice
Foxp1D1 mice have an increase in eSPN subpopulations, reduced striosomal area, no gross SPN projection deficits, and distinct behavioral deficits relevant to social communication behavior and contextual fear conditioning. Foxp1D2 mice have a marked decrease in iSPN and increase in eSPN subpopulations; reduced striosomal area with few striosomal iSPNs; dSPN-GPi and iSPNGPe projection deficits; and deficits in motor learning, activity, and cued fear conditioning.

Similar articles

Cited by

References

    1. Ade KK, Wan Y, Chen M, Gloss B, and Calakos N (2011). An improved "BAC transgenic fluorescent reporter line for sensitive and specific identification of striatonigral medium spiny neurons. Front. Syst. Neurosci 5, 32. - PMC - PubMed
    1. Anderson SA, Qiu M, Bulfone A, Eisenstat DD, Meneses J, Pedersen R, and Rubenstein JL (1997). Mutations of the homeobox genes Dlx-1 and Dlx-2 disrupt the striatal subventricular zone and differentiation of late born striatal neurons. Neuron 19, 27–37. - PubMed
    1. Andrews S (2010). FastQC: a quality control tool for high throughput sequence data. https://www.bioinformatics.babraham.ac.uk/projects/fastqc/.
    1. Araujo DJ, Anderson AG, Berto S, Runnels W, Harper M, Ammanuel S, Rieger MA, Huang HC, Rajkovich K, Loerwald KW, et al. (2015). FoxP1 orchestration of ASD-relevant signaling pathways in the striatum. Genes Dev. 29, 2096. - PMC - PubMed
    1. Araujo DJ, Toriumi K, Escamilla CO, Kulkarni A, Anderson AG, Harper M, Usui N, Ellegood J, Lerch JP, Birnbaum SG, et al. (2017). Foxp1 in forebrain pyramidal neurons controls gene expression required for spatial learning and synaptic plasticity. J. Neurosci 37, 10917–10931. - PMC - PubMed

Publication types