Comparative Study
. 2020 Mar 3;30(9):3105-3116.e4.
doi: 10.1016/j.celrep.2020.02.034.

Direct Comparison of Mononucleated and Binucleated Cardiomyocytes Reveals Molecular Mechanisms Underlying Distinct Proliferative Competencies

Affiliations
Comparative Study

Direct Comparison of Mononucleated and Binucleated Cardiomyocytes Reveals Molecular Mechanisms Underlying Distinct Proliferative Competencies

Rebecca Windmueller et al. Cell Rep. .

Abstract

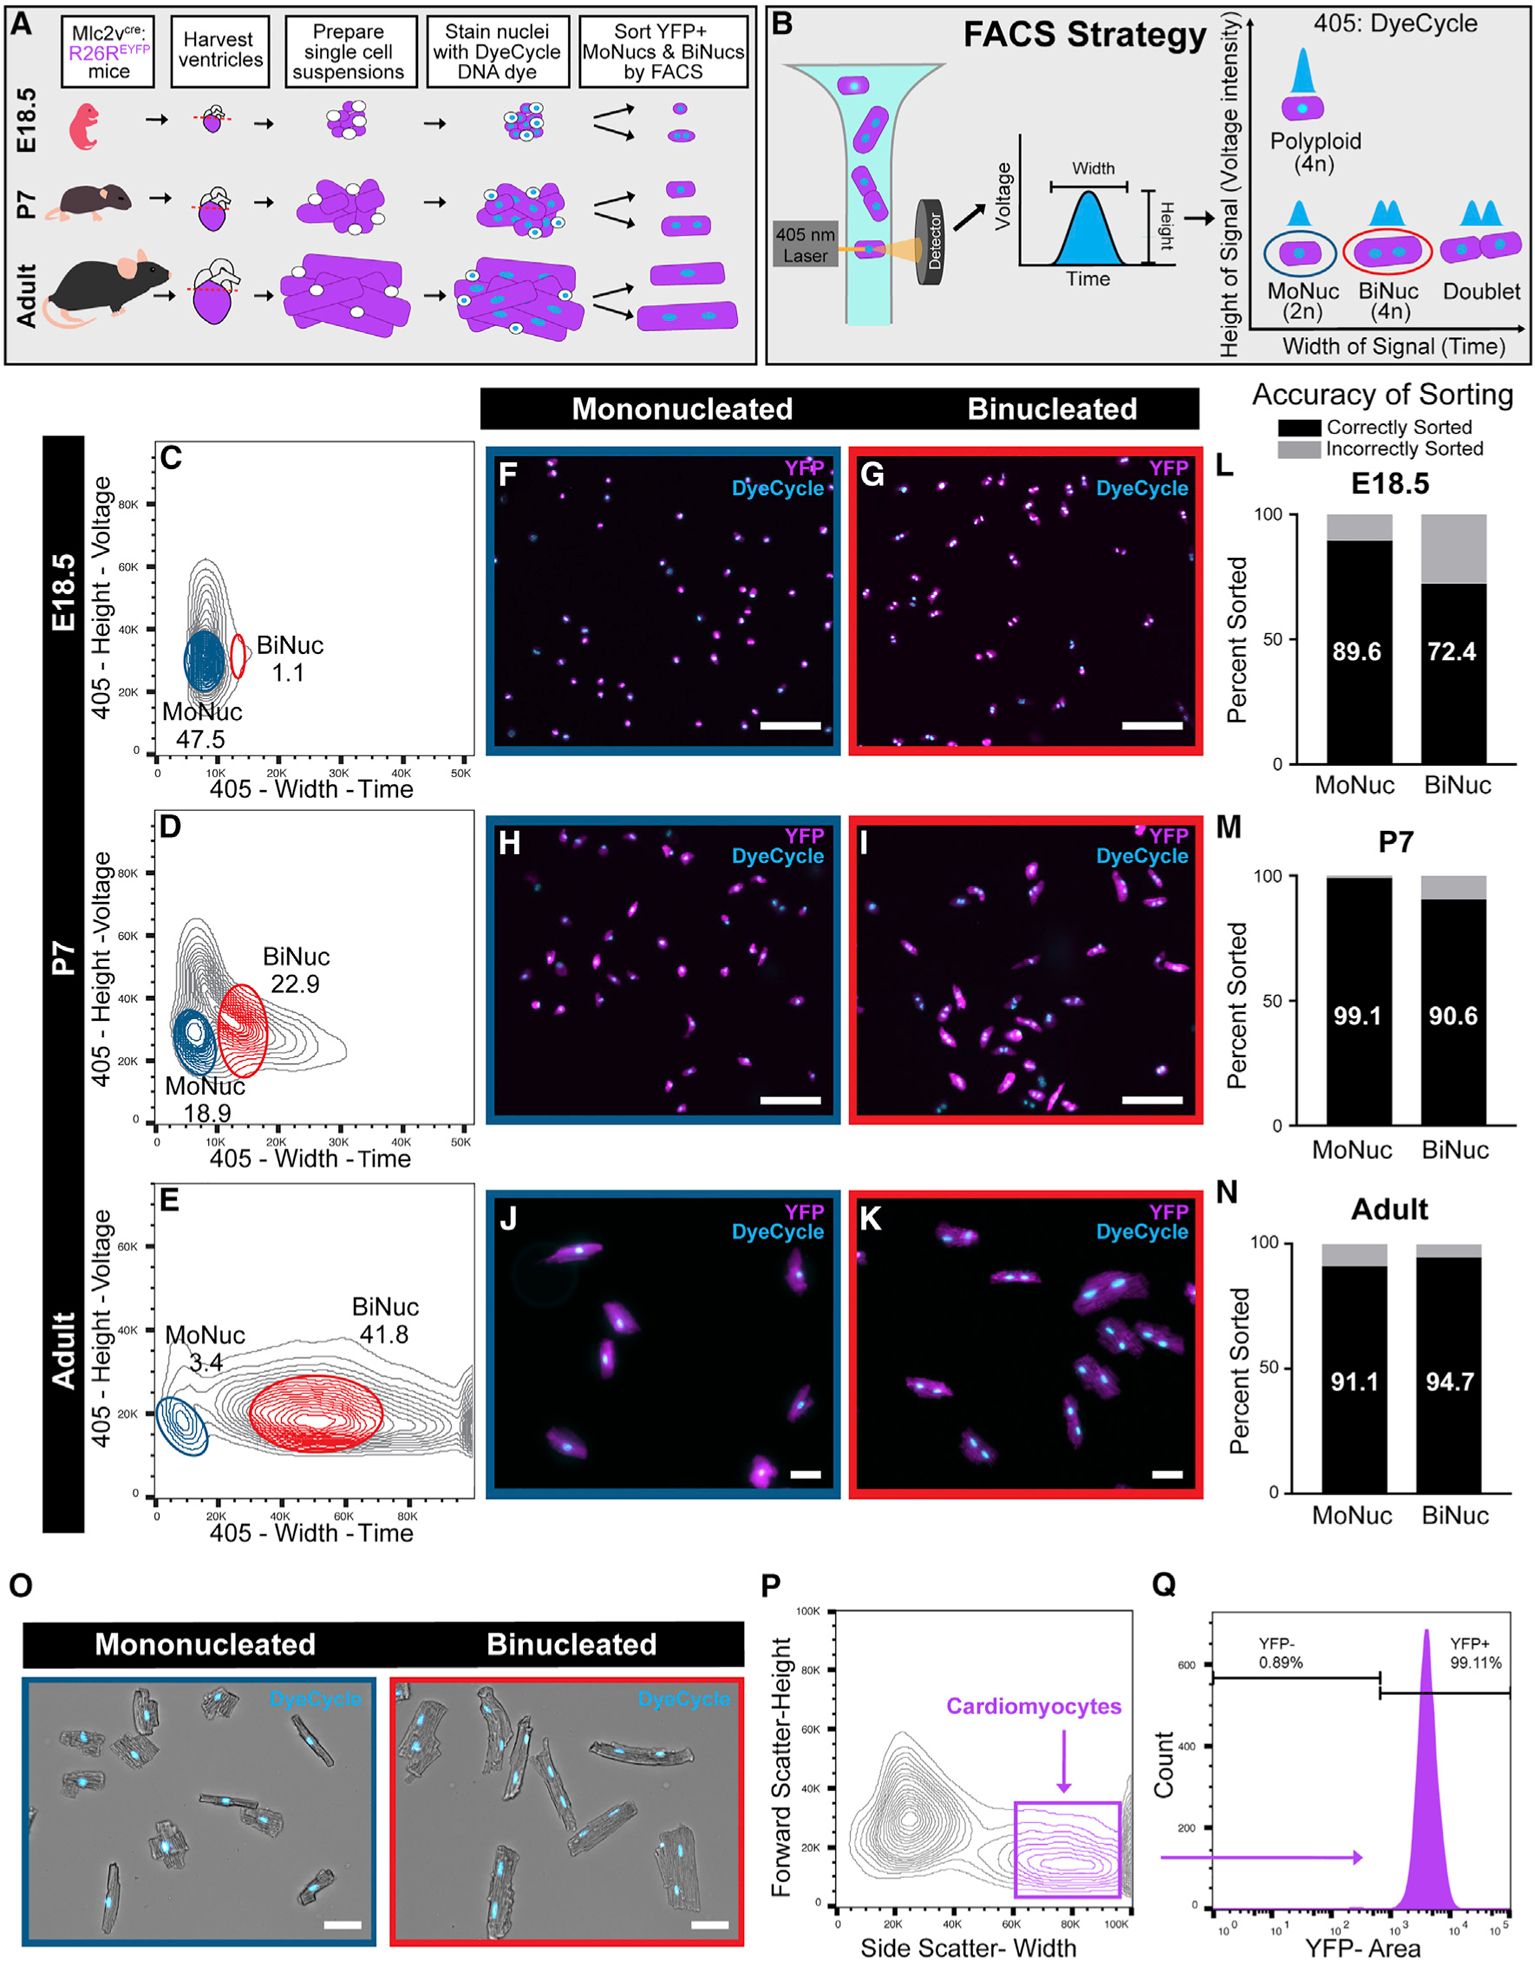
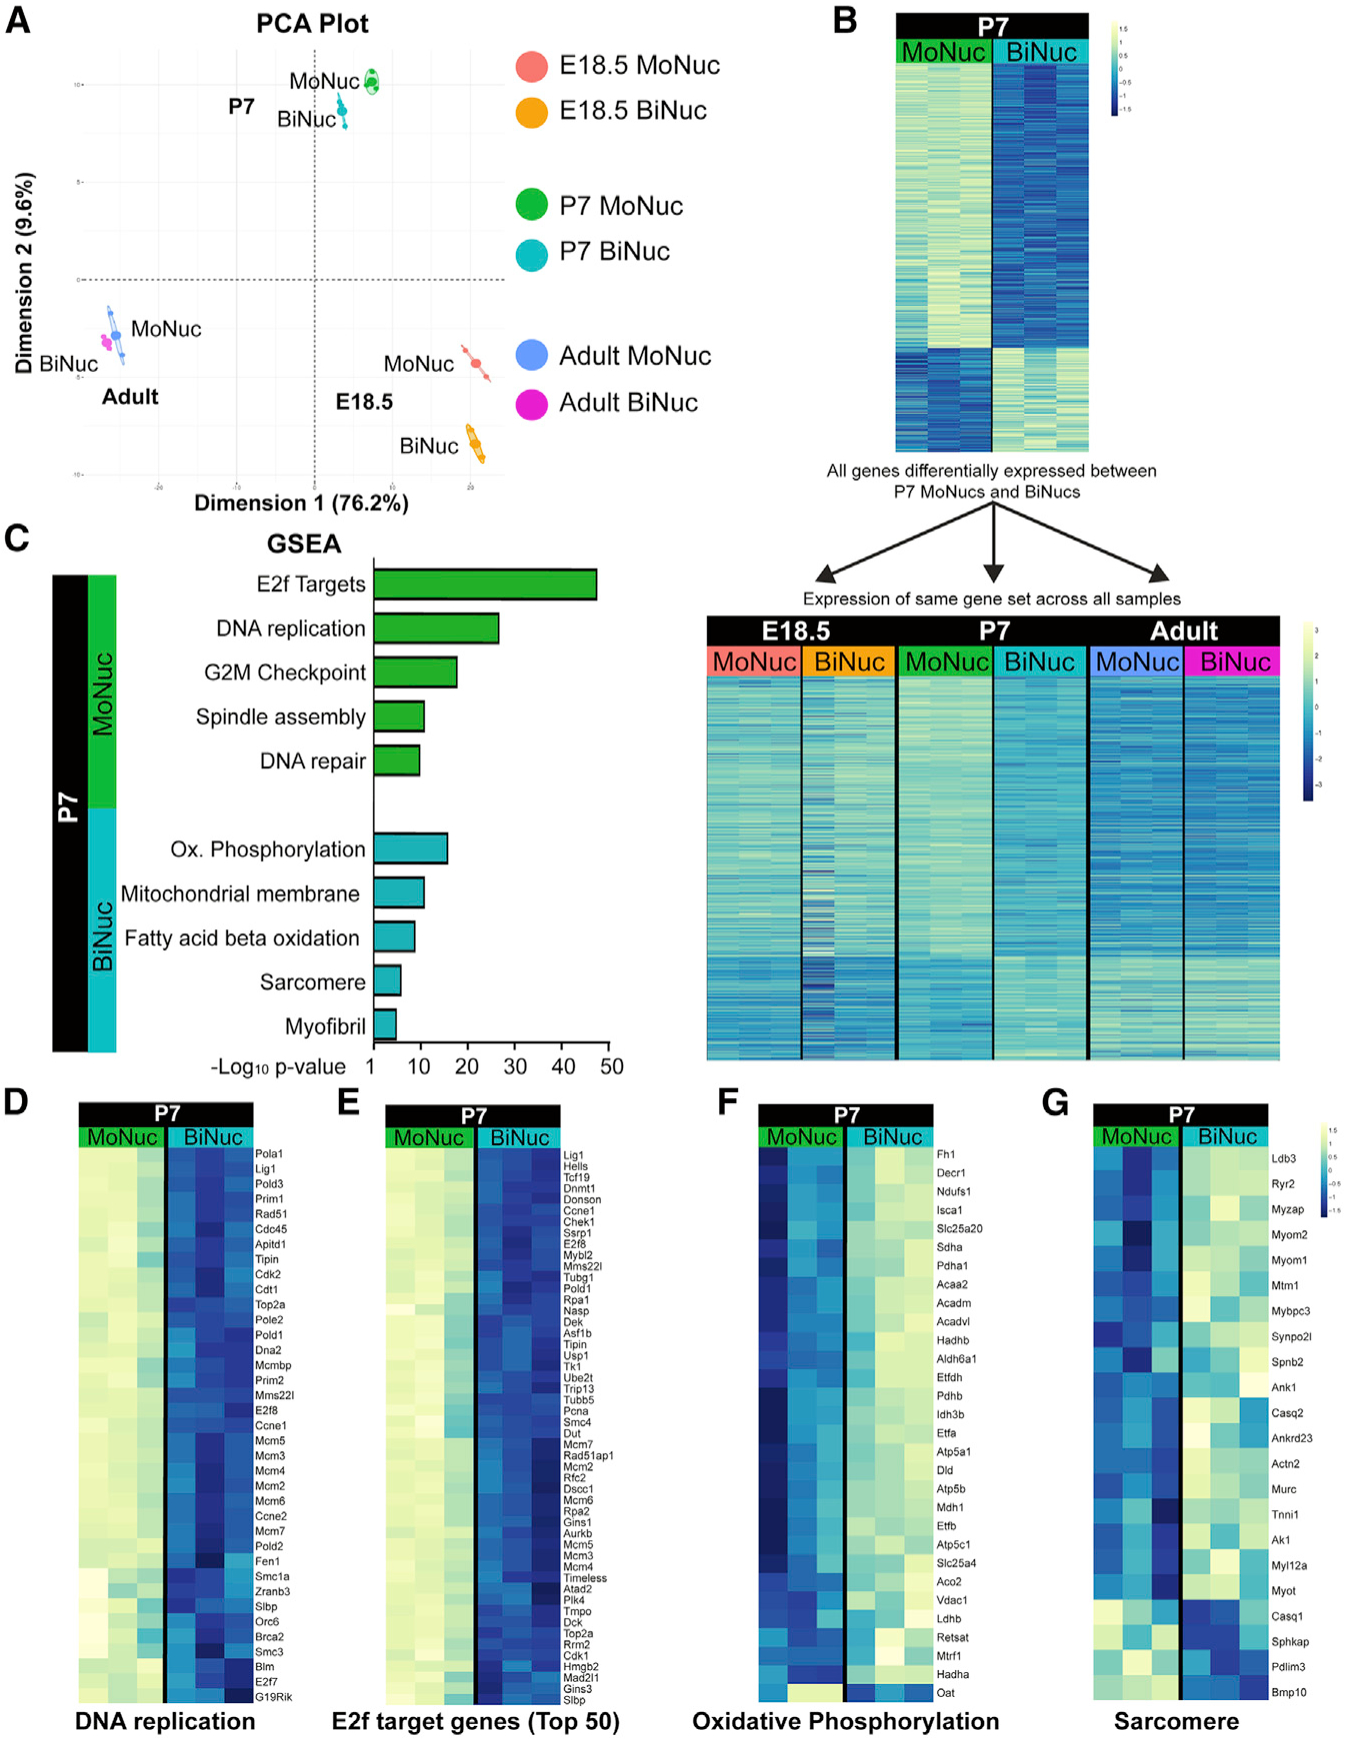
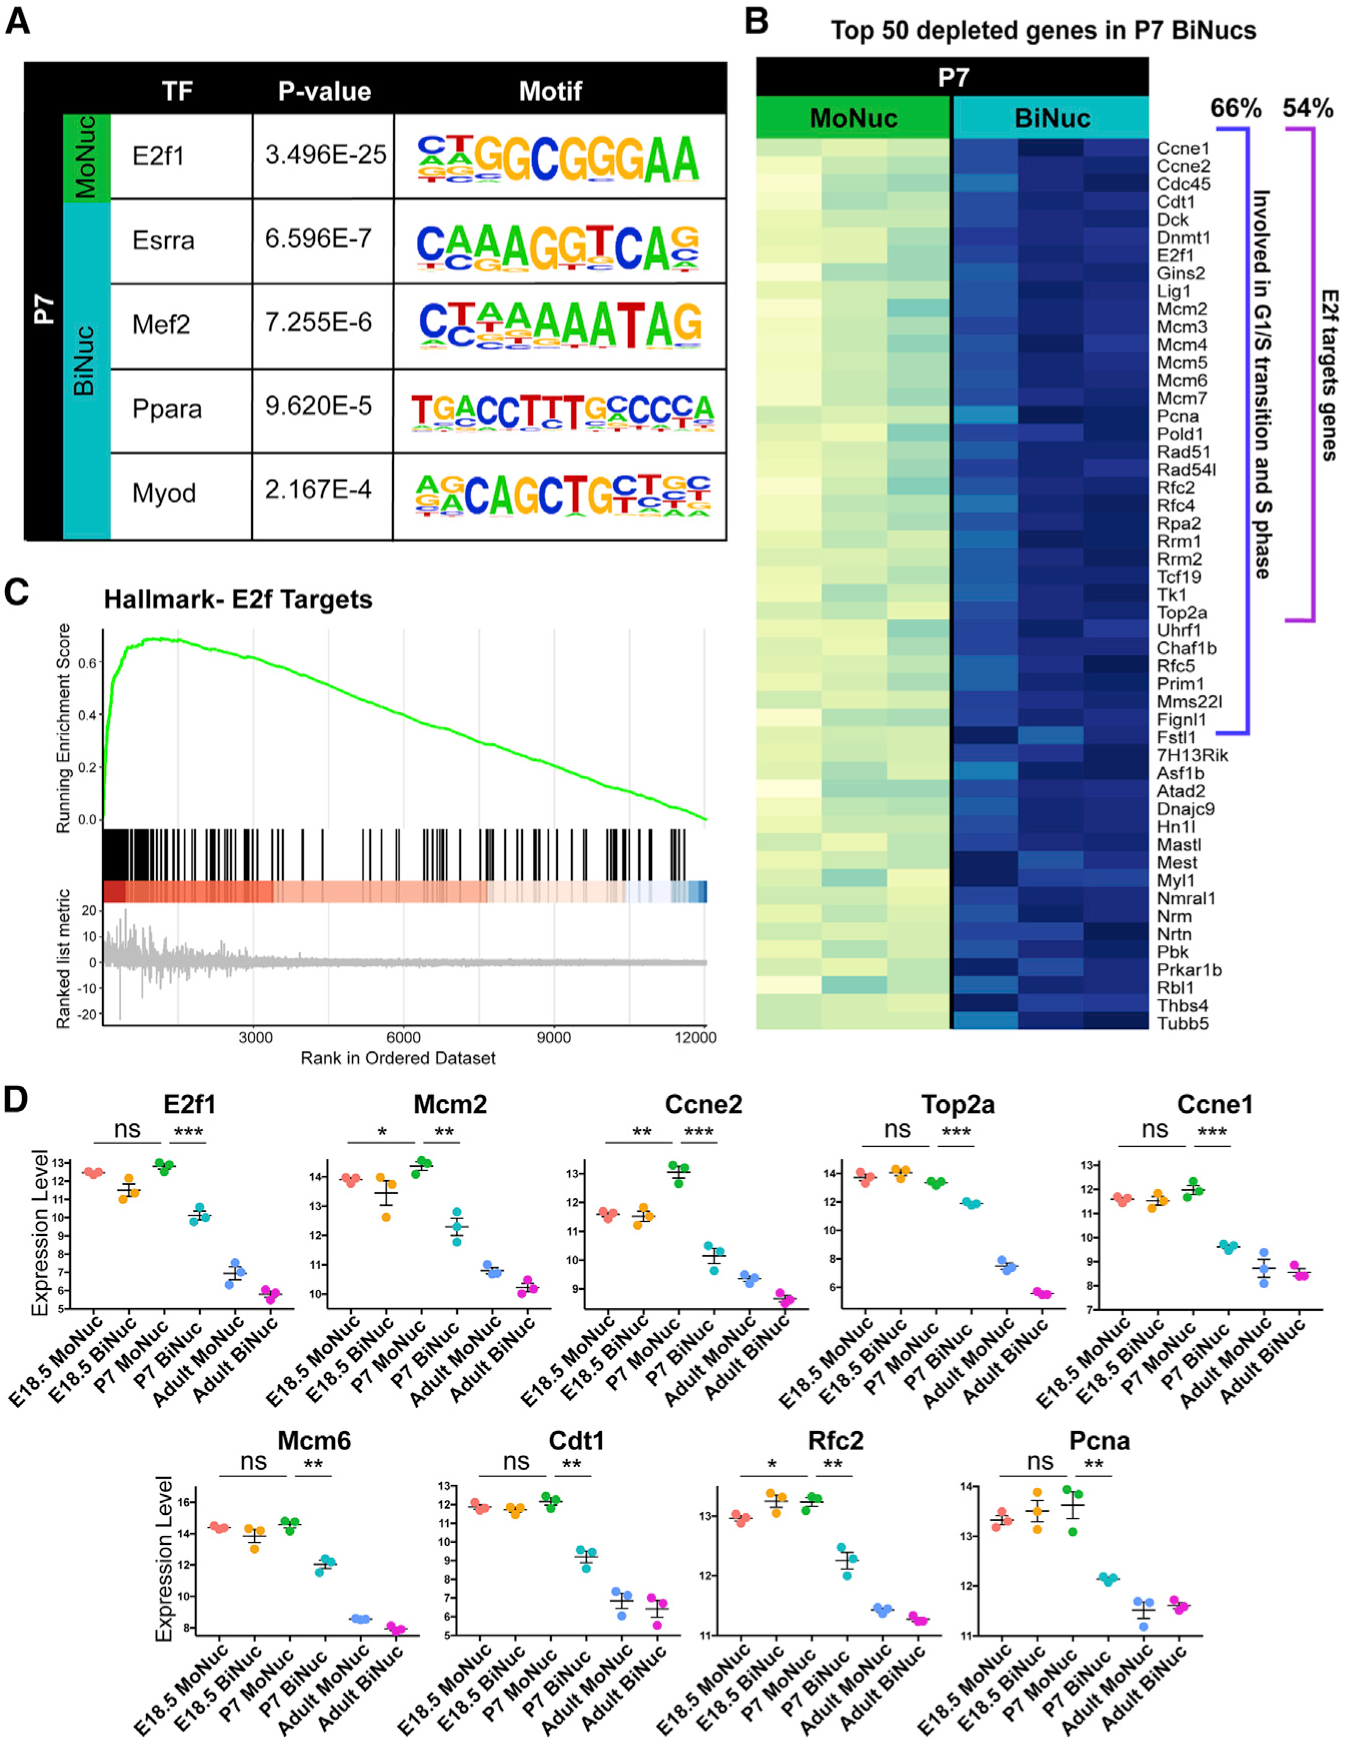
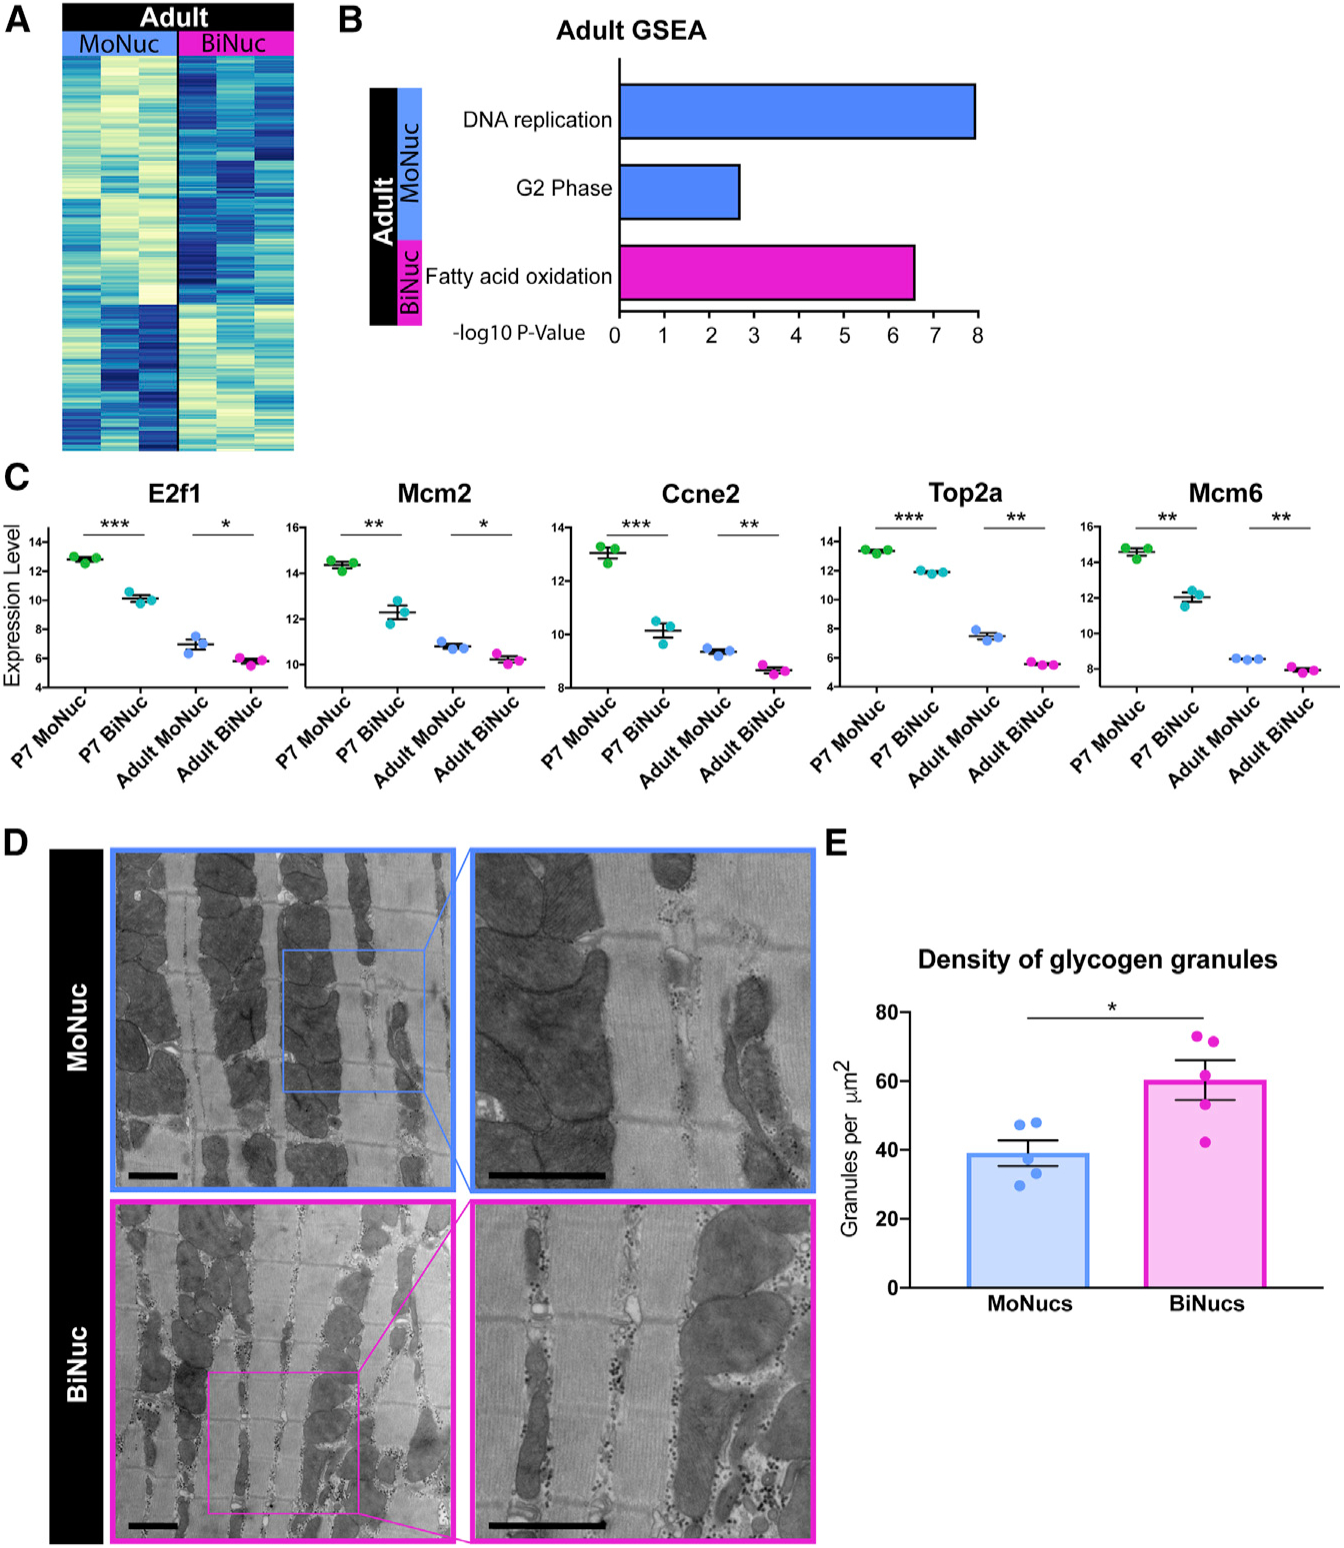
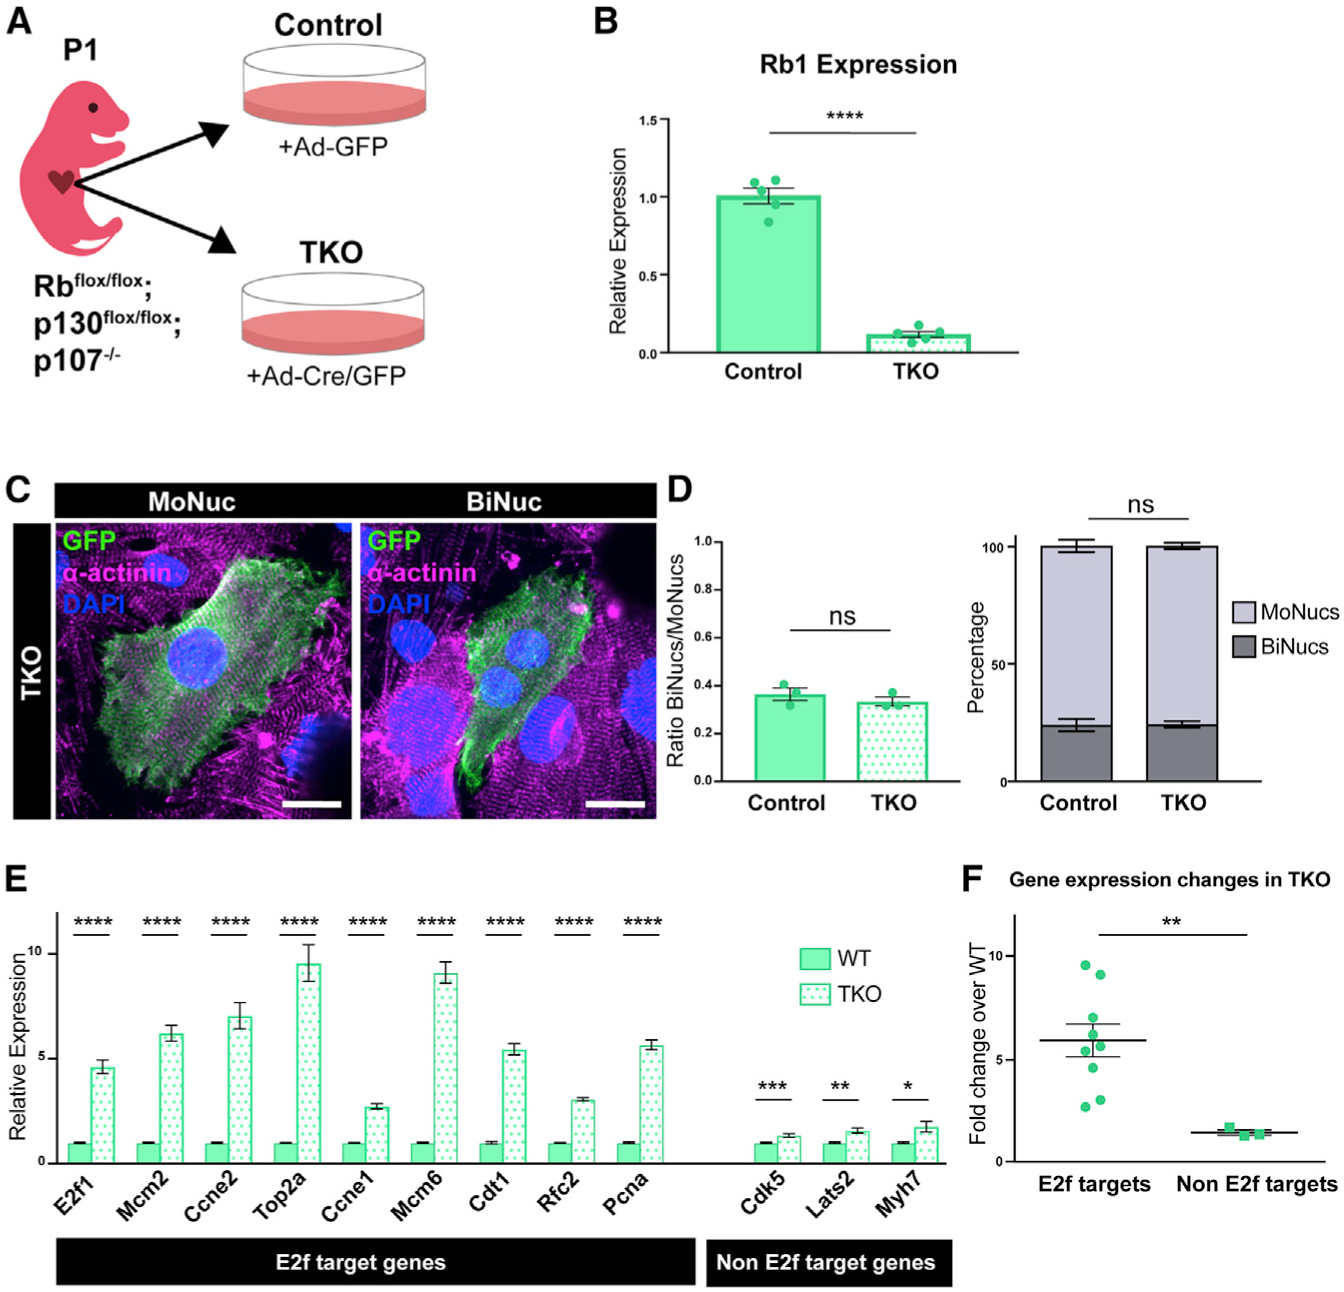
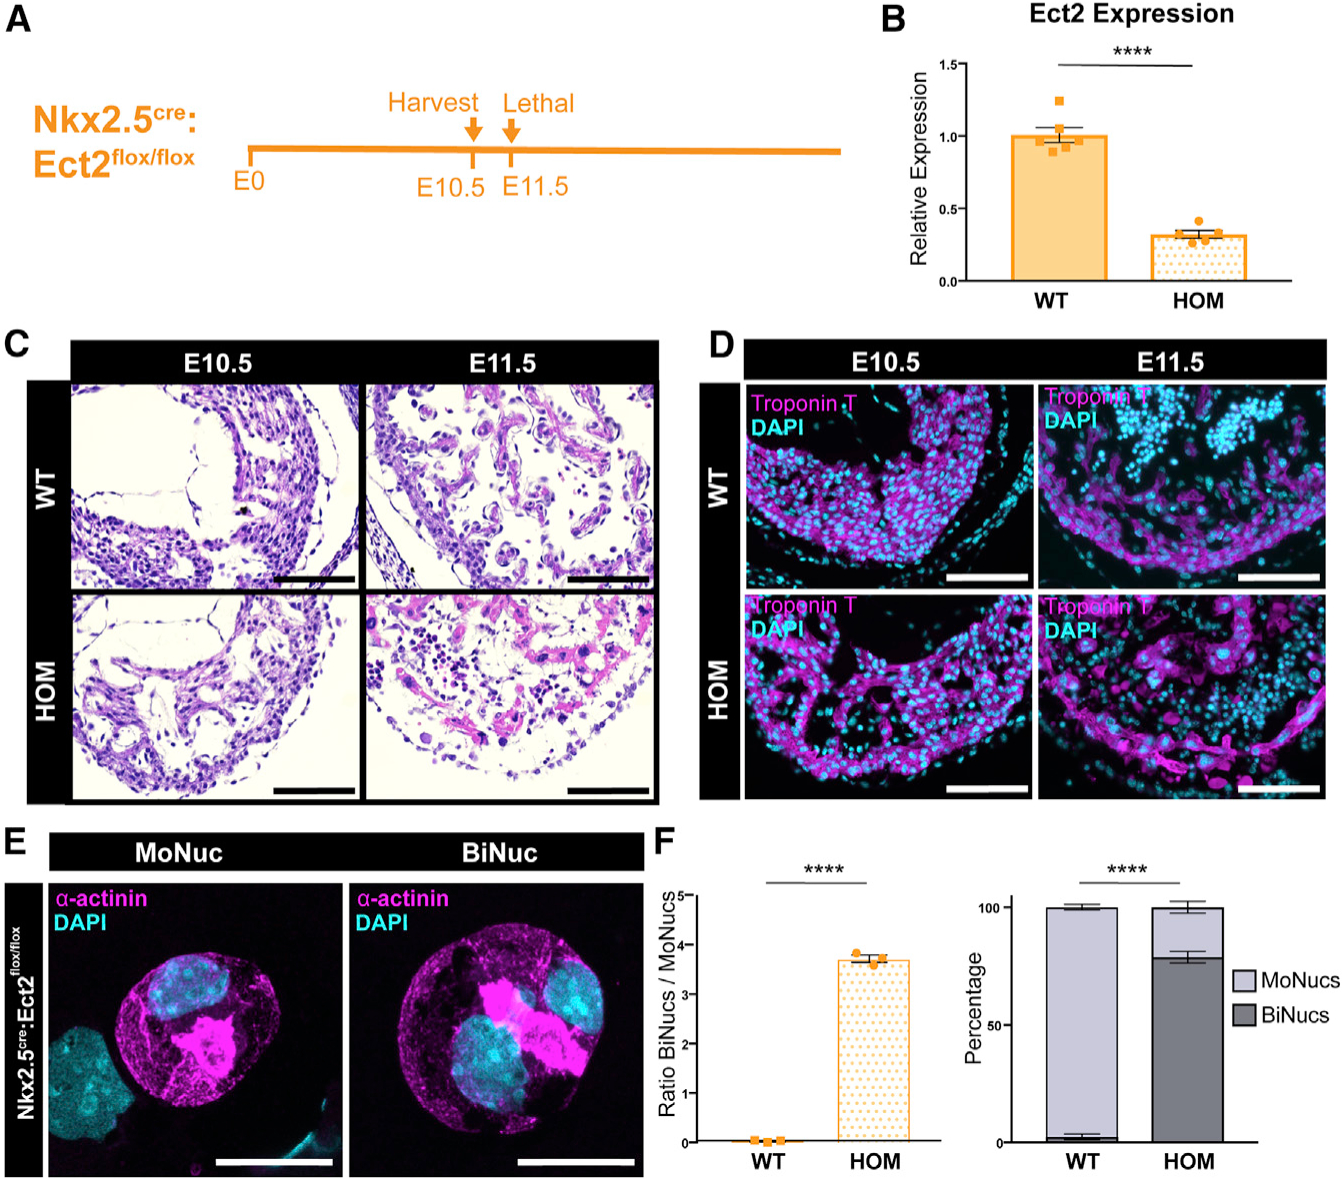
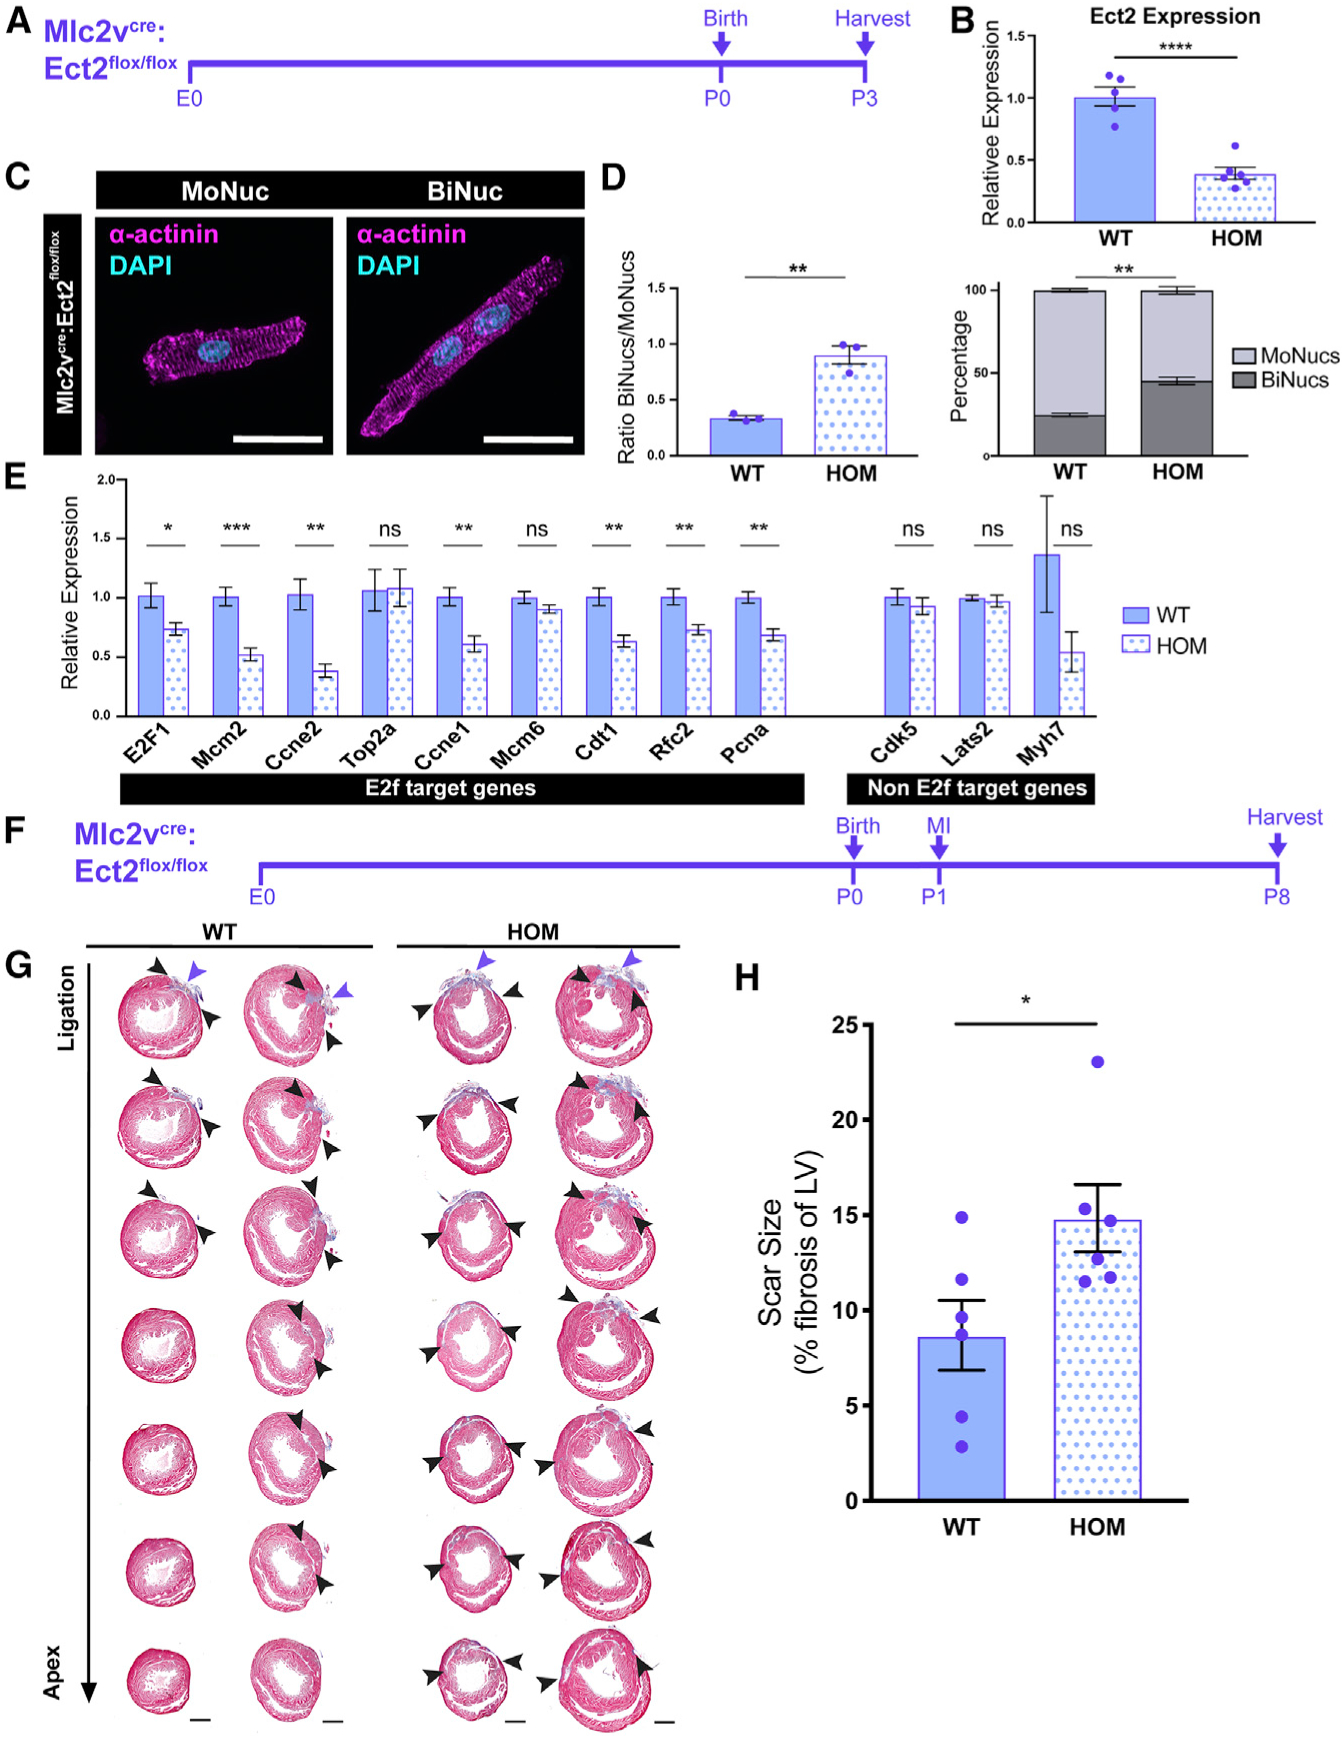
The mammalian heart is incapable of regenerating a sufficient number of cardiomyocytes to ameliorate the loss of contractile muscle after acute myocardial injury. Several reports have demonstrated that mononucleated cardiomyocytes are more responsive than are binucleated cardiomyocytes to pro-proliferative stimuli. We have developed a strategy to isolate and characterize highly enriched populations of mononucleated and binucleated cardiomyocytes at various times of development. Our results suggest that an E2f/Rb transcriptional network is central to the divergence of these two populations and that remnants of the differences acquired during the neonatal period remain in adult cardiomyocytes. Moreover, inducing binucleation by genetically blocking the ability of cardiomyocytes to complete cytokinesis leads to a reduction in E2f target gene expression, directly linking the E2f pathway with nucleation. These data identify key molecular differences between mononucleated and binucleated mammalian cardiomyocytes that can be used to leverage cardiomyocyte proliferation for promoting injury repair in the heart.

Keywords: E2f; Ect2; Rb; binucleated; cardiac regeneration; cardiomyocyte; development; heart; mononucleated; proliferation.


Conflict of interest statement

Declaration of Interests The authors declare no competing interests.

Figures

Figure 1.
Figure 1.. Mononucleated and Binucleated Cardiomyocytes Can Be Separated by FACS
(A) Schematic of experimental design to collect mononucleated (MoNucs) and binucleated (BiNucs) cardiomyocytes (CMs) for RNA-sequencing (RNA-seq) analysis. Single-cell suspensions are isolated from the hearts of Mlc2vcre:R26REYFP mice at age E18.5, P7, and adult. Nuclei are stained with Vybrant DyeCycle DNA dye. CMs are identified by FACS as YFP+ and then sorted by nucleation. (B) Schematic of sorting strategy for separating MoNucs and BiNucs. As nuclei of CMs pass the 405-nm laser, DyeCycle DNA dye is activated and produces a signal of which the width is proportional to the length of time that the nuclei travel through the laser. Two nuclei (BiNucs) take longer to travel past the laser than one nucleus (MoNucs) and produce two overlapping signals, which are interpreted as a single signal of greater width. The height of the signal produced is proportional to DNA content per nucleus, allowing the separate gating of diploid and polyploid cells. MoNucs and BiNucs cluster separately on a plot of width versus height of the 405 signal. (C–E) Representative flow cytometry plots of the width versus height of the 405 channel. Gates used to sort E18.5 (C), P7 (D), and adult (E) MoNucs and BiNucs are shown. The mean percentages of total YFP+ cells that fall inside MoNuc or BiNuc gates are indicated. n = 3 animals for each time point. (F–K) Cropped images of live Mlc2vcre:R26REYFP MoNucs (F, H, and J) and BiNucs (G, I, and K) from E18.5, P7, and adult mice sorted onto slides according to gates shown in (C)–(E). Scale bar, 50 μm. (L–N) Percentages of E18.5, P7, and adult MoNucs and BiNucs correctly and incorrectly sorted into indicated groups as determined by slide images taken during sorts. More than 100 cells were counted for each group. (O) Adult CD-1 MoNuc and BiNuc CMs sorted onto slides with expanded FACS strategy that allows CMs to be sorted without a lineage marker. Scale bar, 50 μm. (P) FACS plot showing expanded FACS strategy. (Q) Success of expanded FACS strategy tested on Mlc2vcre:R26REYFP CMs. Histogram shows that >99% of cells gated as CMs are YFP+. See also Figure S1.
Figure 2.
Figure 2.. Binucleation Is Accompanied by a Switch from a Proliferation-Associated Gene Expression Program to One Associated with Maturation
(A) Principal component analysis (PCA) from RNA-seq of MoNucs and BiNucs from E18.5, P7, and adult hearts shows that at each time point, MoNucs and BiNucs are transcriptionally distinct. n = 3 animals per time point. (B) Heatmaps of genes with significant differences (FDR < 0.05) in expression between P7 MoNucs and BiNucs. Gene expression values are represented at P7 only (top) and at all time points (bottom). Bottom heatmap reveals that the gene expression profile of P7 BiNucs but not P7 MoNucs bears a resemblance to the profiles of adult samples. The difference in intensity between top and bottom heatmaps is due to the different scales used. (C) Representative categories from gene set enrichment analysis (GSEA) of differential gene expression between P7 MoNucs and BiNucs. P7 MoNucs are enriched for genes involved in the cell cycle, while P7 BiNucs are enriched for genes involved in cardiomyocyte maturation. Analysis was done using Camera. (D–G) Heatmaps comparing expression between P7 MoNucs and BiNucs of gene sets included in (C). E2f target gene heatmap shows top 50 differentially expressed genes from the set of 199 genes. See also Figure S2.
Figure 3.
Figure 3.. BiNuc CMs at P7 Turn Off E3f Target Gene Expression Required for G1/S Phase Transition and S Phase
(A) Enriched transcription factor motifs within promoters of genes differentially expressed between P7 MoNucs and BiNucs reveal that E2f target genes are the most highly enriched. Analysis was performed using the ToppGene suite. (B) Analysis of the top 50 differentially expressed genes between P7 MoNucs and BiNucs reveals that 66% (33/50) are involved in G1/S transition and S phase of the cell cycle; 27 of the 50 (54%) are E2f target genes. (C) GSEA plot of E2f target genes differentially expressed between P7 MoNucs and BiNucs. (D) E2f target gene expression decreases specifically between P7 MoNucs and BiNucs, but not between E18.5 and P7 MoNucs. The expression values of indicated E2f target genes measured by RNA-seq are shown across all of the samples. The significance of differences in gene expression between E18.5 and P7 MoNucs and between P7 MoNucs and BiNucs are indicated. Data are reported as mean ± SEM. n = 3 animals per time point. p values determined by Student’s t test. ns, not significant, *p < 0.05, **p < 0.01, ***p < 0.001, ****p < 0.0001. See also Figure S3.
Figure 4.
Figure 4.. Adult MoNuc and BiNuc CMs Retain Differences Established during Neonatal Maturation
(A) Heatmap of gene expression differences with p < 0.05 between adult MoNucs and BiNucs. (B) Representative categories from GSEA of differential gene expression between Adult MoNucs and BiNucs reveals overlap with categories enriched between P7 MoNucs and BiNucs. Analysis was done using Camera. (C) A subset of E2f target genes most differentially expressed between P7 MoNucs and BiNucs remain differentially expressed between adult MoNucs and BiNucs. Expression values of these genes measured by RNA-seq are shown in P7 and adult samples. The significance of differences in gene expression between P7 MoNucs and BiNucs and between adult MoNucs and BiNucs are indicated. Data are reported as mean ± SEM. n = 3 animals per time point. p values are determined by Student’s t test. ns, not significant, *p < 0.05, **p < 0.01, ***p < 0.001, ****p < 0.0001. (D) Electron micrographs of sorted adult MoNucs and BiNucs. Scale bar, 1 μm. (E) Quantification of glycogen granule density in non-sarcomeric cytoplasmic space visualized by electron microscopy. The significance of difference between adult MoNucs and BiNucs is indicated. Data are reported as mean ± SEM. n = 5 cells per sample. p values are determined by Student’s t test. ns, not significant, *p < 0.05, **p < 0.01, ***p < 0.001, ****p < 0.0001. See also Figure S4.
Figure 5.
Figure 5.. Rb Acts Downstream of Binucleation and Is Required for Downregulation of E2f Target Genes
(A) Schematic of experimental design of in vitro Rb family KO experiments. CMs were isolated from Rbflox/flox;p130flox/flox;p107−/− mice at P1 and infected with adenovirus containing either Cre and GFP (Ad-Cre/GFP) or GFP alone (Ad-GFP). Cells infected with Ad-Cre/GFP are denoted as triple knockout (TKO) samples, and cells infected with Ad-GFP are denoted as control samples. (B) Expression values of the Rb transcript in TKO samples compared to control samples by qPCR. Data are reported as mean ± SEM. n = 5 animals. (C) Confocal images of fixed TKO MoNuc and BiNuc CMs stained with antibodies against a-actinin and GFP. Scale bar, 20 μm. (D) Quantification of the ratio of BiNucs to MoNucs and percentages of MoNucs and BiNucs in GFP+ control and TKO CMs fixed and stained with antibodies against α-actinin and GFP. n = 3 animals. Data are reported as mean ± SEM. p values are determined by Student’s t test. (E) Gene expression differences between control and TKO samples of E2f target genes and non-E2f target genes by qPCR. Data are reported as mean ± SEM. n = 5 animals. p values are determined by Student’s t test. (F) Comparison of mean fold change expression of TKO samples over control samples of E2f target genes versus non-E2f target genes. p values are determined by Student’s t test. ns, not significant, *p < 0.05, **p < 0.01, ***p < 0.001, ****p < 0.0001.
Figure 6.
Figure 6.. Loss of Ect2 Results in Binucleation of CMs
(A) Time course of Nkx2.5cre:Ect2flox/flox KO. (B) Expression values of the Ect2 transcript in Nkx2.5cre:Ect2flox/flox (HOM; homozygous knockout) samples compared to Ect2flox/flox and Ect2flox/+ (wild-type [WT]) samples at E10.5 by qPCR. Data are reported as mean ± SEM. n = 5–6 animals per group. (C and D) Representative tissue sections of WT and HOM hearts at E10.5 and E11.5 stained with H&E (C) or an antibody against cardiac troponin T (D) reveals that the Nkx2.5cre:Ect2flox/flox allele is lethal by E11.5. Scale bar, 100 μm. (D) Representative images of a MoNuc and BiNuc present in E10.5 HOM samples. Single-cell suspensions were cytospun and stained with an antibody against α-actinin. Scale bar, 20 μm. (E) Quantification of the ratio of BiNucs to MoNucs and percentages of MoNucs and BiNucs in E10.5 WT and HOM samples. Data are reported as mean ± SEM. n = 3 animals per group. p values are determined by Student’s t test. ns, not significant, *p < 0.05, **p < 0.01, ***p < 0.001, ****p < 0.0001.
Figure 7.
Figure 7.. Binucleation Results in Downregulation of E2f Target Genes and Impairment of Regenerative Potential
(A) Time course of Mlc2vcre:Ect2flox/flox KO. (B) Expression values of the Ect2 transcript in Mlc2vcre:Ect2flox/flox (HOM) samples compared to Ect2flox/flox and Ect2flox/+ (WT) samples at P3 by qPCR. Data are reported as mean ± SEM. n = 5–6 animals per group. (C) Images of P3 HOM MoNuc and BiNuc CMs from fixed single-cell suspensions stained with anti-α-actinin. Scale bar, 20 μm. (D) Quantification of the ratio of BiNucs to MoNucs and percentages of MoNucs and BiNucs in P3 WT and HOM samples. Data are reported as mean ± SEM. n = 3 animals per group. (E) Gene expression differences between WT and HOM samples of E2f target genes and non-E2f target genes. Data are reported as mean ± SEM. n = 5–6 animals per group. p values are determined by Student’s t test. ns, not significant. (F) Schematic showing study design of myocardial infarction (MI) by ligation of the left anterior descending (LAD) artery in Mlc2vcre:Ect2flox/flox mutant and control mice at P1. (G) Masson’s trichrome-stained heart sections from the ligation site toward the apex 7 days after injury. n = 6 per group. (H) Quantification of the percentage of left ventricular myocardium containing scar tissue at P8. Suture location is indicated with the purple arrow. Scar boundaries are indicated with black arrows. Scale bar, 500 μm. Data are reported as mean ± SEM. n = 6 animals per group. p values are determined by Mann-Whitney U test. ns, not significant, *p < 0.05, **p < 0.01, ***p < 0.001, ****p < 0.0001.

References

    1. Bergmann O, Bhardwaj RD, Bernard S, Zdunek S, Barnabé-Heider F, Walsh S, Zupicich J, Alkass K, Buchholz BA, Druid H, et al. (2009). Evidence for cardiomyocyte renewal in humans. Science 324, 98–102. - PMC - PubMed
    1. Bergmann O, Zdunek S, Alkass K, Druid H, Bernard S, and Frisén J (2011). Identification of cardiomyocyte nuclei and assessment of ploidy for the analysis of cell turnover. Exp. Cell Res 317, 188–194. - PubMed
    1. Bersell K, Arab S, Haring B, and Kühn B (2009). Neuregulin1/ErbB4 signaling induces cardiomyocyte proliferation and repair of heart injury. Cell 138, 257–270. - PubMed
    1. Blais A, van Oevelen CJ, Margueron R, Acosta-Alvear D, and Dynlacht BD (2007). Retinoblastoma tumor suppressor protein-dependent methylation of histone H3 lysine 27 is associated with irreversible cell cycle exit. J. Cell Biol 179, 1399–1412. - PMC - PubMed
    1. Blanchet E, Annicotte JS, Lagarrigue S, Aguilar V, Clapé C, Chavey C, Fritz V, Casas F, Apparailly F, Auwerx J, and Fajas L (2011). E2F transcription factor-1 regulates oxidative metabolism. Nat. Cell Biol 13, 1146–1152. - PMC - PubMed

Publication types