. 2020 Mar 3;30(9):3127-3138.e6.
doi: 10.1016/j.celrep.2020.02.016.

Hierarchy in Hfq Chaperon Occupancy of Small RNA Targets Plays a Major Role in Their Regulation

Affiliations

Hierarchy in Hfq Chaperon Occupancy of Small RNA Targets Plays a Major Role in Their Regulation

Raya Faigenbaum-Romm et al. Cell Rep. .

Abstract

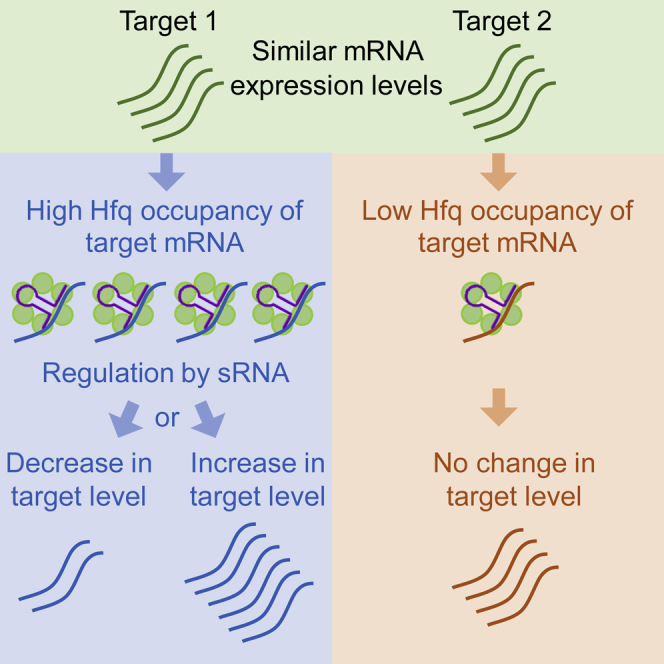
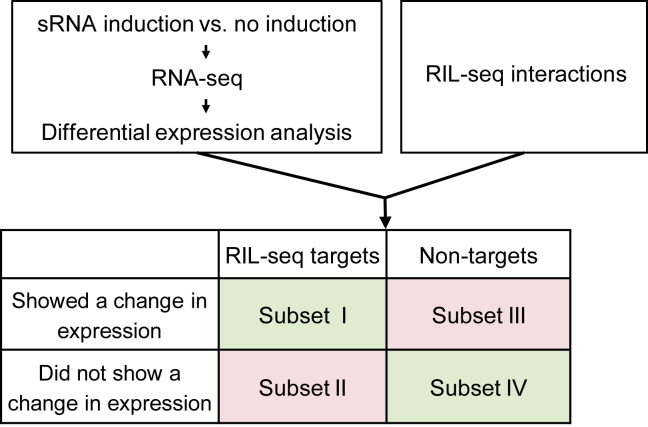
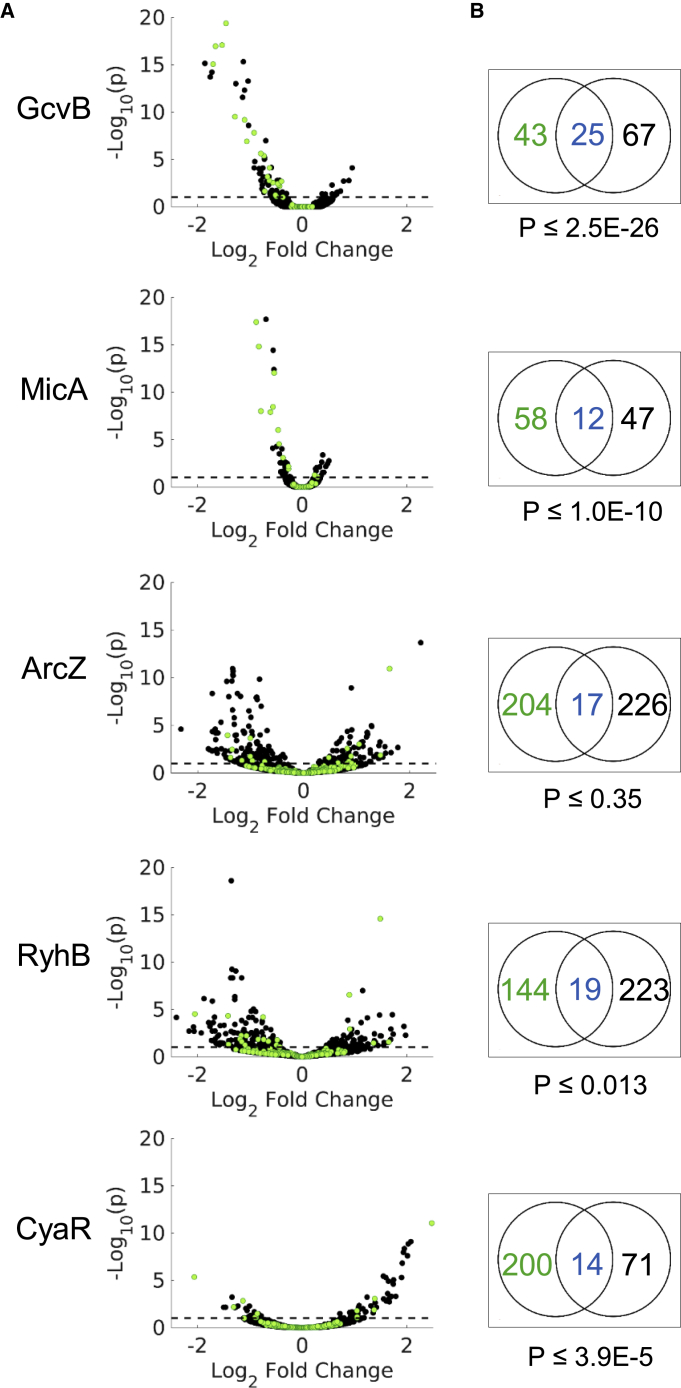
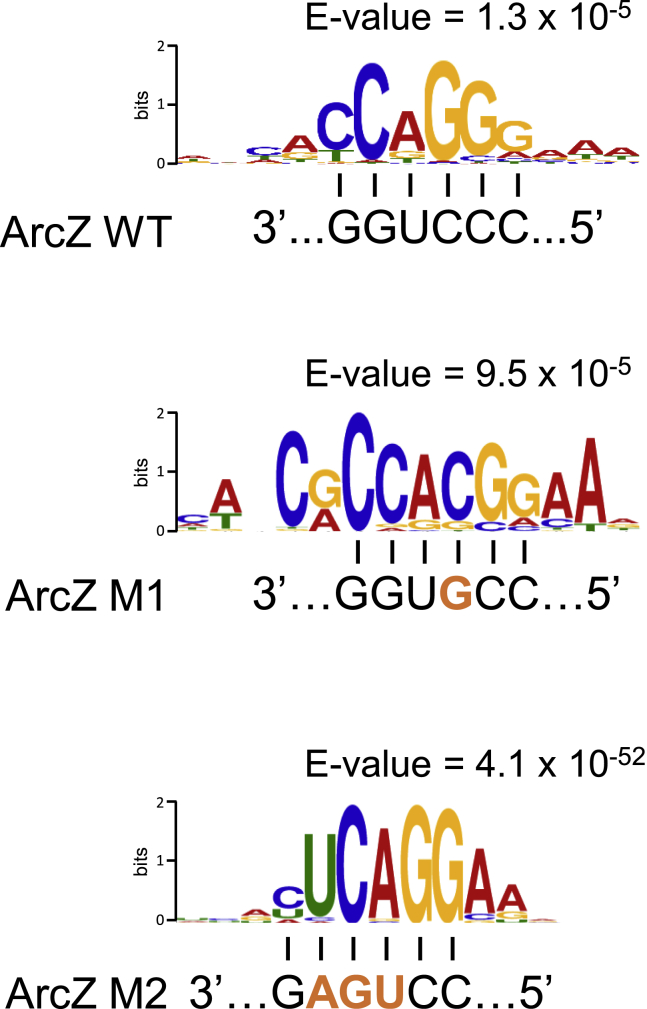
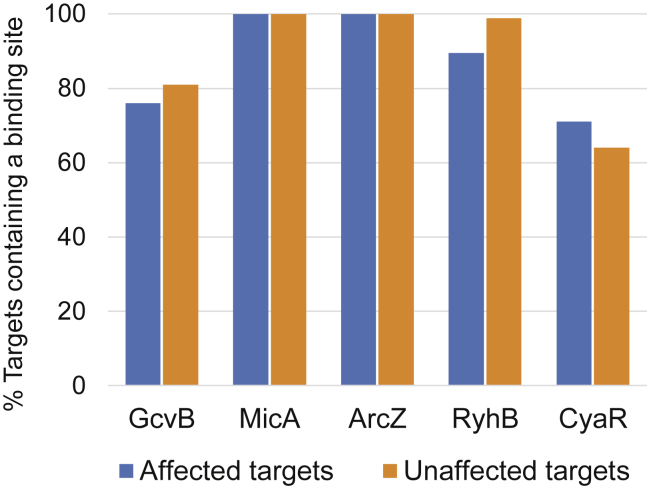
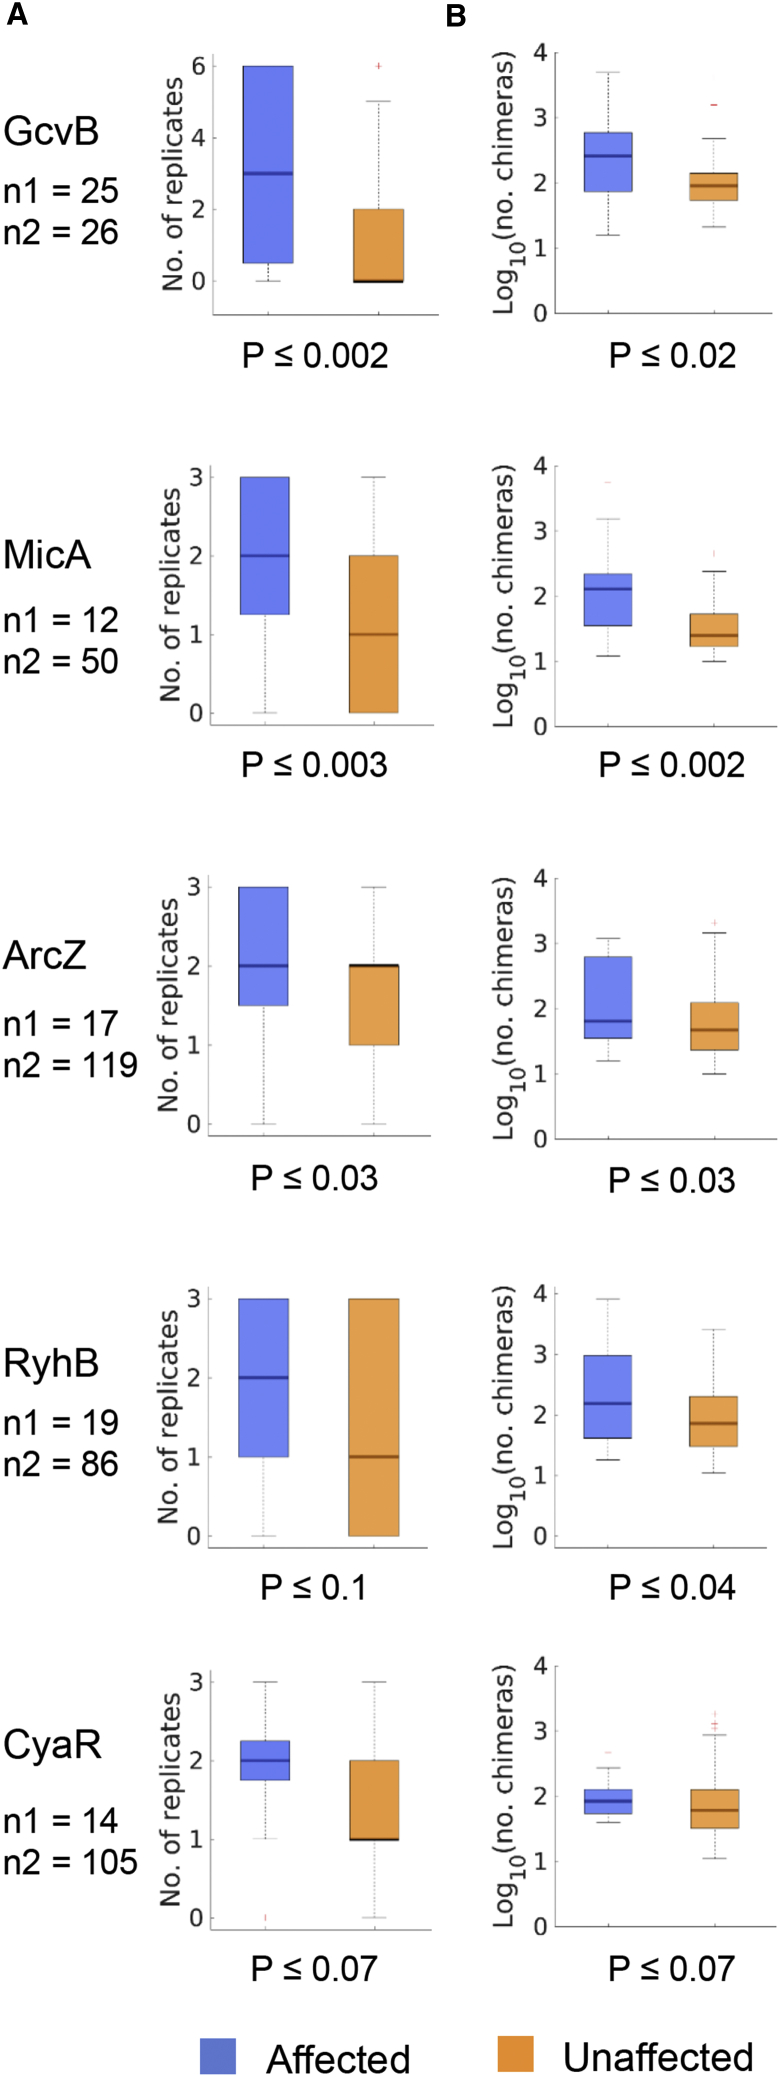
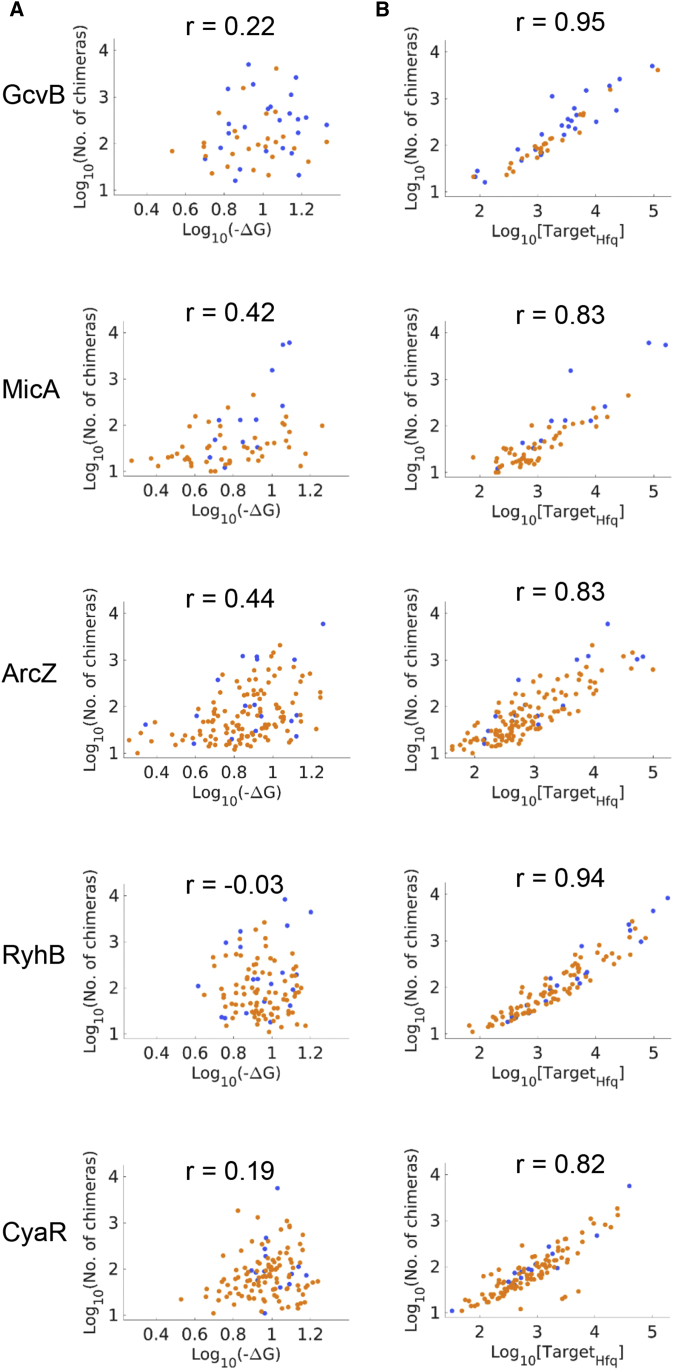
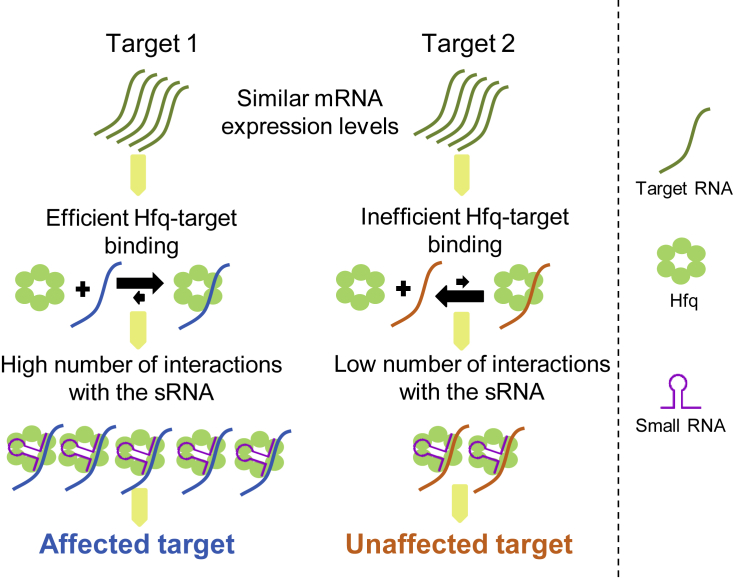
Bacterial small RNAs (sRNAs) are posttranscriptional regulators of gene expression that base pair with complementary sequences on target mRNAs, often in association with the chaperone Hfq. Here, using experimentally identified sRNA-target pairs, along with gene expression measurements, we assess basic principles of regulation by sRNAs. We show that the sRNA sequence dictates the target repertoire, as point mutations in the sRNA shift the target set correspondingly. We distinguish two subsets of targets: targets showing changes in expression levels under overexpression of their sRNA regulator and unaffected targets that interact more sporadically with the sRNA. These differences among targets are associated with their Hfq occupancy, rather than with the sRNA-target base-pairing potential. Our results suggest that competition among targets over Hfq binding plays a major role in the regulatory outcome, possibly awarding targets with higher Hfq binding efficiency an advantage in the competition over binding to the sRNA.

Keywords: Hfq; RIL-seq; RNA sequencing; posttranscriptional regulation; small RNAs.


Conflict of interest statement

Declaration of Interests The authors declare no competing interests.

Figures

None
Graphical abstract
Figure 1
Figure 1
Schematic Description of the Study and Generated Data RNA-seq experiments were performed on samples with and without sRNA overexpression. Differential expression analysis was conducted, and the results were intersected with RIL-seq interactions of the studied sRNA under the same growth condition as in the RNA-seq experiment (Melamed et al., 2016). Four subsets of genes could be discerned: two with an expected regulatory outcome (I and IV, marked in green) and two with an unexpected outcome (II and III, marked in pink). See also Figure S4 and Tables S1, S2, S3, and S4.
Figure 2
Figure 2
Measuring the Effect of the sRNA on Target mRNA Levels (A) Only a subset of the targets shows an expression change following sRNA overexpression. Shown are Volcano plots of RNA-seq results of gene expression change following sRNA overexpression. Gene expression change is represented by the log2 fold change in expression levels, as obtained from DESeq2 analysis (Love et al., 2014) (x axis). The statistical significance of the change is represented as −log10p (y axis). p is the p value corrected for multiple hypothesis testing (padj from DESeq2). For clarity, only genes with −log10p ≤ 20 are presented. Green dots represent the sRNA targets that were detected by RIL-seq applied to E. coli grown to a certain growth phase or condition (GcvB to exponential phase; MicA, ArcZ, and CyaR to stationary phase; and RyhB to exponential phase under iron limitation). Black dots represent the rest of the E. coli genes. The dashed line represents the statistical significance threshold (p ≤ 0.1). (B) sRNA targets detected by RIL-seq were enriched among genes showing a statistically significant change in expression level following overexpression of the sRNA (statistical significance of the enrichment was computed by hypergeometric test). Black numbers represent non-target genes showing a statistically significant change in expression (both up- and downregulated). Blue/green numbers represent RIL-seq targets that showed/did not show a statistically significant change in expression. See also Figures S1, S3, and S4, and Tables S1, S2, S3, and S4.
Figure 3
Figure 3
The sRNA Binding Site Dictates the Target Repertoire Common motifs identified in the sequences of RIL-seq targets of ArcZ WT, ArcZ with single mutation C71G (ArcZ M1), or ArcZ with three mutations C71T T72G G73A (ArcZ M2). For each version of ArcZ, the identified common motif is complementary to the corresponding sRNA binding site sequence. The ArcZ WT sequence is shown in black, and the mutations are in orange. The motifs and E values were determined by MEME (Bailey et al., 2009). See also Figure S2 and Table S5.
Figure 4
Figure 4
Both Affected and Unaffected Targets Contain a Complementary Sequence to the Binding Site of Their Interacting sRNA A bar plot representing the percentages of affected and unaffected targets containing complementary sequences to the binding site of the respective sRNA (Melamed et al., 2016). High percentages of targets with complementary binding sites were observed for both subsets of targets. Blue and orange bars represent the affected and unaffected targets, respectively. See also Tables S3 and S4.
Figure 5
Figure 5
The Interactions of the sRNA with Affected Targets Are Reproducibly Detected and Are More Abundant Than the Interactions with Unaffected Targets (A) Interactions with affected targets were identified in more replicate experiments than interactions with unaffected targets. A zero number of replicates represents interactions that were identified only in a unified library (i.e., unifying the results from all replicate experiments) (Melamed et al., 2016). The RIL-seq experiment included six, three, and three replicates for the exponential phase, stationary phase, and exponential phase under iron limitation, respectively. The RNA-seq experiment of GcvB was performed in the exponential phase; those of MicA, ArcZ, and CyaR were performed in the stationary phase; and that of RyhB was performed in the exponential phase under iron limitation. (B) Affected targets establish more interactions with the sRNA than do unaffected targets, as represented by the number of chimeric fragments (log10). Blue and orange colors represent the affected and unaffected targets, respectively. For each sRNA, n1 and n2 are the numbers of affected and unaffected targets, respectively. Statistical significance was assessed by Wilcoxon rank-sum test. See also Tables S3 and S4.
Figure 6
Figure 6
The Hfq Occupancy of Targets Correlates with Their Interaction Frequency (A) The predicted binding free energy of the duplex between the target and the sRNA is only weakly correlated with the sRNA-target interaction frequency (represented by the number of chimeric fragments). Binding free energy values (in kilocalories per mole) between two interacting RNAs were computed by RNAup (Mückstein et al., 2006). Spearman correlations coefficients are presented (p < 10−6 to p < 0.8). (B) The target’s Hfq occupancy is highly correlated with the sRNA-target interaction frequency. Presented is the correlation between the Hfq-target abundance (targetHfq, number of sequenced fragments representing the target abundance on Hfq) and the number of chimeric fragments. Numbers of sequenced fragments are presented by log10. Spearman correlation coefficients are presented (p < 10−51 to p < 10−16). Blue and orange dots represent the affected and unaffected targets, respectively. See also Tables S3 and S4.
Figure 7
Figure 7
The Binding Efficiency of a Target Transcript to Hfq Affects Its Regulatory Fate Competition between targets over binding to Hfq is a major determinant of the regulatory fate of the targets. Left panel: a target that binds Hfq efficiently will compete successfully with other targets over binding to Hfq, resulting in more interactions with the sRNA and a change in expression. Right panel: a target that is an inefficient Hfq binder will not succeed in competing with other targets over binding to Hfq, resulting in a low number of sRNA-target interactions and no effect on the expression level of the target. Green circles represent Hfq monomers. Green, blue, and orange waved lines represent a target RNA, an affected target RNA, and an unaffected target RNA, respectively. The sRNA is depicted in purple.

References

    1. Argaman L., Hershberg R., Vogel J., Bejerano G., Wagner E.G., Margalit H., Altuvia S. Novel small RNA-encoding genes in the intergenic regions of Escherichia coli. Curr. Biol. 2001;11:941–950. - PubMed
    1. Baba T., Ara T., Hasegawa M., Takai Y., Okumura Y., Baba M., Datsenko K.A., Tomita M., Wanner B.L., Mori H. Construction of Escherichia coli K-12 in-frame, single-gene knockout mutants: the Keio collection. Mol. Syst. Biol. 2006 2006.0008. - PMC - PubMed
    1. Baek D., Villén J., Shin C., Camargo F.D., Gygi S.P., Bartel D.P. The impact of microRNAs on protein output. Nature. 2008;455:64–71. - PMC - PubMed
    1. Bailey T.L., Boden M., Buske F.A., Frith M., Grant C.E., Clementi L., Ren J., Li W.W., Noble W.S. MEME SUITE: tools for motif discovery and searching. Nucleic Acids Res. 2009;37:W202–W208. - PMC - PubMed
    1. Beisel C.L., Updegrove T.B., Janson B.J., Storz G. Multiple factors dictate target selection by Hfq-binding small RNAs. EMBO J. 2012;31:1961–1974. - PMC - PubMed

Publication types

MeSH terms

LinkOut - more resources