. 2020 Mar 3;30(9):3149-3163.e6.
doi: 10.1016/j.celrep.2020.02.008.

Dynamic Interstitial Cell Response during Myocardial Infarction Predicts Resilience to Rupture in Genetically Diverse Mice

Affiliations

Dynamic Interstitial Cell Response during Myocardial Infarction Predicts Resilience to Rupture in Genetically Diverse Mice

Elvira Forte et al. Cell Rep. .

Abstract

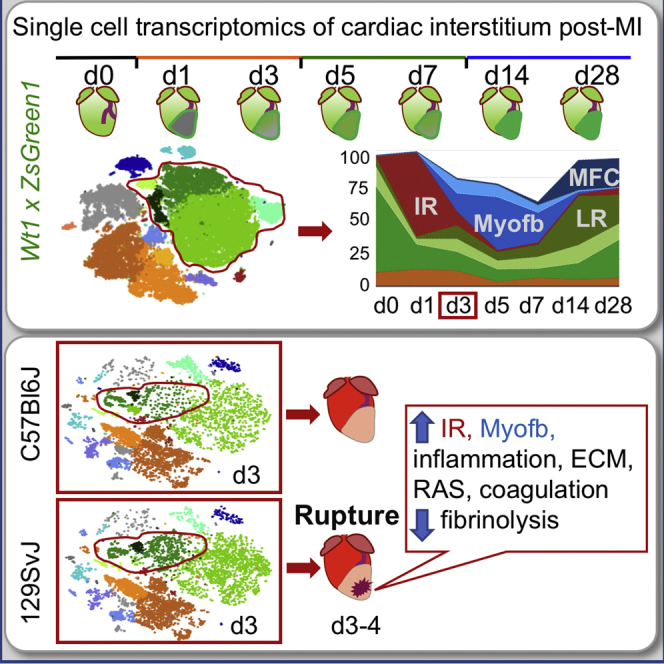
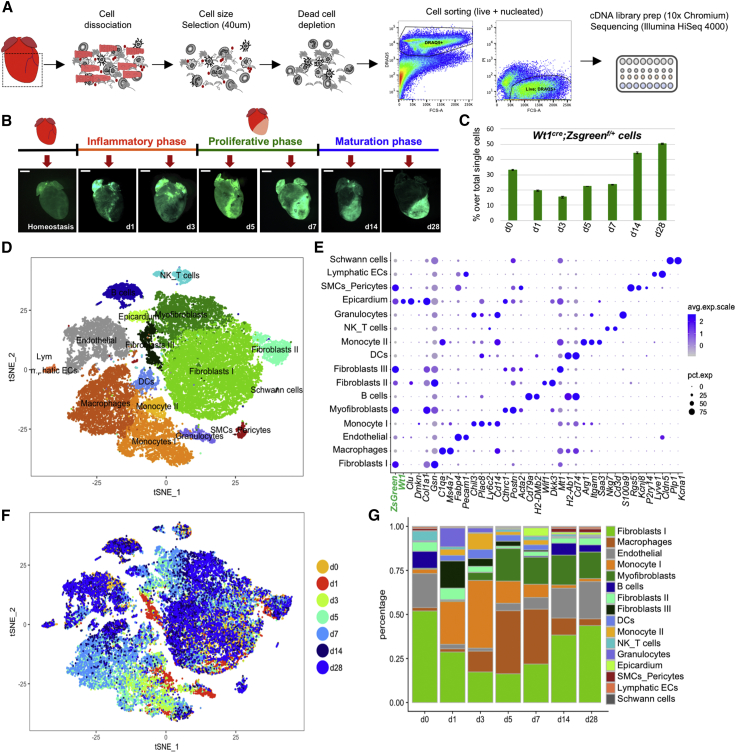
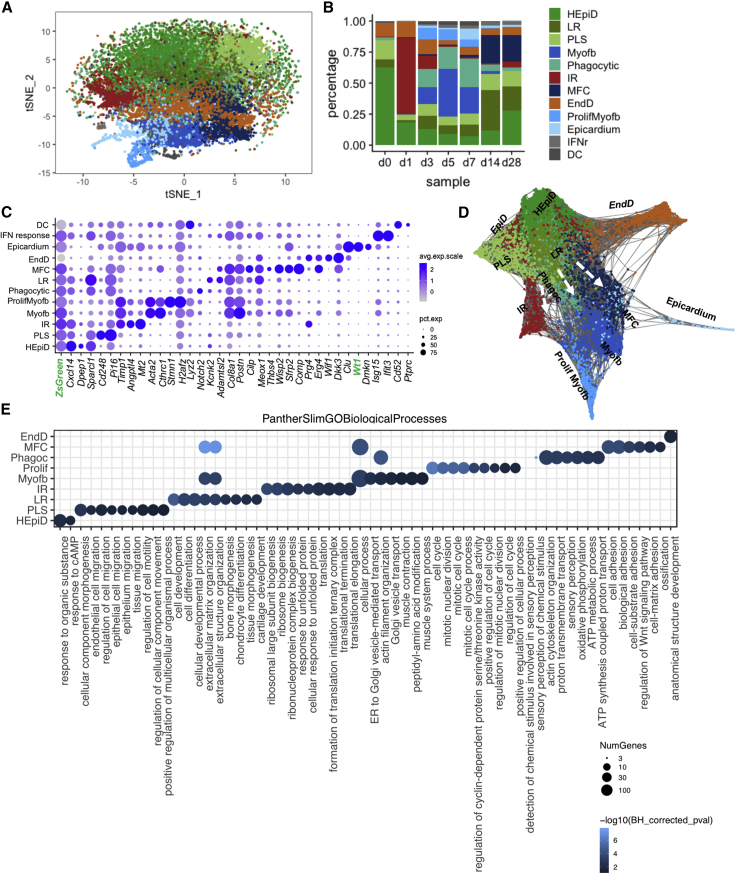
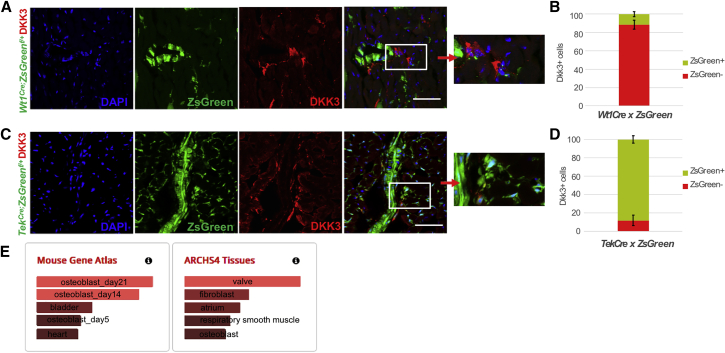
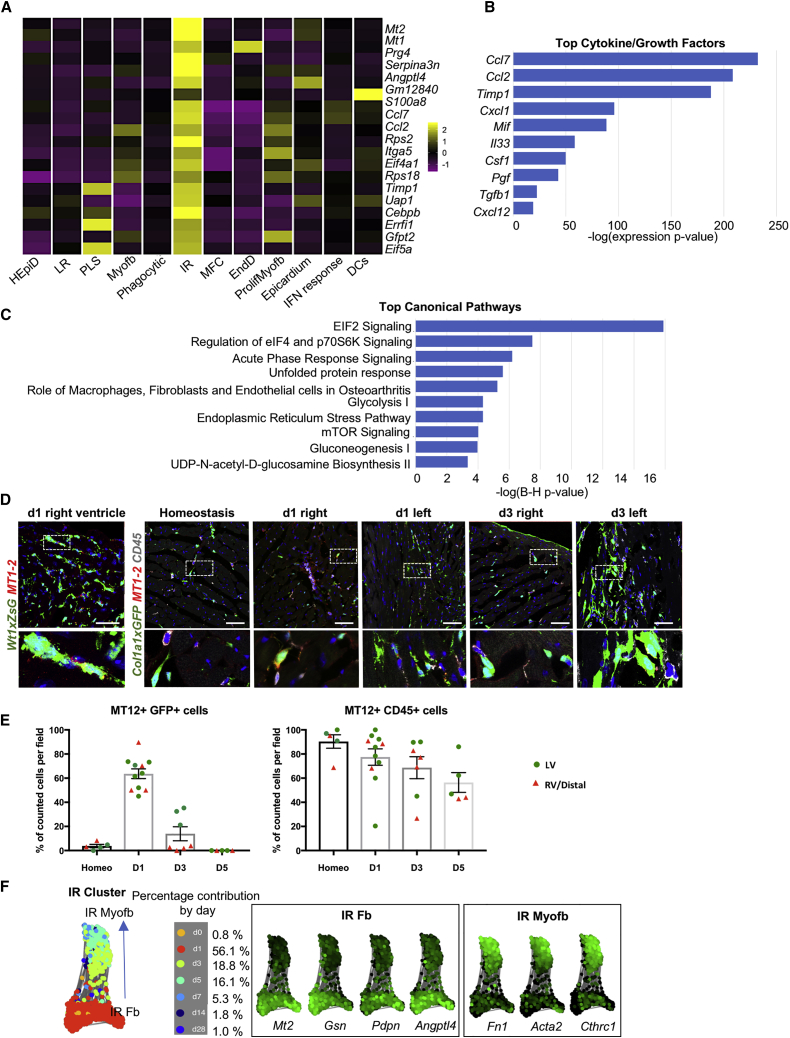
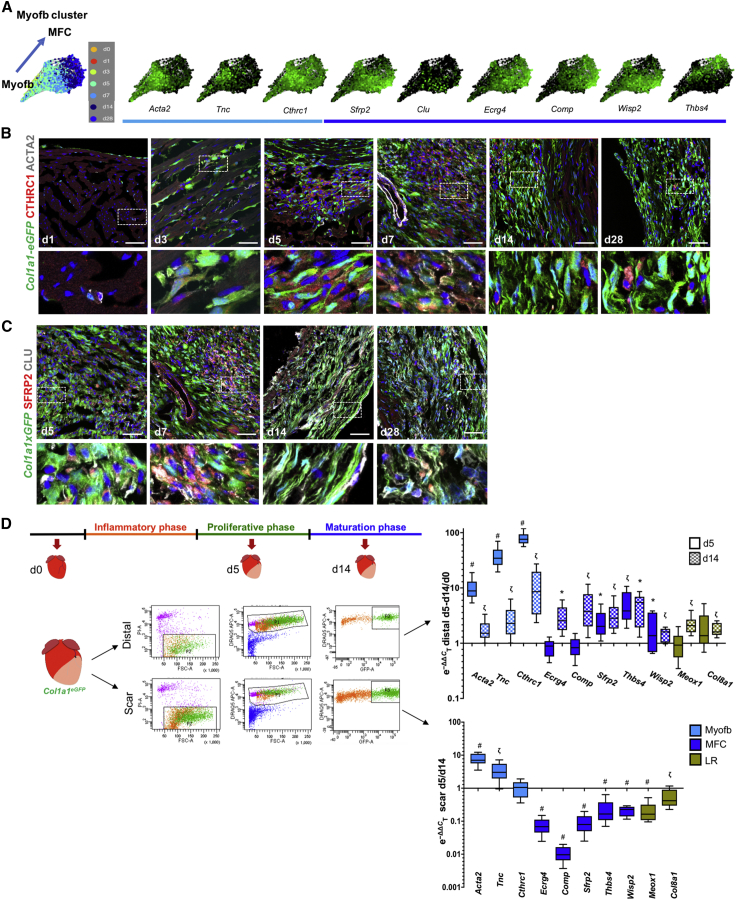
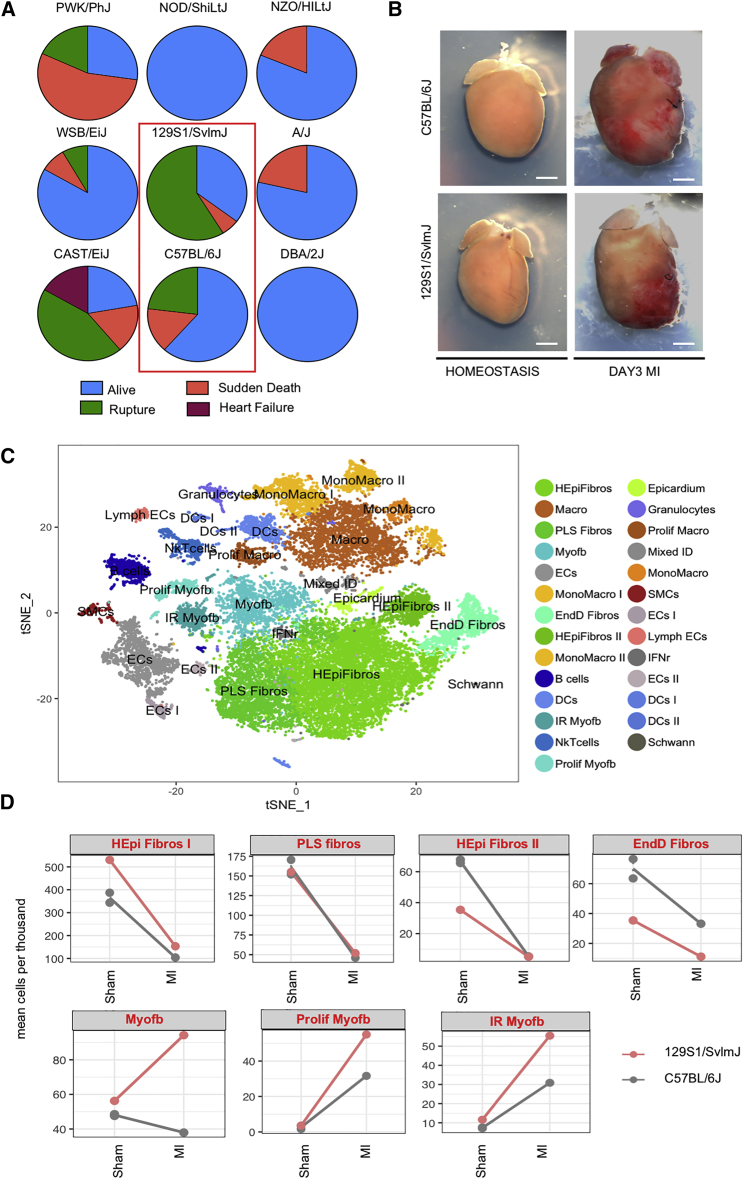
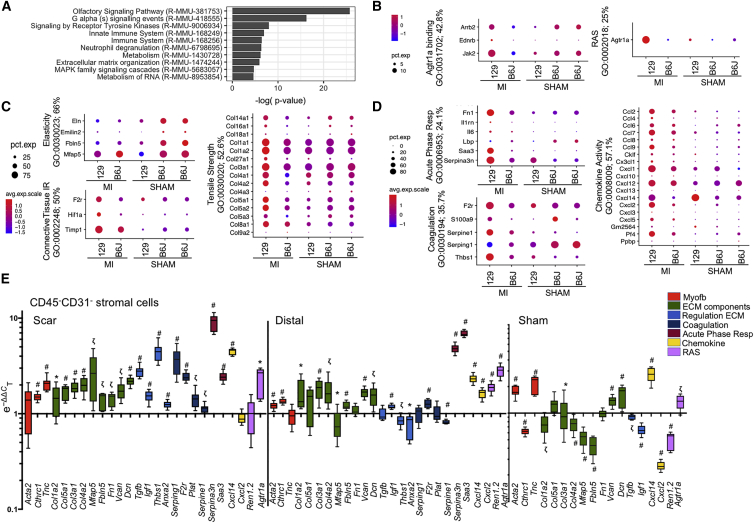
Cardiac ischemia leads to the loss of myocardial tissue and the activation of a repair process that culminates in the formation of a scar whose structural characteristics dictate propensity to favorable healing or detrimental cardiac wall rupture. To elucidate the cellular processes underlying scar formation, here we perform unbiased single-cell mRNA sequencing of interstitial cells isolated from infarcted mouse hearts carrying a genetic tracer that labels epicardial-derived cells. Sixteen interstitial cell clusters are revealed, five of which were of epicardial origin. Focusing on stromal cells, we define 11 sub-clusters, including diverse cell states of epicardial- and endocardial-derived fibroblasts. Comparing transcript profiles from post-infarction hearts in C57BL/6J and 129S1/SvImJ inbred mice, which displays a marked divergence in the frequency of cardiac rupture, uncovers an early increase in activated myofibroblasts, enhanced collagen deposition, and persistent acute phase response in 129S1/SvImJ mouse hearts, defining a crucial time window of pathological remodeling that predicts disease outcome.

Keywords: Seurat; cardiac rupture; epicardial-derived; fibrosis; genetic diversity; heart; mouse; myocardial infarction; scRNAseq; single-cell biology.


Conflict of interest statement

Declaration of Interests The authors declare no competing interests.

Figures

None
Graphical abstract
Figure 1
Figure 1
Single-Cell RNA-Seq of Interstitial Cells Post-MI Reveals Population Dynamics in Cardiac Repair (A) Murine cardiac interstitial cells were isolated by mechanical and enzymatic dissociation of adult mouse cardiac ventricular tissue (dashed square); mesh purification, magnetic dead cell depletion, and sorting were performed to exclude cardiomyocytes and apoptotic or necrotic cells before analysis. A total of 38,600 cells were captured and sequenced (n = 7 mice). (B) Selected time points and whole-mount images of Wt1cre;ZsGreenf/+ mice used to trace epicardial-derived components in the cardiac interstitium. (C) Percentage of single live nucleated ZsGreen+ interstitial cells detected by flow cytometry in the samples used for scRNAseq. Data shown as mean ± SD of two technical replicates at each time point. (D) t-Distributed stochastic neighbor embedding (t-SNE) plot of the aggregate of all sequenced cells across time points. Seurat analysis with 24 PC and resolution 0.5 was used to define 16 main clusters. (E) Dot-plot visualization of top marker genes used to identify clusters. Dot sizes denote percentage of expression per cluster; color gradient defines average expression per cell. (F) t-SNE plot showing cell contribution by time point identified by color. (G) Bar plot of percentage of cluster contributions per time point. See also Figures S1 and S2 and Tables S1 and S2.
Figure 2
Figure 2
Evolution of Fibroblast States across Phases of Repair (A) t-SNE plot of combined stromal clusters (fibroblasts I, II, and III, myofibroblasts) and epicardium, further sub-clustered by 20 PC, resolution 0.5, colored by cluster separation. (B) Bar plot representation of the relative frequency of different fibroblast sub-clusters (percentage over total cells) at different time points across repair. (C) Dot-plot representation of top two signature genes per sub-cluster. (D) SPRING visualization of fibroblast sub-clusters; 1,200 cells are shown per time point, colored by Seurat-defined clusters. (E) PANTHER GO-slim biological process overrepresentation analysis of fibroblasts sub-cluster marker genes, showing representative GO terms per each sub-cluster, excluding DCs, dendritic-like cells, and IFNr (interferon-responsive cells). Bonferroni corrected p values. See also Figures S2–S4 and Tables S3 and S4.
Figure 3
Figure 3
Endocardial-Derived Fibroblast (EndD) Validation in Homeostatic Ventricles (A) Confocal imaging of the EndD marker DKK3 (in red) on cardiac sections from adult Wt1Cre; ZsGreenf/+ mice. ZsGreen labels epicardial derived cells. (B) Quantification of the percentage of DKK3+ cells co-labelled with the reporter ZsGreen. Data are represented as mean ± SEM. N = 3 biological replicates, 7 technical replicates. (C) Confocal imaging of DKK3 (in red) on cardiac sections from adult TekCre; ZsGreenf/+ mice. ZsGreen labels endocardial-derived cells. (D) Quantification of the percentage of DKK3+ cells co-labelled with the reporter ZsGreen. Data are represented as mean ± SEM. N = 3 biological replicates, 7 technical replicates.(E) Enrichr analysis of EndD marker genes identified top related cell (mouse gene atlas) and tissue (ARCHS4 tissues) types. See also Figure S4 and Tables S3 and S4.
Figure 4
Figure 4
An Epicardial-Derived Injury Response (IR) Fibroblast Population in the Early Phase of Repair Post-MI (A) Heatmap of the average expression of the top 20 signature IR cluster genes across all fibroblast sub-clusters. (B) Top cytokines and chemokines produced by the IR cluster. (C) Top IR cluster canonical pathways identified using Ingenuity Pathway Analysis (IPA). (D) Confocal imaging of MT1-2 staining in IR fibroblasts at d1 and d3 post-MI using Wt1cre;ZsGreenf/+ and Col1a1eGFP reporter mice. (E) Scatterplot showing the percentage of MT1-2+ cells co-labeled with the reporter Col1a1eGFP or CD45 (gray). A total of 5–10 frames were counted per each time point, 2–3 mice per time point. Data are represented as means ± SEMs. LV (green dot) is the left ventricle injury site; RV/Distal (red triangle), right ventricle, area distal from the injury site. (F) SPRING visualization of the IR sub-cluster showing time course evolution of cluster identity (blue arrow) from fibroblast (Fb) to myofibroblast (Myofb). Plots on right panels show marker genes that distinguish early (Fb) from late (Myofb) IR cells. Scale bars, 50 μm. See also Figure S4 and Tables S3 and S4.
Figure 5
Figure 5
Contribution of Myofibroblasts (Myofb), Matrifibrocytes (MFCs), and Late Response Fibroblasts (LR) to Ventricular Remodeling Post-MI (A) knn SPRING visualization of the Myofb cluster identified from analysis of the stromal aggregate across 7 time points (PC24, resolution 0.5), colored by time and by the expression of early Myofb marker genes (Acta2, Tnc, Cthrc1, light blue) and MFC marker genes (Sfrp2, Clu, Ecrg4, Comp, Wisp2, Thsb4). (B and C) Confocal imaging of adult hearts from Col1a1eGFP mice, used as a genetic marker for stromal cells. (B) Myofb markers CTHRC1 (red) and ACTA2 (white) and (C) MFC markers SFRP2 (red) and CLU (white) at different time points post-MI. (D) qPCR validation of additional Myofb (light blue), MFC (dark blue), and LR (olive green) markers on live nucleated stromal cells (PI, DRAQ5+, EGFP+) sorted from Col1a1eGFP transgenic hearts. Scar or distal areas were dissected and separately processed for sorting from control (n = 3) or d5 (n = 3) and d14 (n = 3) post-MI ventricular tissue. Data are summarized as box and whisker plots, indicating the median value (black bar inside box), 25th and 75th percentiles (bottom and top of box, respectively), and minimum and maximum values (bottom and top whisker, respectively). Statistical significance (p < 0.05, ζp < 0.001, #p < 0.0001) was calculated per each gene by two-tailed unequal variance Student’s t test between sample (distal d5, distal d14, scar d5) and correspondent reference used for normalization (distal d0, scar d14). Scale bars, 50 μm. See also Figure S4 and Tables S3 and S4.
Figure 6
Figure 6
Differential Rupture Rate and Stromal Cell Response across Inbred Murine Strains (A) Pie charts showing 1-month survival rate post-MI of 9 inbred strains with different susceptibilities to cardiovascular dysfunction, including diabetes (NOD/ShiLtJ, n = 13), obesity (NZO/HILtJ, n = 16), hypertension (129S1/SvlmJ, n = 34), calcification (DBA/2J; n = 9), dystrophic myopathy (A/J; n = 14), and wild-derived strains (CAST/EiJ, n = 18; WSB/EiJ, n = 12 and PWK/PhJ, n = 11). C57BL/6J was used as a control (n = 13). (B) Representative whole-mount images of 129S1/SvlmJ and C57BL/6J hearts at homeostasis and d3 post-MI. (C) t-SNE plot of combined interstitial cells from C57BL/6J and 129S1/SvlmJ hearts (B6J sham, n = 2, 4,710 cells; 129 sham, 4,213 cells; d3 MI B6J, 3,950 cells; d3 MI 129, 4,128 cells). Twenty-seven clusters were obtained using unbiased clustering. (D) Relative ratio of various stromal cell populations in 129 and B6J hearts at d3 sham or MI (mean cells per thousand). Two B6J sham samples were used to show consistency between biological replicates. See also Figures S5 and S6 and Table S5.
Figure 7
Figure 7
Differential Pro-inflammatory and Secretory Phenotypes and ECM Composition between 129 and B6J Cardiac Stromal Cells (A) PANTHER Reactome pathway analysis of 3,922 differentially expressed genes (FC ≥ 2; p < 0.01) between sham or d3 post-MI 129 and B6J stromal cells. (B–D) Dot plots showing the percentage and intensity of expression of genes within representative GO terms related to angiotensin response (B), ECM composition (C), and acute phase response and coagulation (D) across all of the samples. Two B6J sham samples were used to show consistency of change between biological replicates. Percentage scores denote the number of genes within the GO term that are represented in the list of differentially expressed genes. (E) qPCR validation of gene changes across samples. Sorted CD45/CD31 stromal cells were isolated from adult 129 and B6J d3 sham or post-MI hearts (n = 3 biological and technical). Target genes were grouped as Myofb markers, ECM components, genes regulating ECM composition, coagulation, acute phase response, chemokine activity, and renin-angiotensin system (RAS). Data are summarized as box and whisker plots, indicating the median value (black bar inside box), 25th and 75th percentiles (bottom and top of box, respectively), and minimum and maximum values (bottom and top whisker, respectively). Statistical significance (p < 0.05, ζp < 0.001, #p < 0.0001) per each gene was calculated by two-tailed unequal variance Student’s t test, comparing expression values in 129 versus B6J reference samples used for normalization. See also Figures S7–S9 and Tables S6 and S7.

References

    1. Ackers-Johnson M., Tan W.L.W., Foo R.S. Following hearts, one cell at a time: recent applications of single-cell RNA sequencing to the understanding of heart disease. Nat. Commun. 2018;9:4434. - PMC - PubMed
    1. Arlein W.J., Shearer J.D., Caldwell M.D. Continuity between wound macrophage and fibroblast phenotype: analysis of wound fibroblast phagocytosis. Am. J. Physiol. 1998;275:R1041–R1048. - PubMed
    1. Barrick C.J., Rojas M., Schoonhoven R., Smyth S.S., Threadgill D.W. Cardiac response to pressure overload in 129S1/SvImJ and C57BL/6J mice: temporal- and background-dependent development of concentric left ventricular hypertrophy. Am. J. Physiol. Heart Circ. Physiol. 2007;292:H2119–H2130. - PubMed
    1. Bates E.R. Reperfusion therapy reduces the risk of myocardial rupture complicating ST-elevation myocardial infarction. J. Am. Heart Assoc. 2014;3:e001368. - PMC - PubMed
    1. Baum J., Duffy H.S. Fibroblasts and myofibroblasts: what are we talking about? J. Cardiovasc. Pharmacol. 2011;57:376–379. - PMC - PubMed

Publication types