Review
. 2020 Mar 2;9(3):668.
doi: 10.3390/jcm9030668.

Fourier-Domain OCT Imaging of the Ocular Surface and Tear Film Dynamics: A Review of the State of the Art and an Integrative Model of the Tear Behavior During the Inter-Blink Period and Visual Fixation

Affiliations
Review

Fourier-Domain OCT Imaging of the Ocular Surface and Tear Film Dynamics: A Review of the State of the Art and an Integrative Model of the Tear Behavior During the Inter-Blink Period and Visual Fixation

Pietro Emanuele Napoli et al. J Clin Med. .

Abstract

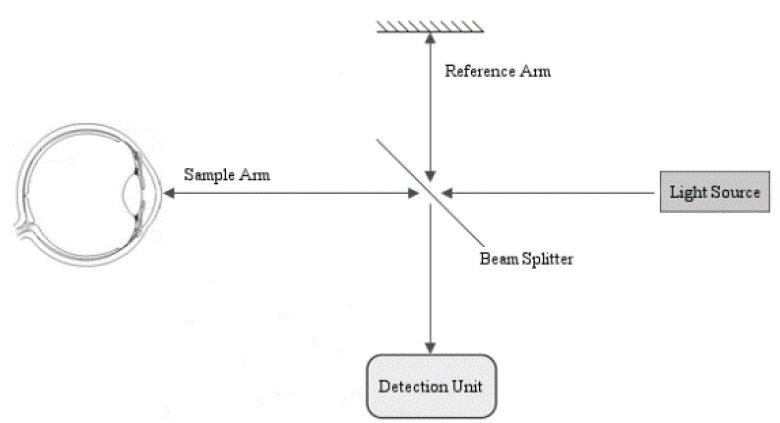
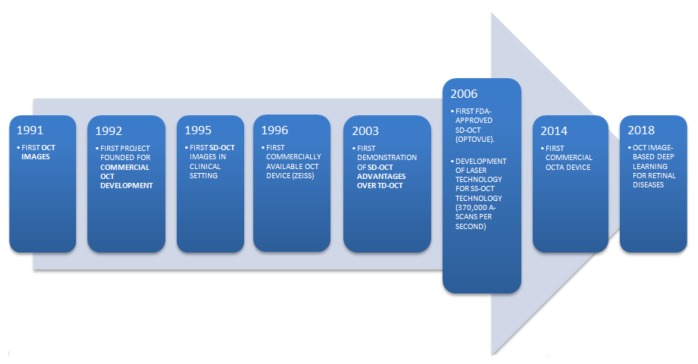
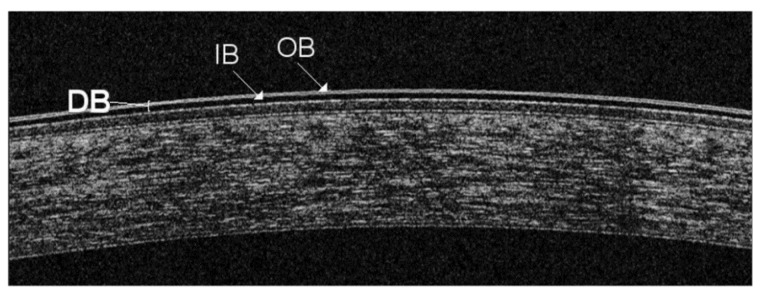
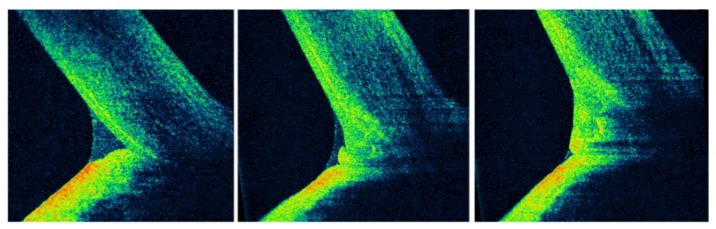
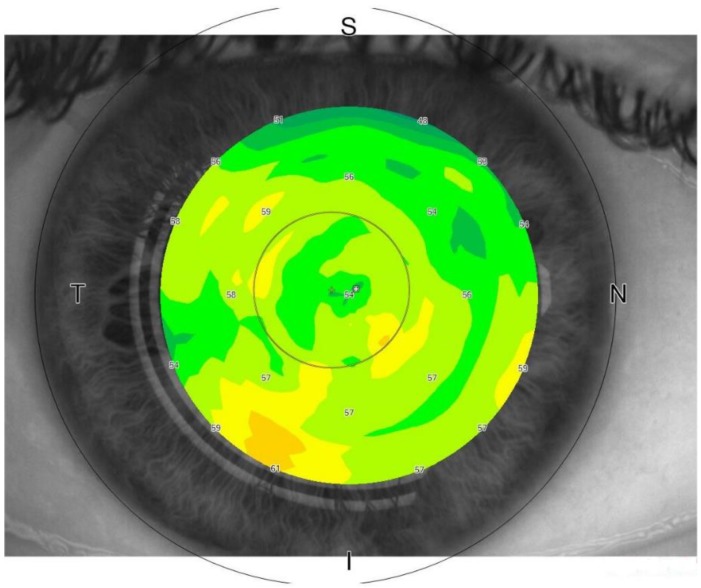
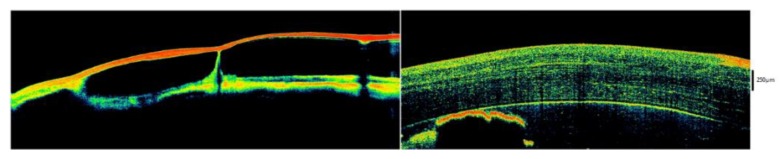
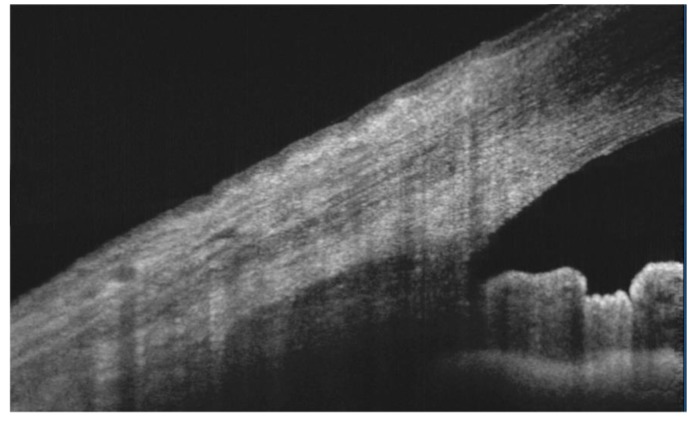
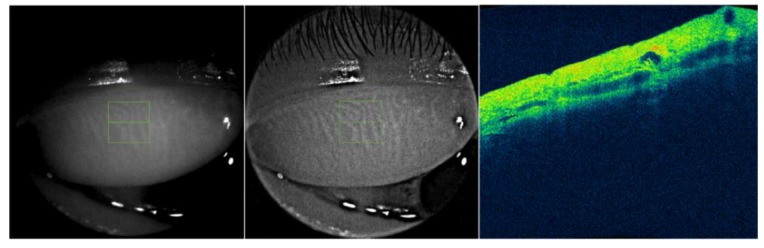
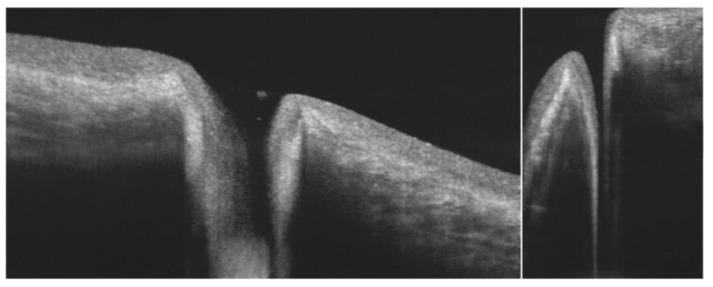
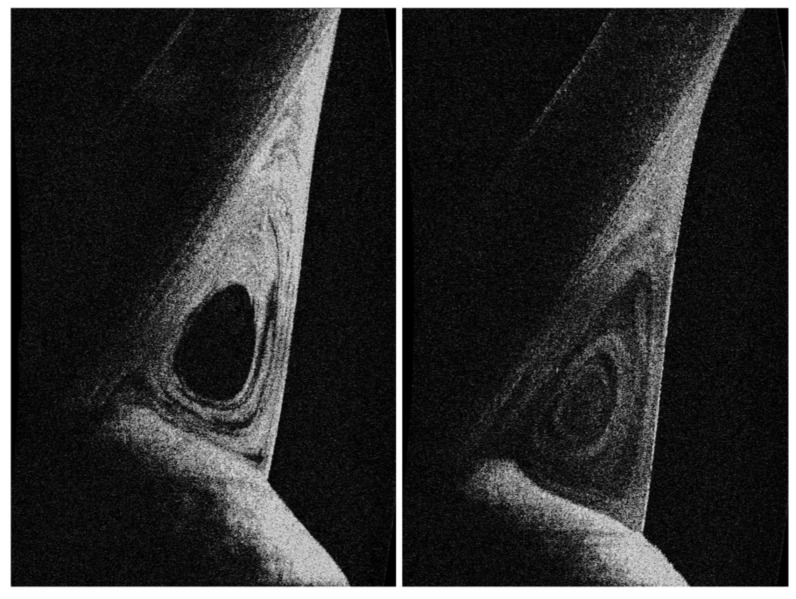
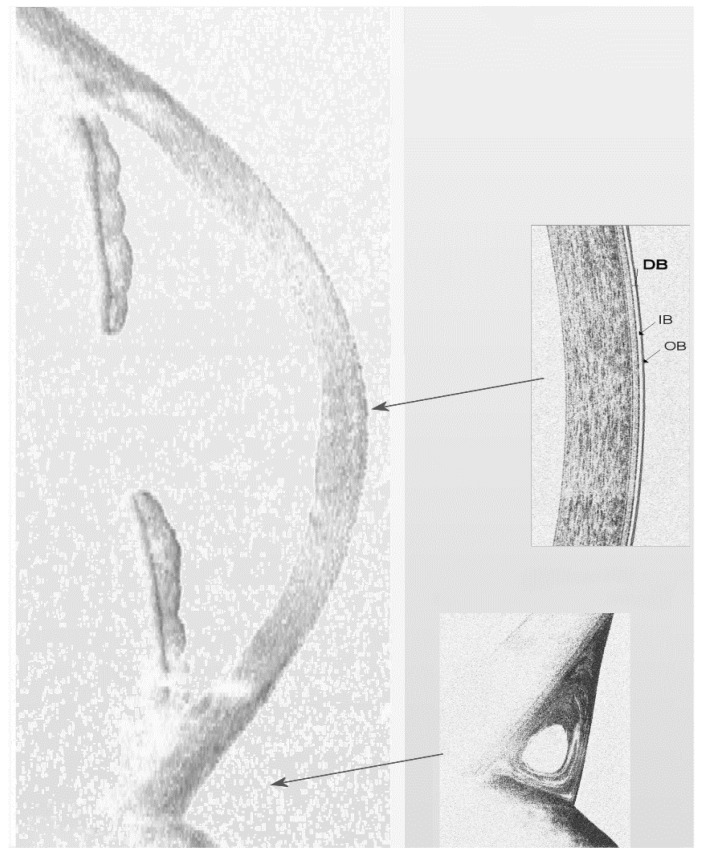
In the last few decades, the ocular surface and the tear film have been noninvasively investigated in vivo, in a three-dimensional, high resolution, and real-time mode, by optical coherence tomography (OCT). Recently, OCT technology has made great strides in improving the acquisition speed and image resolution, thus increasing its impact in daily clinical practice and in the research setting. All these results have been achieved because of a transition from traditional time-domain (TD) to Fourier-domain (FD) technology. FD-OCT devices include a spectrometer in the receiver that analyzes the spectrum of reflected light on the retina or ocular surface and transforms it into information about the depth of the structures according to the Fourier principle. In this review, we summarize and provide the state-of-the-art in FD-OCT imaging of the ocular surface system, addressing specific aspects such as tear film dynamics and epithelial changes under physiologic and pathologic conditions. A theory on the dynamic nature of the tear film has been developed to explain the variations within the individual compartments. Moreover, an integrative model of tear film behavior during the inter-blink period and visual fixation is proposed.

Keywords: ocular surface; optical coherence tomography; tear film; tear film dynamics; visual fixation.


Conflict of interest statement

Pietro Emanuele Napoli, Matteo Nioi, Lorenzo Mangoni, Pietro Gentile, Mirco Braghiroli, Ernesto d’Aloja, Maurizio Fossarello– none to declare. No conflicting relationship exists for any author.

Figures

Figure 1
Figure 1
Schematic view of a Fourier-domain (FD) optical coherence tomography (OCT). Components include: reference mirror, sample (in our case, ocular structures), beam splitter, detection unit (a spectrometer or a point detector), and light source (a superluminescent diode or a swept-source laser) [13]. Reference mirror (the line at the top) with associated “reference arm”.
Figure 2
Figure 2
Time-domain (TD) optical coherence tomography (OCT) imaging of the anterior segment. Although the TD-OCT platform was commercialized as the first OCT system specifically conceived for anterior segment imaging (Visante OCT), it clearly provides an inadequate resolution to analyze in detail the fine changes in the tear dynamics and ocular surface epithelia. However, an interesting feature of TD systems may be represented by the wide field of view (scan depth and width) of the ocular surface profile and anterior segment structures.
Figure 3
Figure 3
A timeline of optical coherence tomography (OCT) imaging. In 1991, David Huang was the first to demonstrate the applicability of low-coherence interferometry in the quantitative assessment of biological systems [13]. The transition from traditional time-domain (TD) to Fourier-domain (FD) technology, which includes spectral-domain (SD) and swept-source (SS) platforms, required clinical feasibility studies, entrepreneurship and business support in order to obtain clinical acceptance and further developments.
Figure 4
Figure 4
Enhanced imaging of the precorneal tear film (TF) by spectral domain (SD) optical coherence tomography (OCT). Although the axial resolution of SD-OCT systems (~ 5 µm) is close to the precorneal TF thickness in healthy subjects, TF can be increased in volume by means of an enhancer in order to be detected and monitored over time. Thus, a double-band structure (DB) of the precorneal TF, made by an inner (IB) and outer (OB) layer of opposite reflectivity can be visualized above the central cornea [27]. It is necessary to maintain a predetermined range of temperature (15 °C–25 °C) and humidity (30%–50%) in a dimly lit consulting room to standardize the OCT scanning protocol [4].
Figure 5
Figure 5
Optical coherence tomography (OCT) imaging of the lower tear meniscus (LTM), lid-parallel conjunctival folds (LIPCOFs), and conjunctivochalasis. The qualitative and quantitative features of the LTM are clearly visible in cross section by means of OCT (left). However, this approach may be invalidated by the presence of LIPCOFs (middle) or conjunctivochalasis (right) [42].
Figure 6
Figure 6
Swept-source (SS) optical coherence tomography (OCT) imaging of the corneal epithelium thickness. The thickness of the corneal epithelium can be accurately quantified by OCT imaging at the central vertex and in the peripheral zones. (Sectors were as follows: N: nasal; T: temporal; S: superior; I: inferior). Reflectivity of the en-face OCT image indicates the corneal epithelial thickness (low intensity (dark blue) ≤ 25 μm to high intensity (red/white) ≥ 85 μm).
Figure 7
Figure 7
Degeneration of the ocular surface epithelia by portable optical coherence tomography (OCT). Using a portable spectral-domain (SD) OCT in research setting, a progressive degeneration of the ocular surface epithelia and underlying layers can be monitored over time in absence of a physiological tear production. The structural disorganization of the ocular surface epithelia (left), or the loss of corneal epithelium (right), is noninvasively revealed by OCT imaging [59,60,61]. Reflectivity of the en-face OCT image [low intensity = dark/blue to high intensity = red].
Figure 8
Figure 8
Optical coherence tomography (OCT) imaging of the ocular surface epithelia. The epithelia of the ocular surface (especially conjunctiva, limbus, and cornea) can be accurately visualized and quantified by OCT imaging (as a continuous, hypo-reflective structure). This approach may be useful to diagnose and monitor a wide variety of pathological situations (see text).
Figure 9
Figure 9
Fourier-domain (FD) optical coherence tomography (OCT) imaging of meibomian glands. Commercial FD-OCTs and custom-built systems can reveal the architecture of meibomian glands and their internal structure. A simple technique to obtain an infrared (IR) meibography by OCT is based on the modulation of image contrast and brightness until an adequate enhancement is achieved. An unmodified IR OCT image of the everted upper lid is displayed (left). After image processing (middle), the same enhanced image can disclose the glandular tissue in detail. Moreover, in cross-sectional OCT scans, it is also possible to detect the internal features of meibomian glands (right) [87]. Black-and-white pictures before (left) [default values of contrast and brightness = 1]) and after (right) [percentage increase in contrast = 140%, percentage decrease in brightness = 6%] image manipulation. Reflectivity of the en-face OCT image (right) [low intensity = dark/blue to high intensity = red].
Figure 10
Figure 10
Lacrimal punctal region by optical coherence tomography (OCT). The anatomy of vertical canaliculus and lacrimal punctal region can be directly imaged by commercial OCT systems [89,90].
Figure 11
Figure 11
Clearance of human tears in contrast-enhanced optical coherence tomography (OCT) imaging. The flow of lipids in the lower tear meniscus can be reliably observed by OCT imaging after administration of a lipid-based tracer. The latter represents a contrast agent to improve the detection of tear film dynamics. Of note, a vortex pattern in tear distribution may be disclosed in the inter-blink period. OCT imaging was performed in the same conditions of temperature (15 °C–25 °C) and humidity (30%–50%) in a dimly light room [102].
Figure 12
Figure 12
The integrative model of tear film behavior during the inter-blink period and visual fixation. In cross section, it is possible to detect, by optical coherence tomography (OCT), the behavior of the precorneal tear film (TF) as modification over time of the double-band (DB) structure. The latter consists of an inner (IB) and an outer (OB) layer of different reflectivity (small arrows). In addition, the high fluid dynamics of the tear meniscus evidenced by the presence of the vortex distribution pattern (after using a lipid-based tracer that enhances the reflectivity of tears) can also be seen. The continuous dynamism of the TF is the starting point of the model. Within the various areas of the ocular surface, the tear turnover should not be believed as a constant and single parameter since it has proved to be different, for instance, in the precorneal region (large arrow at the top) or in the menisci (large arrow at the bottom). Likewise, the various compounds (e.g., lipids, aqueous, or mucins) also revealed a different washout time. Intriguingly, as demonstrated by OCT imaging, there exists an inverse relationship between the tear clearance above the precorneal surface and that of the menisci, which may dynamically change (even reverse) as the environmental and bodily conditions evolve (e.g., dry eyes exhibit “opposite” behavior with respect to healthy eyes). Moreover, although the precorneal TF in healthy subjects shows an absent or very low clearance during visual fixation, it finely vibrates due to small eye movements, thus supporting a non-quiescent model of human tears.

Similar articles

Cited by

References

    1. Barabino S., Chen Y., Chauhan S., Dana R. Ocular surface immunity: Homeostatic mechanisms and their disruption in dry eye disease. Progr. Retin. Eye Res. 2012;31:271–285. doi: 10.1016/j.preteyeres.2012.02.003. - DOI - PMC - PubMed
    1. Bolanos-Jimenez R., Navas A., López-Lizárraga E.P., de Ribot F.M., Peña A., Graue-Hernández E.O., Garfias Y. Ocular surface as barrier of innate immunity. Open Ophthalmol. J. 2015;9:49–55. doi: 10.2174/1874364101509010049. - DOI - PMC - PubMed
    1. Foulks G. Challenges and pitfalls in clinical trials of treatments for dry eye. Ocul. Surf. 2003;1:20–30. doi: 10.1016/S1542-0124(12)70004-6. - DOI - PubMed
    1. Wolffsohn J.S., Arita R., Chalmers R., Djalilian A., Dogru M., Dumbleton K., Gupta P.K., Karpecki P., Lazreg S., Pult H., et al. TFOS DEWS II Diagnostic Methodology report. Ocul. Surf. 2017;15:539–574. doi: 10.1016/j.jtos.2017.05.001. - DOI - PubMed
    1. McGinnigle S., Naroo S.A., Eperjesi F. Evaluation of dry eye. Surv. Ophthalmol. 2012;57:293–316. doi: 10.1016/j.survophthal.2011.11.003. - DOI - PubMed

LinkOut - more resources