

Transcriptome sequencing and whole genome expression profiling of hexaploid sweetpotato under salt stress
- PMID: 32131729
- PMCID: PMC7057664
- DOI: 10.1186/s12864-020-6524-1
Transcriptome sequencing and whole genome expression profiling of hexaploid sweetpotato under salt stress
Abstract
Background: Purple-fleshed sweetpotato (PFSP) is one of the most important crops in the word which helps to bridge the food gap and contribute to solve the malnutrition problem especially in developing countries. Salt stress is seriously limiting its production and distribution. Due to lacking of reference genome, transcriptome sequencing is offering a rapid approach for crop improvement with promising agronomic traits and stress adaptability.
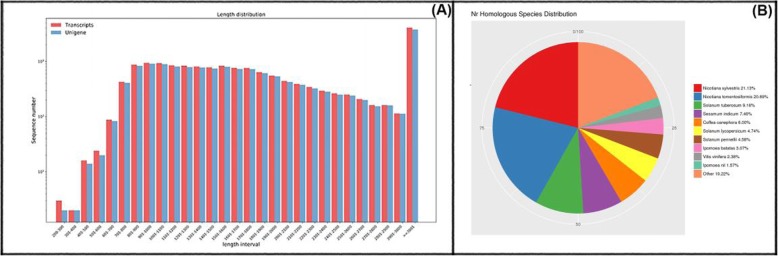
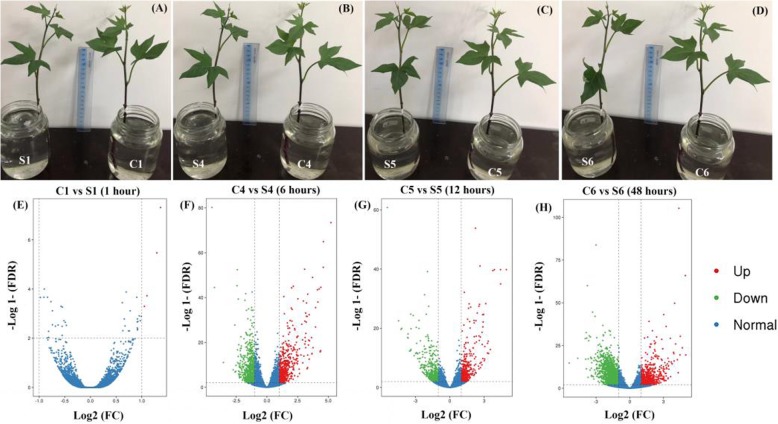
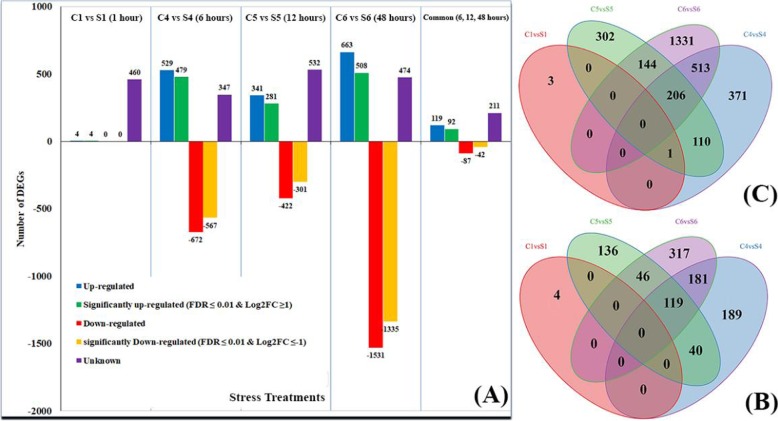
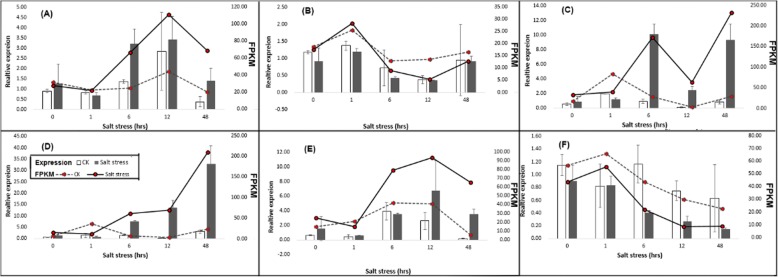
Results: Five cDNA libraries were prepared from the third true leaf of hexaploid sweetpotato at seedlings stage (Xuzi-8 cultivar) treated with 200 mM NaCl for 0, 1, 6, 12, 48 h. Using second and third generation technology, Illumina sequencing generated 170,344,392 clean high-quality long reads that were assembled into 15,998 unigenes with an average length 2178 base pair and 96.55% of these unigenes were functionally annotated in the NR protein database. A number of 537 unigenes failed to hit any homologs which may be considered as novel genes. The current results indicated that sweetpotato plants behavior during the first hour of salt stress was different than the other three time points. Furthermore, expression profiling analysis identified 4, 479, 281, 508 significantly expressed unigenes in salt stress treated samples at the different time points including 1, 6, 12, 48 h, respectively as compared to control. In addition, there were 4, 1202, 764 and 2195 transcription factors differentially regulated DEGs by salt stress at different time points including 1, 6, 12, 48 h of salt stress. Validation experiment was done using 6 randomly selected unigenes and the results was in agree with the DEG results. Protein kinases include many genes which were found to play a vital role in phosphorylation process and act as a signal transductor/ receptor proteins in membranes. These findings suggest that salt stress tolerance in hexaploid sweetpotato plants may be mainly affected by TFs, PKs, Protein Detox and hormones related genes which contribute to enhance salt tolerance.
Conclusion: These transcriptome sequencing data of hexaploid sweetpotato under salt stress conditions can provide a valuable resource for sweetpotato breeding research and focus on novel insights into hexaploid sweetpotato responses to salt stress. In addition, it offers new candidate genes or markers that can be used as a guide to the future studies attempting to breed salt tolerance sweetpotato cultivars.
Keywords: Expression profile; Hexaploid sweetpotato; RNA-sequencing; Salt stress; Transcriptome.
Conflict of interest statement
The authors declare that they have no competing interests.
Figures
References
-
- Troung VD, Avula RY, Pecota K, Yencho CG. Sweet potatoes. In: SINHA NK, editor. Handbook of vegetables and vegetable processing. New Jersey: Wiley-Blackwell; 2011. pp. 717–737.
-
- Bouwkamp JC. Introduction-part 1. In: Bouwkamp JC, editor. Sweet potato products: a natural resource for the tropics. Boca Raton: CRC Press; 1985. pp. 3–7.
-
- Zörb C, Geilfus CM, Dietz KJ. Salinity and crop yield. Plant Biol German Soc Plant Sci. 2019;21:31–38. - PubMed
-
- Majeed A, Muhammad Z. Salinity: a major agricultural problem—causes, impacts on crop productivity and management strategies. In: Hasanuzzaman M, Hakeem K, Nahar K, Alharby H, editors. Plant abiotic stress tolerance. Cham: Springer; 2019. pp. 83–99.
-
- Bhadauria V. Next-generation sequencing and bioinformatics for plant science. Wymondham: Caister Academic Press; 2017.
MeSH terms
Substances
LinkOut - more resources
Full Text Sources
Miscellaneous
