. 2020 Apr 10;7(2):ENEURO.0305-18.2020.
doi: 10.1523/ENEURO.0305-18.2020. Print 2020 Mar/Apr.

Circuit and Cellular Mechanisms Facilitate the Transformation from Dense to Sparse Coding in the Insect Olfactory System

Affiliations

Circuit and Cellular Mechanisms Facilitate the Transformation from Dense to Sparse Coding in the Insect Olfactory System

Rinaldo Betkiewicz et al. eNeuro. .

Abstract

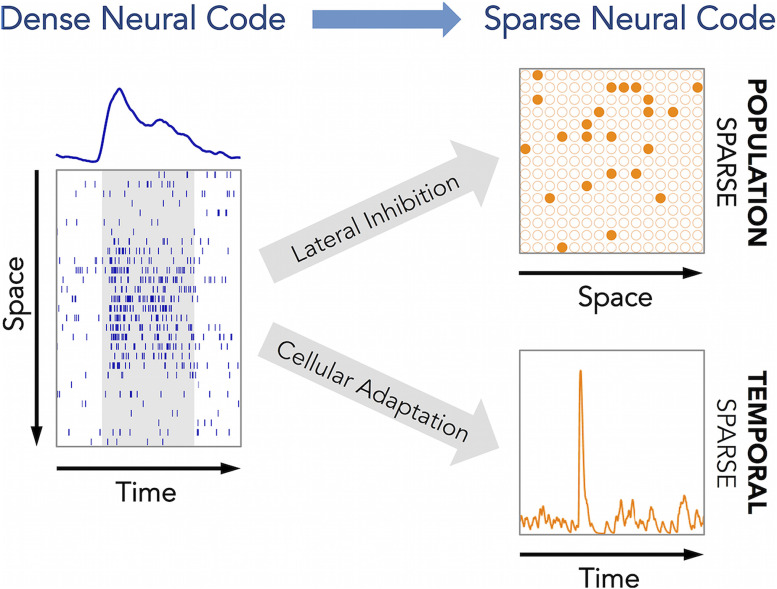
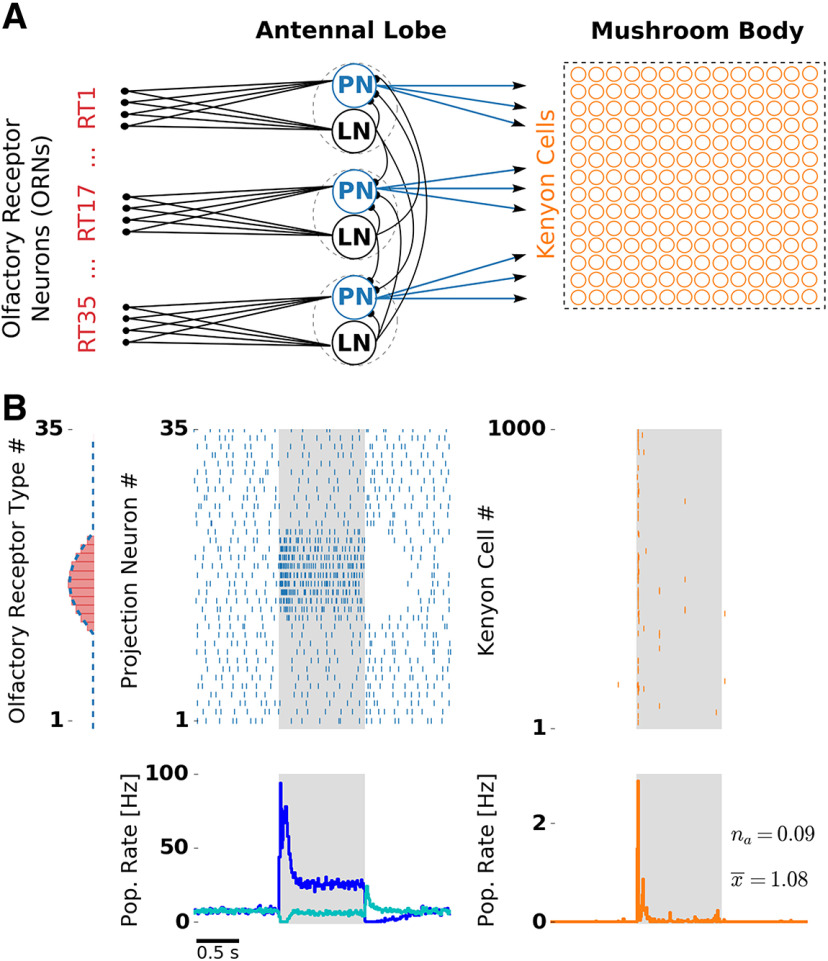
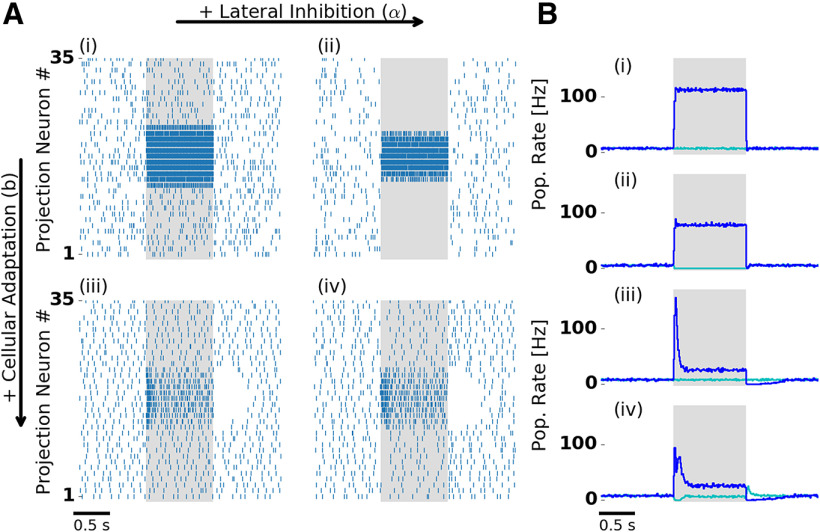
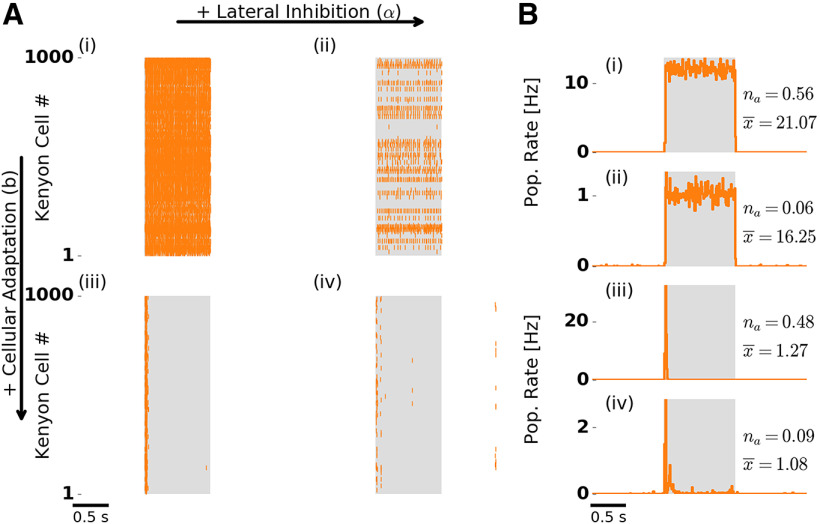
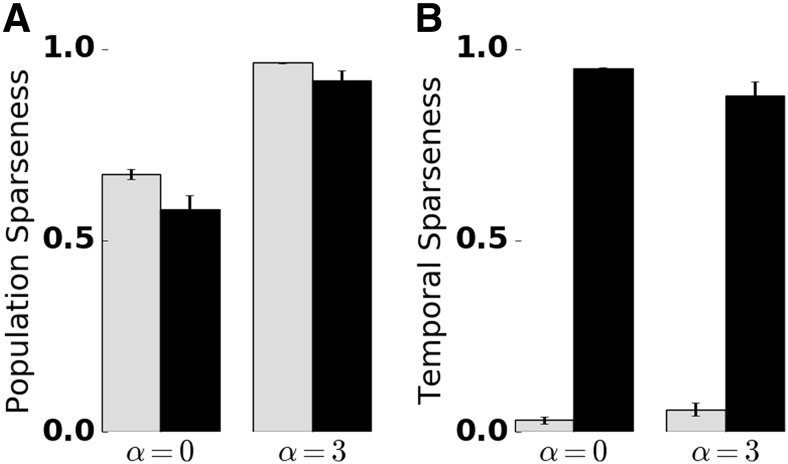
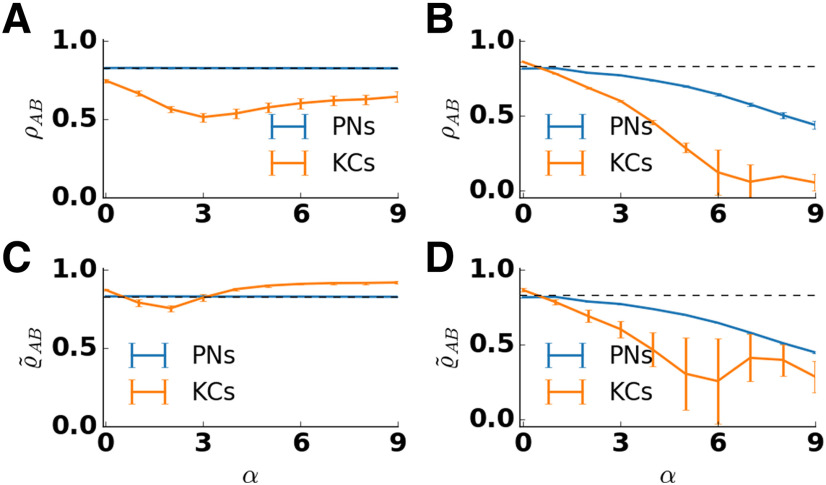
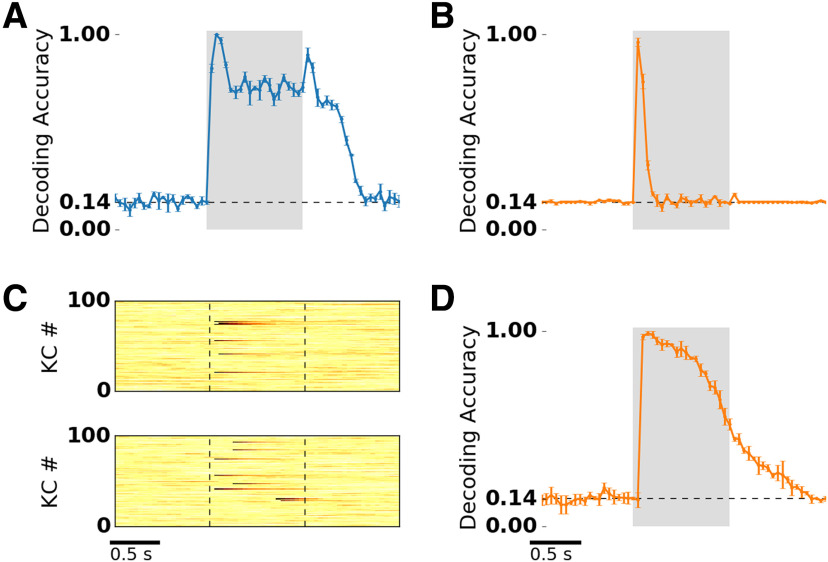
Transformations between sensory representations are shaped by neural mechanisms at the cellular and the circuit level. In the insect olfactory system, the encoding of odor information undergoes a transition from a dense spatiotemporal population code in the antennal lobe to a sparse code in the mushroom body. However, the exact mechanisms shaping odor representations and their role in sensory processing are incompletely identified. Here, we investigate the transformation from dense to sparse odor representations in a spiking model of the insect olfactory system, focusing on two ubiquitous neural mechanisms: spike frequency adaptation at the cellular level and lateral inhibition at the circuit level. We find that cellular adaptation is essential for sparse representations in time (temporal sparseness), while lateral inhibition regulates sparseness in the neuronal space (population sparseness). The interplay of both mechanisms shapes spatiotemporal odor representations, which are optimized for the discrimination of odors during stimulus onset and offset. Response pattern correlation across different stimuli showed a nonmonotonic dependence on the strength of lateral inhibition with an optimum at intermediate levels, which is explained by two counteracting mechanisms. In addition, we find that odor identity is stored on a prolonged timescale in the adaptation levels but not in the spiking activity of the principal cells of the mushroom body, providing a testable hypothesis for the location of the so-called odor trace.

Keywords: efficient coding; lateral inhibition; odor trace; sensory processing; spike frequency adaptation; spiking neural network.


Figures

None
Graphical abstract
Figure 1.
Figure 1.
Olfactory network model structure and odor response. A, Network structure resembles the insect olfactory pathway with three main processing stages. In each glomerulus (dashed circles), a PN (blue) and a LN receive convergent ORN input (red) by one receptor type (RT). Each LN provides unspecific lateral inhibition to all PNs. KCs (orange) receive on average 12 inputs from randomly chosen PNs. B, Receptor response profile (red bars, AL input) depicts the evoked firing rate for each ORN type. Evoked PN spike counts (dashed blue line, AL output) follow the ORN activation pattern. Raster plots depict single-trial responses of PNs (blue) and KCs (orange). Presentation of an odor during 1000 ms is indicated by the shaded area. Population (Pop.) firing rates were obtained by averaging over 50 trials. PN spikes display a temporal structure that includes evoked transient responses at stimulus onset and offset, and a pronounced inhibitory postodor response. The PN population rate was averaged over PNs showing on responses (blue) and off responses (cyan). KC spikes were temporally sparse with the majority of the spikes occurring at the stimulus onset. Extended Data Figure 1-1 and Extended Data Figure 1-2 show odor responses with adaptation disabled in the KC and PN population, respectively.
Figure 2.
Figure 2.
Lateral inhibition and cellular adaptation shape PN odor response dynamics. A, Single-trial PN spiking responses simulated with (right column) and without (left column) lateral inhibition, and with (bottom row) and without (top row) adaptation. Presentation of a single odor during 1000 ms is indicated by the shaded area. With adaptation, PNs display a temporal structure that includes a transient and a tonic response, and a pronounced inhibitory postodor response. B, Trial-averaged population firing rate: PNs driven by stimulation (blue) and remaining PNs (cyan). Bi–iv indicate the presence and absence of lateral inhibition and adaptation, as in A. In the presence of lateral inhibition, firing rates during stimulation are reduced. In the presence of lateral inhibition and adaptation (Aiv, Biv) PNs show either transient on responses (blue) or off responses (cyan). Aiv and Biv are reproduced in Figure 1B. Extended Data Figure 2-1 shows PN tuning profiles and input–output relation.
Figure 3.
Figure 3.
Odor response dynamics of the KC population. Figure layout is as in Figure 2. A, Single-trial population spike raster responses. B, Trial-averaged KC population firing rate. Numbers to the right indicate the fraction of activated KCs (na) and the mean number of spikes per activated KC during stimulation (x¯). Without adaptation (Ai,ii, Bi,ii), KCs spike throughout stimulation because PN drive is strong and persistent. The fraction of activated KCs drops in the presence of lateral inhibition (Aii,iv, Bii,iv). With adaptation (Aiii,iv, Biii,iv), most of the KC spikes are confined to stimulus onset, indicating temporally sparse responses. We note that spontaneous KC activity is extremely low (0.03 Hz), which is in accordance with previous experimental results (Ito et al., 2008). Aiv and Biv are reproduced in Figure 1B.
Figure 4.
Figure 4.
Quantification of temporal and population sparseness in the KC population. Sparseness was measured in the absence (α = 0) and presence (α = 3) of lateral inhibition, and the presence (black bars) and absence (gray bars) of SFA. The sparseness measure was averaged over 50 trials. Error bars indicate SD. A value of 1 corresponds to maximally sparse responses. A, Adaptation promotes temporal sparseness. B, Lateral inhibition in the AL promotes KC population sparseness. Extended Data Figure 4-1 shows temporal sparseness when SFA was disabled in the PN or KC population, and population sparseness for different numbers of PN inputs per KC.
Figure 5.
Figure 5.
Lateral inhibition in the AL facilitates population sparseness and reduces pattern correlation in the MB. Spike counts (single trial) of 900 randomly selected KCs in response to two similar odors (“Odor A” and “Odor B”) arranged on a 30 × 30 grid in the absence (top row) and in the presence (bottom row) of lateral inhibition. Inactive KCs are shown in black. A, In the absence of lateral inhibition, KCs readily responded to both odors, resulting in an activation pattern where most KCs are active. In the presence of lateral inhibition both odors evoked sparse KC activation patterns. B, Superposition of responses to the two odors. KCs that were activated by both odors are indicated by hot colors (color bar denotes the spike count of the stronger response). KCs that were activated exclusively by one of the two odors are indicated in gray. The fraction of KCs that show overlapping responses is reduced in the presence of lateral inhibition. C, Pattern correlation between the single-trial responses in A to the two odors obtained for PN (blue) and KC (orange) spikes counts, in the absence (α = 0) and presence (α = 3) of lateral inhibition. Dashed line indicates pattern correlation of the input (ORNs). Pattern correlation was retained at the AL and was reduced at the MB level. Lateral inhibition in the AL reduced pattern correlation in KCs, but not in PNs.
Figure 6.
Figure 6.
Pattern correlation in the antennal lobe and the mushroom body depend on lateral inhibition strength α. The correlation coefficient ρAB between the response patterns to two similar odors was calculated and averaged over 50 trials and five network realizations for PNs (blue) and KCs (orange). Error bars indicate SD over trials and network realizations. Pattern correlation of the input is indicated by the dashed line. Input correlation is high because similar odors activate largely overlapping set of receptors. A, In the presence of adaptation, pattern correlation in PNs (blue) stays close to the input correlation for all values of lateral inhibition strength. In KCs (orange), the correlation decreases for small values of lateral inhibition strength and increases for large values of lateral inhibition strength. Pattern correlation in KCs is minimal for α = 3. B, In the absence of adaptation, pattern correlation decreases with the lateral inhibition strength both in PNs and KCs. The decrease is stronger in KCs. C, D, Pattern correlation ϱ~AB was calculated based on evoked, trial-averaged spike counts in the presence (C) and absence (D) of lateral inhibition. The correlation coefficient between the trial-averaged response patterns to two similar odors was calculated and averaged over five network realizations. Error bars indicate SD over network realizations. In the presence of adaptation (C), the overlap between trial-averaged KC representations of two similar odors (orange) shows a minimum for intermediate strengths of lateral inhibition (1α3). At the minimum, the KC overlap is below the overlap between trial-averaged PN representations. In the absence of adaptation, the overlap between trial-averaged KC representations is generally lower than the overlap between trial-averaged PN representations for all strengths of lateral inhibition. Extended Data Figure 6-1 and Extended Data Figure 6-2 show the mean fraction of activated KCs and the mean pairwise KC cross-correlation, respectively.
Figure 7.
Figure 7.
Decoding of odor identity indicates a prolonged and reliable odor information in KC adaptation currents. A, B, D, Decoding accuracy was calculated for nonoverlapping 50 ms time bins, based on a set of seven stimuli (chance level, ∼0.14) presented for 1 s (shaded area). Blue shading indicates SD obtained from a cross-validation procedure (see Materials and Methods). A, Decoding of odor identity from PN spike counts. Decoding accuracy peaks at odor onset and offset, and remains high after stimulation. B, Decoding of odor identity from KC spike counts. Decoding accuracy is above chance only in the first three bins following stimulus onset. C, Adaptation current amplitudes (single trial, hot colors in arbitrary units) of 100 selected KCs in response to “odor A” (top) and “odor B” (bottom). D, Decoding of odor identity from KC adaptation currents. Decoding accuracy peaks 150 ms after odor onset then drops during stimulation, but remains high and is sustained after odor offset.

Similar articles

Cited by

References

    1. Albus JS (1971) A theory of cerebellar function. Math Biosci 10:25–61. 10.1016/0025-5564(71)90051-4 - DOI
    1. Ardin P, Peng F, Mangan M, Lagogiannis K, Webb B (2016) Using an insect mushroom body circuit to encode route memory in complex natural environments. PLoS Comput Biol 12:e1004683 10.1371/journal.pcbi.1004683 - DOI - PMC - PubMed
    1. Assisi C, Stopfer M, Laurent G, Bazhenov M (2007) Adaptive regulation of sparseness by feedforward inhibition. Nat Neurosci 10:1176–1184. 10.1038/nn1947 - DOI - PMC - PubMed
    1. Barlow H (1961) Possible principles underlying the transformations of sensory messages In: Sensory communication: contributions to the symposium on principles of sensory communication, July 19 – August 1, 1959, Edicott House, M.I.T., Vol 6 (Rosenblith W, ed), pp 57–58. New York: Wiley.
    1. Barlow H (2001) Redundancy reduction revisited. Network 12:241–253. 10.1080/net.12.3.241.253 - DOI - PubMed

Publication types

LinkOut - more resources