. 2020 May 1;80(9):1861-1874.
doi: 10.1158/0008-5472.CAN-19-1558. Epub 2020 Mar 4.

MEF2c-Dependent Downregulation of Myocilin Mediates Cancer-Induced Muscle Wasting and Associates with Cachexia in Patients with Cancer

Affiliations

MEF2c-Dependent Downregulation of Myocilin Mediates Cancer-Induced Muscle Wasting and Associates with Cachexia in Patients with Cancer

Sarah M Judge et al. Cancer Res. .

Abstract

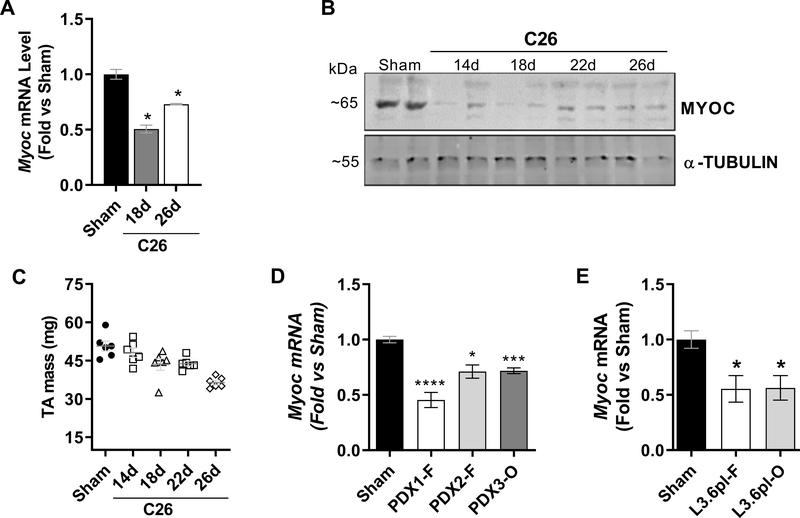
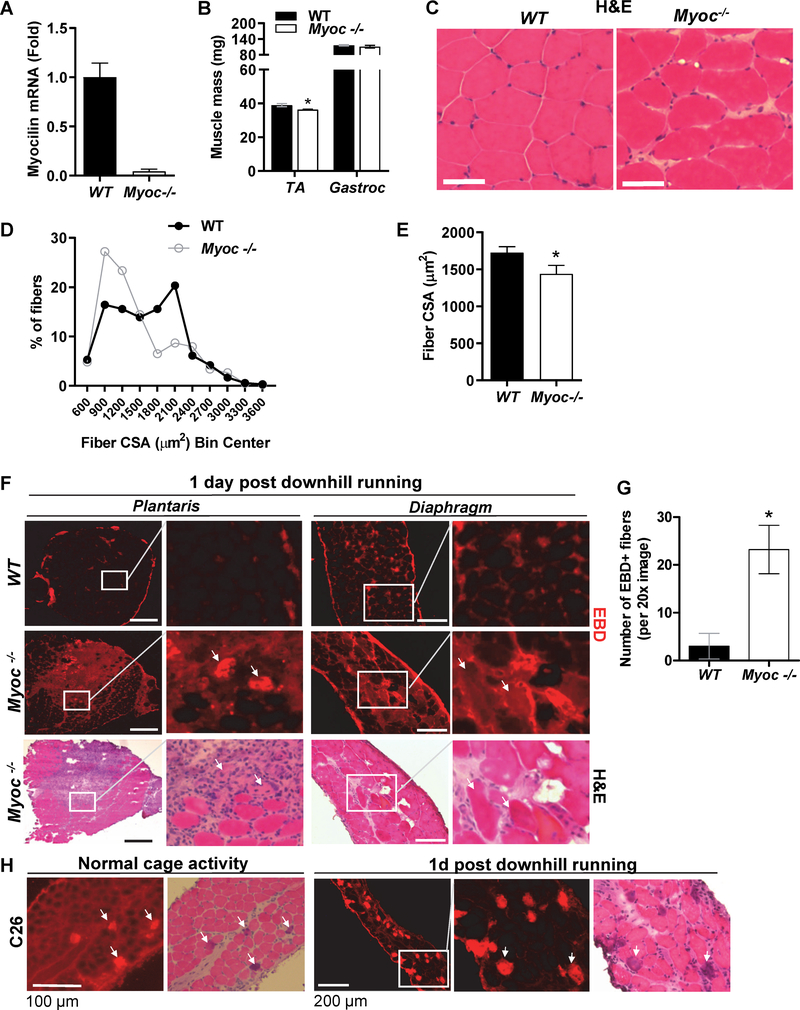
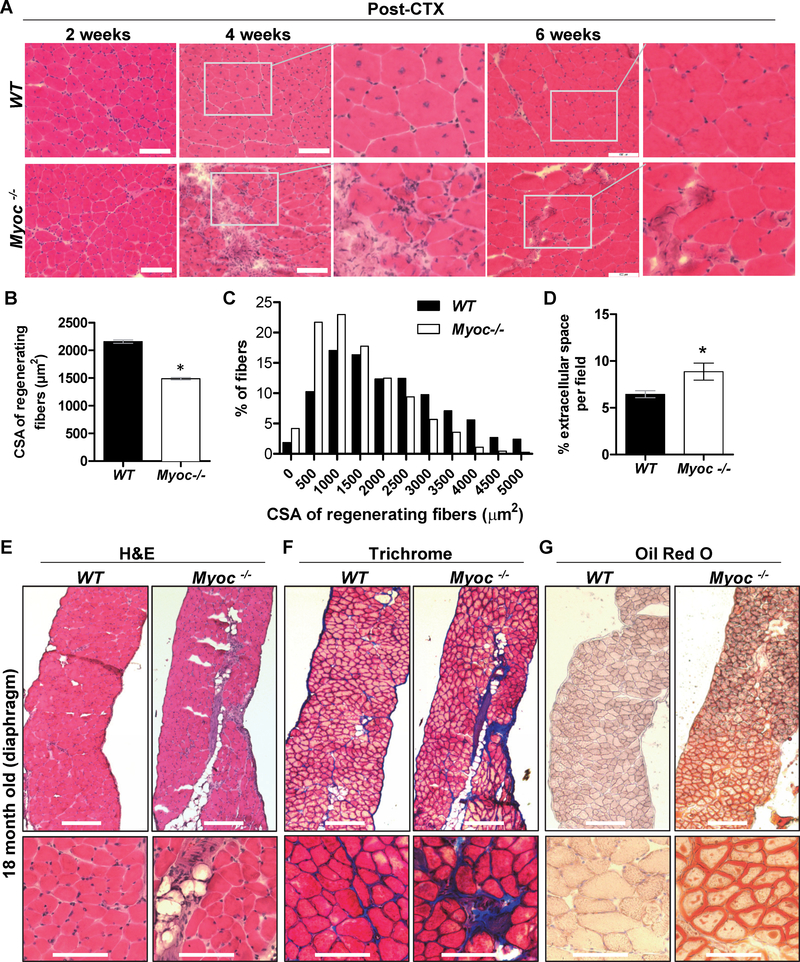
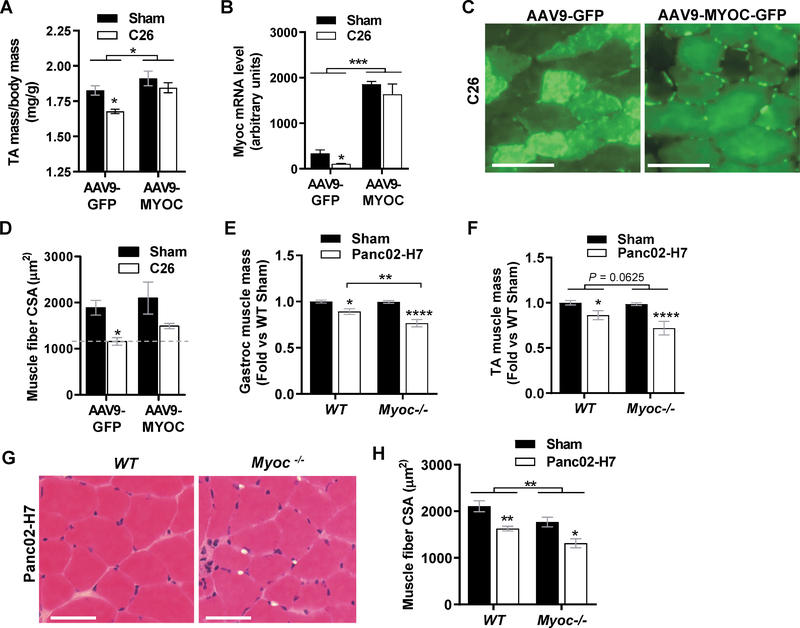
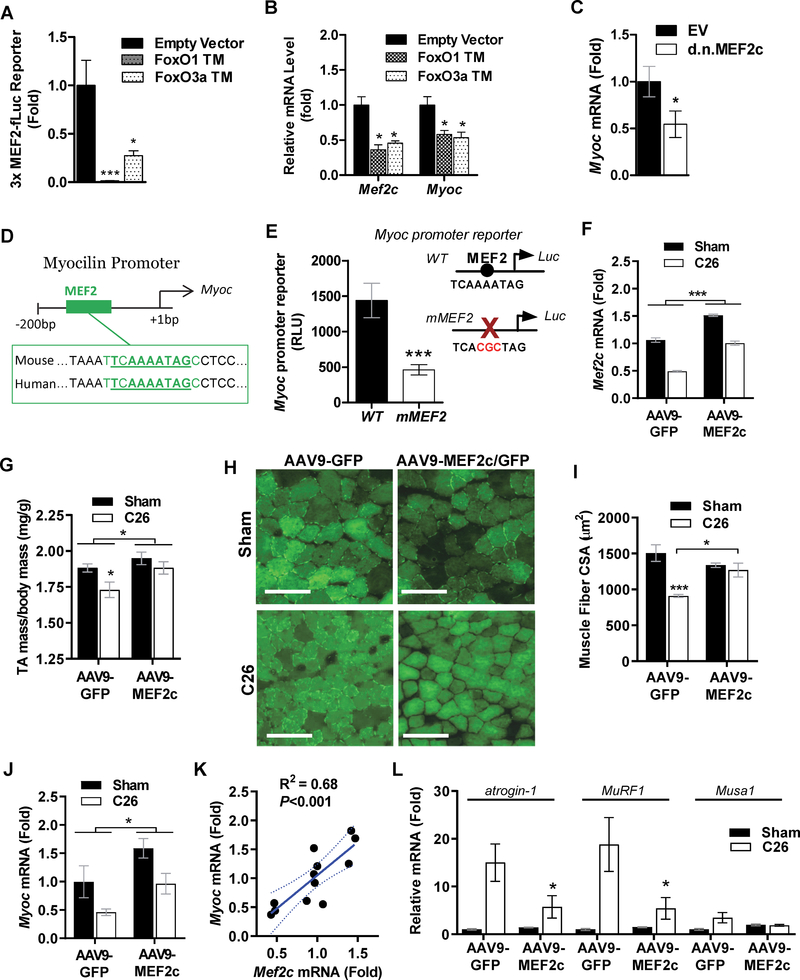
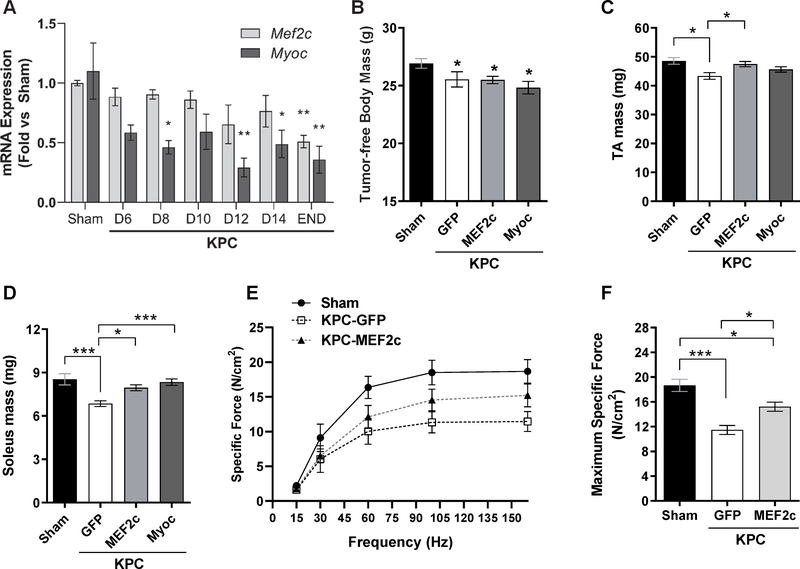
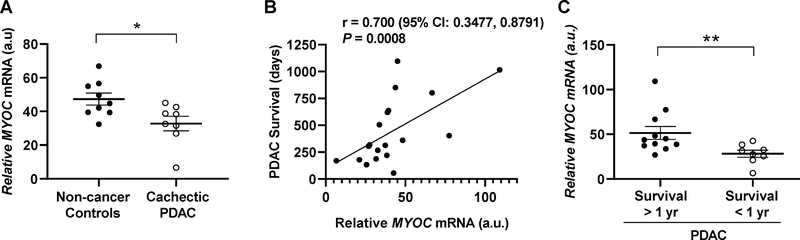
Skeletal muscle wasting is a devastating consequence of cancer that contributes to increased complications and poor survival, but is not well understood at the molecular level. Herein, we investigated the role of Myocilin (Myoc), a skeletal muscle hypertrophy-promoting protein that we showed is downregulated in multiple mouse models of cancer cachexia. Loss of Myoc alone was sufficient to induce phenotypes identified in mouse models of cancer cachexia, including muscle fiber atrophy, sarcolemmal fragility, and impaired muscle regeneration. By 18 months of age, mice deficient in Myoc showed significant skeletal muscle remodeling, characterized by increased fat and collagen deposition compared with wild-type mice, thus also supporting Myoc as a regulator of muscle quality. In cancer cachexia models, maintaining skeletal muscle expression of Myoc significantly attenuated muscle loss, while mice lacking Myoc showed enhanced muscle wasting. Furthermore, we identified the myocyte enhancer factor 2 C (MEF2C) transcription factor as a key upstream activator of Myoc whose gain of function significantly deterred cancer-induced muscle wasting and dysfunction in a preclinical model of pancreatic ductal adenocarcinoma (PDAC). Finally, compared with noncancer control patients, MYOC was significantly reduced in skeletal muscle of patients with PDAC defined as cachectic and correlated with MEF2c. These data therefore identify disruptions in MEF2c-dependent transcription of Myoc as a novel mechanism of cancer-associated muscle wasting that is similarly disrupted in muscle of patients with cachectic cancer. SIGNIFICANCE: This work identifies a novel transcriptional mechanism that mediates skeletal muscle wasting in murine models of cancer cachexia that is disrupted in skeletal muscle of patients with cancer exhibiting cachexia.


Conflict of interest statement

Conflict of interest statement: The authors declare no potential conflicts of interest.

Figures

Figure 1.
Figure 1.. Myoc is transcriptionally downregulated in skeletal muscle in multiple experimental models of cancer cachexia.
A-C) Skeletal muscles harvested from C26 tumor-bearing mice were assessed for Myoc mRNA (A, TA muscles) and MYOC protein (B, gastrocnemius muscles) at various time points throughout tumor growth and the progression of muscle wasting (C, and Supplemental Fig. S1). Data are representative of n = 3–6 mice/group. D, E) The relative expression of Myoc mRNA was assessed in TA muscles in multiple experimental models of cancer cachexia, including in mice bearing human patient-derived xenograft (PDX) tumors implanted subcutaneously into the flank (PDX1-F, PDX2-F) or orthotopically into the pancreas (PDX-O) (D), and in mice inoculated with human L3.6pl tumor cells subcutaneously into the flank (L3.6pl-F) or orthotopically into the pancreas (L3.6pl-O) (E). Data are expressed as mean ± SEM, normalized to their respective sham group. Data are representative of n = 4–6 mice/group. For visualization purposes only, Sham groups for each cohort of PDX mice were combined, as were the Sham groups for the L3.6pl tumor-bearing groups. *P<0.05, **P<0.01, ***P<0.001, ****P<0.0001 vs Sham.
Figure 2.
Figure 2.. Myoc deficiency causes muscle fiber atrophy and sarcolemmal fragility.
A) qRT-PCR validation of Myoc knockout, showing negligible detection of Myoc mRNA in TA muscles of Myoc−/− mice vs WT mice. B) Muscle mass of the TA and gastrocnemius muscle complex of 12 week-old WT and Myoc−/− mice. C,D) Average CSA (C) and frequency distribution (D) of TA muscle fibers in WT and Myoc−/− mice measured from H&E-stained muscle cross-sections (E). Data in A-D represent mean ± SEM mean, n = 4–6 mice/group. Scale bars = 50 μM. F) Representative cross-sections from the plantaris muscle and the diaphragm of WT and Myoc−/− mice 1 day following downhill treadmill running, showing relative uptake of Evan’s blue dye (EBD, red), a membrane-impermeable fluorescent dye that can only enter the cytosol of fibers following significant tearing of the sarcolemma. Muscle damage was further confirmed via H&E staining (representative of n = 4 mice/group). Scale bars = 400 μm (plantaris) and 100 μm (diaphragm). G) The average number of EBD+ fibers per 20x field view in diaphragm muscle cross-sections from WT and Myoc−/− mice 1 day following downhill running (n = 4 mice/group). White arrows show EBD positive muscle fibers matching corresponding hypereosinophilic (damaged) fibers in serial sections stained with H&E. Scale bar = 100 μm. H) Representative cross-sections from the diaphragm of C26 mice subjected to normal cage activity or downhill treadmill running, showing myofiber uptake of EBD that is exacerbated in response to downhill running. Data are representative of n = 4 mice/group. *P<0.05 vs WT.
Figure 3.
Figure 3.. Myoc deficiency impairs skeletal muscle regeneration and leads to reduced muscle quality in aged mice.
A) Representative H&E-stained cross-sections from TA muscles harvested from WT and Myoc−/− mice 2, 4 and 6 weeks post CTX-injury (n = 4–5 mice/group). Scale bars = 100μm. The average cross-sectional area (B) and frequency distribution (C) of regenerating myofibers with centralized nuclei was calculated in muscles of WT and Myoc−/− mice 4 weeks post CTX-injury (~2000 fibers measured/group). D) The amount of non-eosin stained area surrounding muscle fibers (extracellular tissue/space) was calculated in regenerating muscles of WT and Myoc−/− mice 6 weeks post-injury (*P<0.05; n = 5 mice/group). E-G) Representative cross-sections from diaphragm muscles of aged (18 month-old) WT and Myoc−/− mice, stained with H&E (E), Masson’s Trichrome (collagen stains blue) (F), and Oil Red O (lipid stains orange) (G). Scale bars = 250 μm (top panel) and 100 μm (bottom panel).
Figure 4.
Figure 4.. Loss of MYOC mediates tumor-associated skeletal muscle wasting.
A-D) TA muscles from mice were transduced with AAV9-GFP or AAV9-tMCK-MYOC-GFP and 2 weeks later subcutaneously inoculated with C26 tumor cells or 1xPBS (Sham). C26-induced changes in TA muscle mass normalized to total body mass (A), and Myoc mRNA as measured via qRT-PCR (B). C) Representative cross-sections from TA muscles of C26 mice showing successful transduction of AAV vectors into myofibers, as visualized via direct GFP fluorescence. Scale bars = 50 μm. D) TA muscle fiber CSA measured at experimental endpoint (*P<0.05 vs. Sham-AAV9-GFP; N = 4 mice/group, except Sham-MYOC-GFP, N = 3 mice/group). E-H) Panc02-H7 tumor cells were orthotopically injected into the pancreas of WT and Myoc−/− mice and tissues harvested at experimental endpoint. Changes in gastrocnemius muscle complex mass (*P<0.05 vs WT Sham; ****P<0.0001 vs. Myoc−/− Sham) (E) and TA muscle mass (*P<0.05 vs WT Sham; ****P<0.0001 vs. Myoc−/− Sham) (F). Data are normalized to sex-matched WT Sham mice (n = 6–8 mice/group). Representative TA muscle cross-sections stained with H&E (G) and average TA muscle fiber CSA (H) of WT and Myoc−/− mice in response to Panc02-H7 tumor-bearing (**P<0.01 vs WT Sham; *P<0.05 vs. Myoc−/− Sham; n = 5 mice/group). Scale bars = 50 μm. *P<0.05, **P<0.01, ***P<0.001, ****P<0.0001
Figure 5.
Figure 5.. MEF2c gain-of-function blocks Myoc downregulation and cancer-associated muscle wasting.
A,B) Luciferase activity derived from a 3xMEF2-dependent luciferase reporter plasmid (A), and qRT-PCR analysis of Myoc and Mef2c mRNA (B) from rat soleus muscles transfected with expression plasmids encoding constitutively active FoxO1 or FoxO3a, which harbor mutations in the 3 inhibitory Akt phosphorylation sites, and are thus known as triple mutant (TM) forms of FoxO1 or FoxO3. C) Analysis of the mouse and human Myoc proximal promoter regions identified a conserved MEF2 binding motif located within ~200bp upstream of the transcription start site. D) qRT-PCR analysis of Myoc mRNA in rat solei injected with either empty vector (EV) or dominant negative (d.n.) MEF2c expression plasmid (*P<0.05; n = 5–6 rats/group). E) Plasmid-based luciferase activity driven by an ~0.5kb fragment of the Myoc proximal promoter (WT), compared to a mutated version (mMEF2), in which a canonical MEF2 binding motif was mutated to prevent MEF2 binding, 4 days following plasmid transfection into mouse TA muscles, in vivo (Paired t-test; ***P<0.001). F) qRT-PCR analysis of Mef2c mRNA in TA muscles of sham and C26 tumor-bearing mice transduced with AAV9-GFP or AAV9-tMCK-MEF2c-GFP confirming successful upregulation of MEF2c (n = 3 mice/group). G-I) Muscle mass normalized to total body mass (*P<0.05 vs. Sham AAV9-GFP) (G), representative muscle cross-sections (H), and muscle fiber CSA (***P<0.05 vs. Sham AAV9-GFP) (I) from TA muscles harvested at experimental endpoint from Sham and cachectic C26 tumor-bearing mice transduced with AAV9-GFP or AAV9-tMCK-MEF2c-GFP. Data are representative of n = 6–8 mice/group, except Sham AAV9-tMCK-MEF2c-GFP group, which represents N = 3 mice. J) qRT-PCR analysis of Myoc mRNA (K) and subsequent linear regression analysis with Mef2c mRNA showing a significant correlation between the mRNA levels of Mef2c and Myoc (r2=0.68, P<0.001). L) qRT-PCR analysis of atrophy-related biomarkers atrogin-1/Fbxo32, MuRF1/Trim63 and Musa1/Fbxo30 mRNA (*P<0.05 vs C26 AAV9-GFP group). Data in J-L represent N = 3 mice/group. *P<0.05, **P<0.01, ***P<0.001, ****P<0.0001.
Figure 6.
Figure 6.. MEF2c gain-of-function protects against muscle wasting and dysfunction in a murine model of PDAC-associated cachexia.
A) qRT-PCR analysis of Myoc and Mef2c in TA muscles harvested from sham mice, and mice bearing orthotopic KPC tumors on days 6, 8, 10, 12 and 14 following tumor inoculation surgeries, and at IACUC-mandated endpoint (END), which was reached ~15–17 days post-surgery. B-F) Mice received intramuscular and/or intrapleural injections of AAV9-GFP, AAV9-tMCK-MYOC or AAV9-tMCK-MEF2c vectors, and 3 weeks later received an orthotopic injection of KPC cells (or saline, Sham) into the pancreas. Tumor-free body mass (B), TA muscle mass (C), and soleus muscle mass (D) on day 13–14 post-surgery from Sham mice (transduced with AAV9-GFP) and KPC mice (transduced with AAV9-GFP, AAV9-tMCK-MYOC or AAV9-tMCK-MEF2c). Specific force-frequency relationship (E) and maximum specific force (F) in diaphragm strips from Sham mice transduced with AAV9-GFP, and KPC mice transduced with either AAV9-GFP or AAV9-tMCK-MEF2c. All data are representative of n = 3–5 mice/group, *P<0.05, ***P<0.001 (vs. Sham unless otherwise indicated).
Figure 7.
Figure 7.. MYOC is reduced in rectus abdominis muscle biopsies from PDAC patients exhibiting cachexia, and is associated with reduced survival.
A) Normalized levels of MYOC mRNA in skeletal muscle biopsies from non-cancer controls with normal muscularity, compared to cachectic PDAC patients. Cachexia was defined based on body-weight loss of >8%, in combination with CT-defined measurements of muscle depletion and low muscle attenuation (MA)—cachexia thresholds which have been identified previously in cancer patients to associate with short survival (42). Data are reported as mean ± SEM, (*P<0.05). One PDAC patient was identified as an outlier (ROUT Q = 1%), and removed from analyses. B) Spearman correlation was performed between the skeletal muscle levels of MYOC mRNA and survival time (days) of PDAC patients following tumor resection surgery. C) The relative mRNA levels of MYOC in PDAC patients stratified based on survival time post tumor resection surgery (>1 year vs. < 1 year) (**P<0.01).

Similar articles

Cited by

References

    1. Baracos VE, Martin L, Korc M, Guttridge DC, Fearon KCH. Cancer-associated cachexia. Nat Rev Dis Primers 2018;4:17105. - PubMed
    1. Kazemi-Bajestani SM, Mazurak VC, Baracos V. Computed tomography-defined muscle and fat wasting are associated with cancer clinical outcomes. Semin Cell Dev Biol 2016;54:2–10 - PubMed
    1. Aoyagi T, Terracina KP, Raza A, Matsubara H, Takabe K. Cancer cachexia, mechanism and treatment. World J Gastrointest Oncol 2015;7:17–29 - PMC - PubMed
    1. Rohm M, Zeigerer A, Machado J, Herzig S. Energy metabolism in cachexia. EMBO Rep 2019;20 - PMC - PubMed
    1. Mendes MC, Pimentel GD, Costa FO, Carvalheira JB. Molecular and neuroendocrine mechanisms of cancer cachexia. J Endocrinol 2015;226:R29–43 - PubMed

Publication types

MeSH terms