. 2020 Mar 17;117(11):6145-6155.
doi: 10.1073/pnas.1917590117. Epub 2020 Mar 4.

Visualizing the translation and packaging of HIV-1 full-length RNA

Affiliations

Visualizing the translation and packaging of HIV-1 full-length RNA

Jianbo Chen et al. Proc Natl Acad Sci U S A. .

Abstract

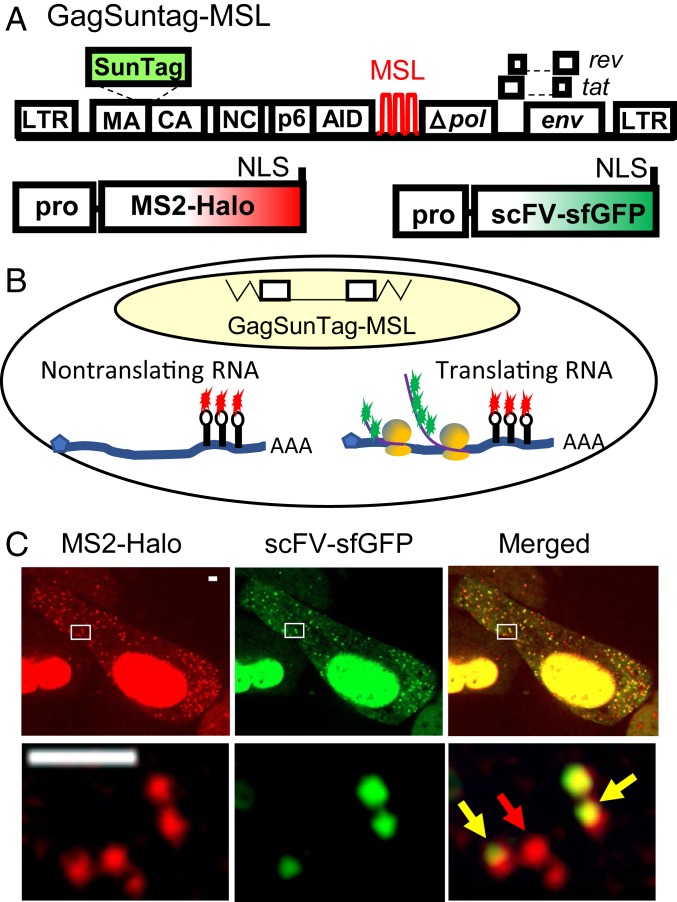
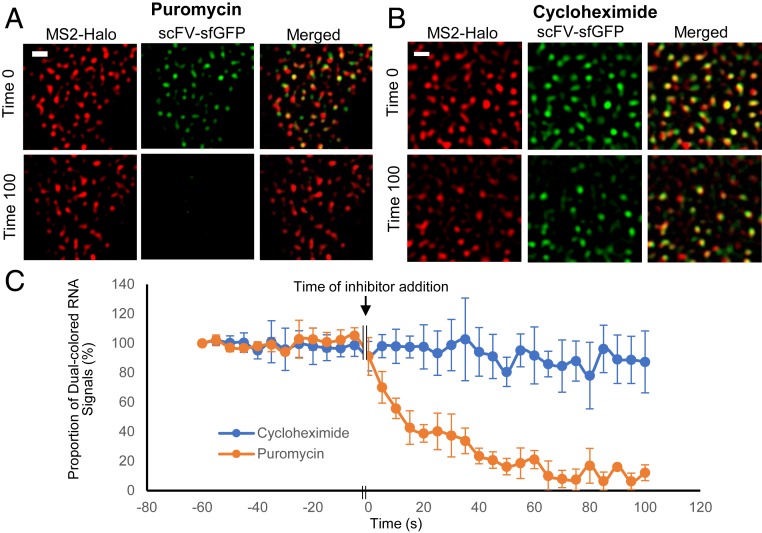
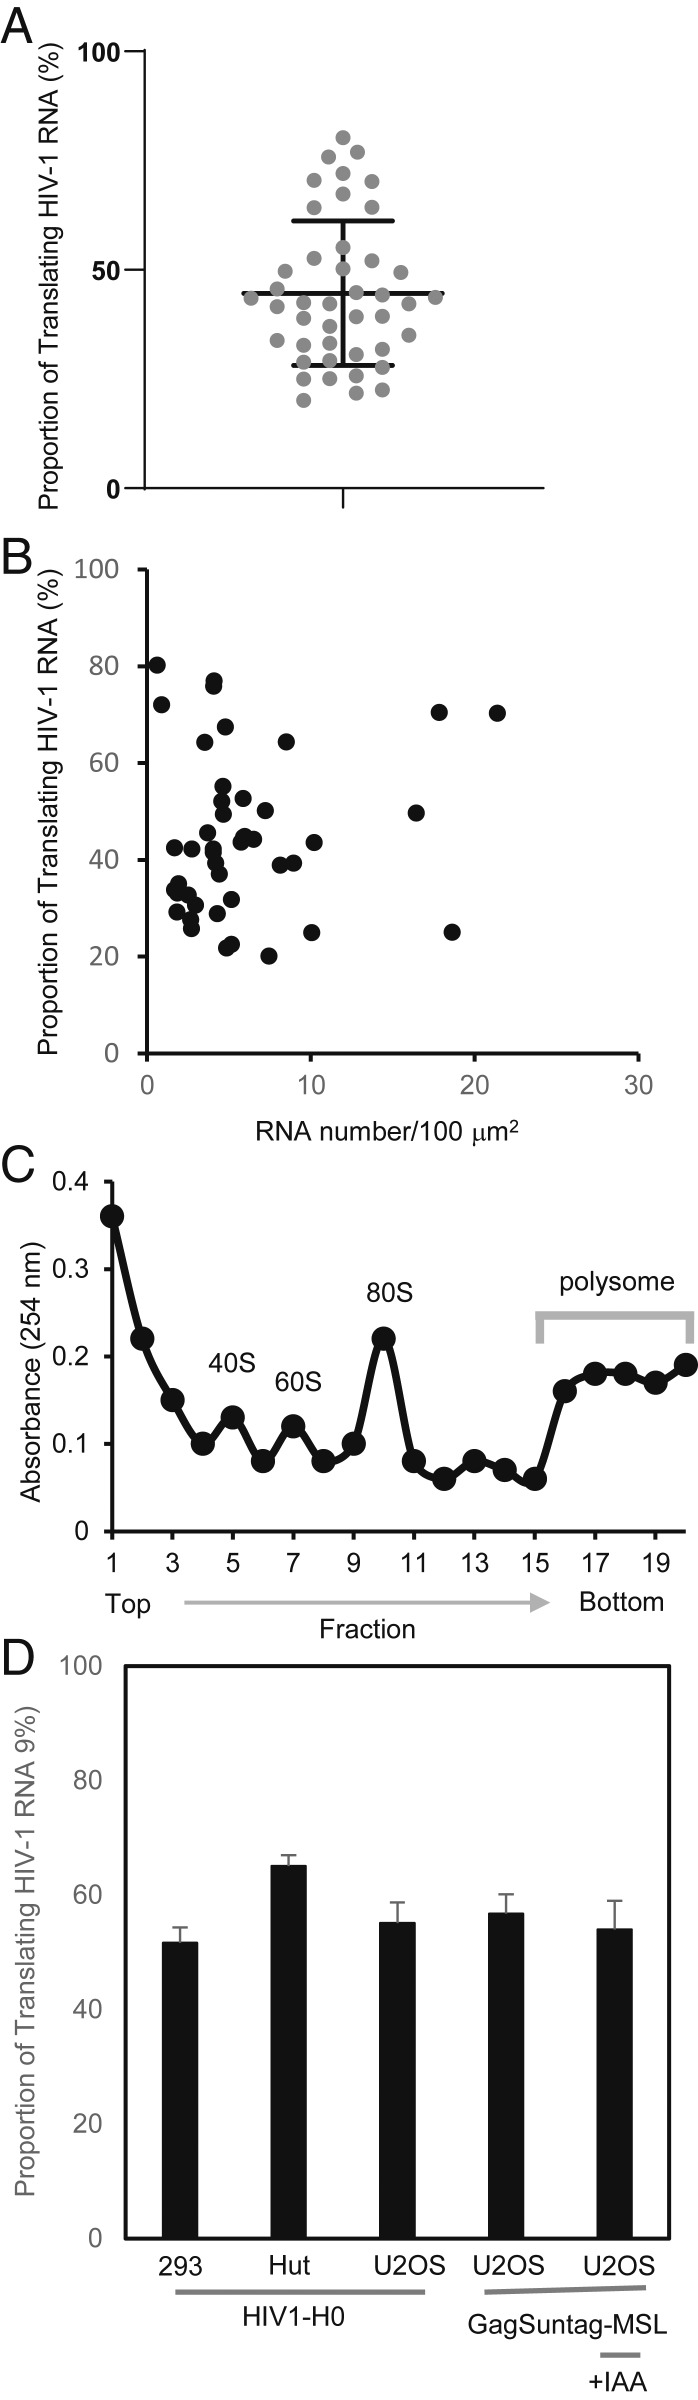
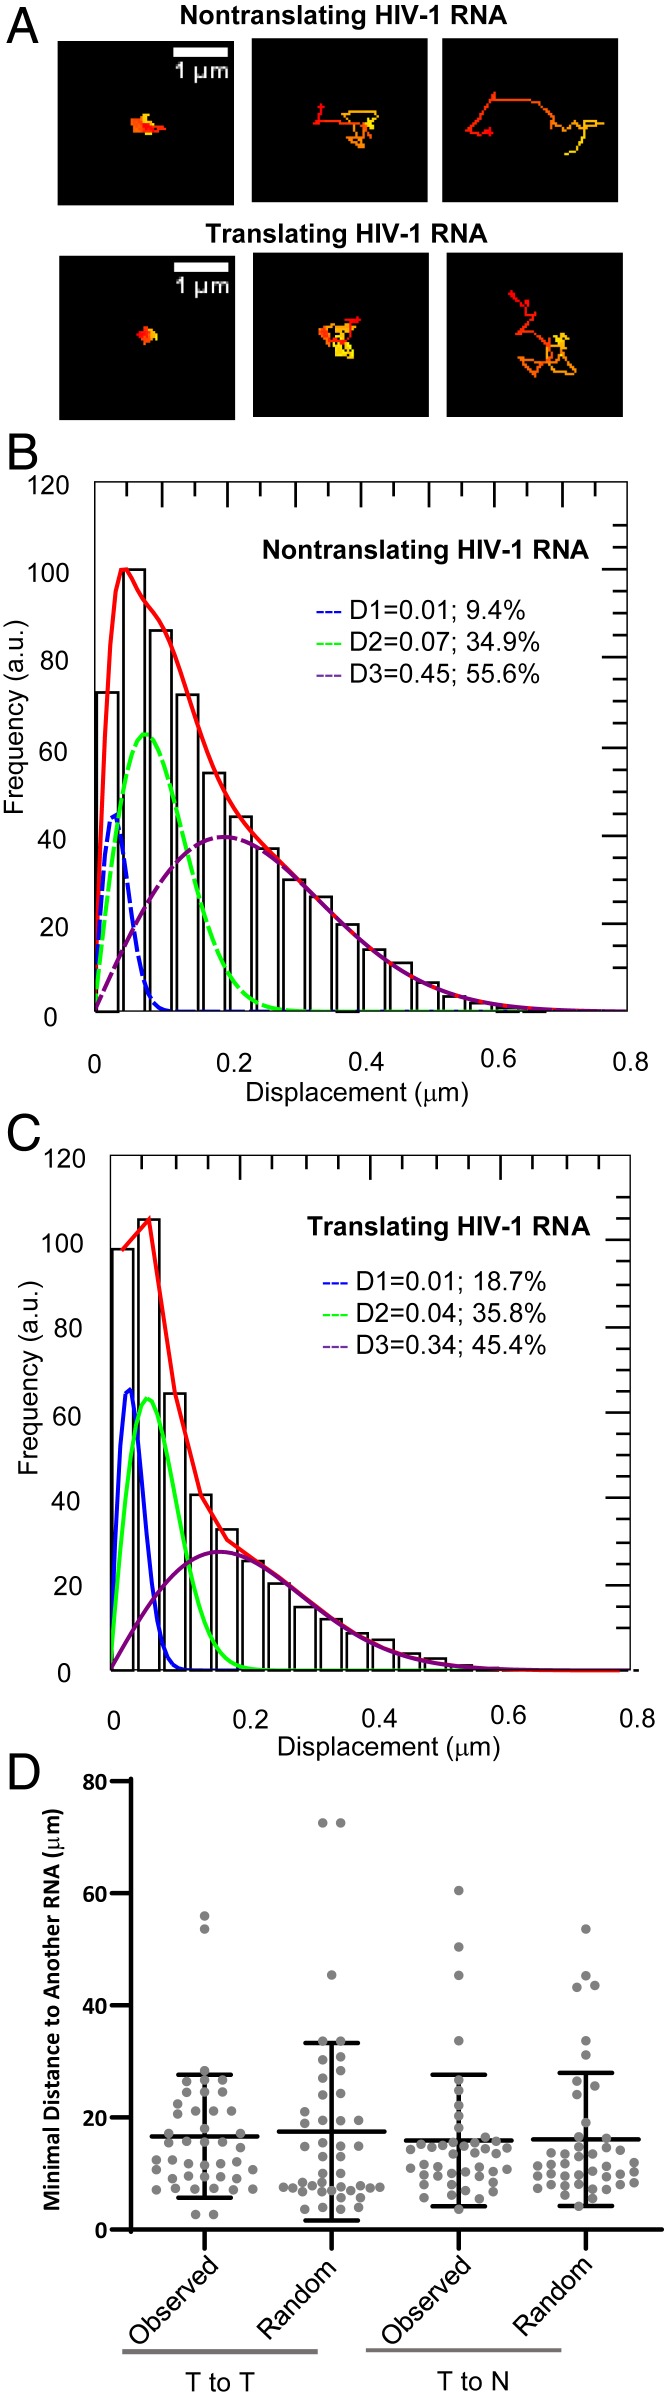
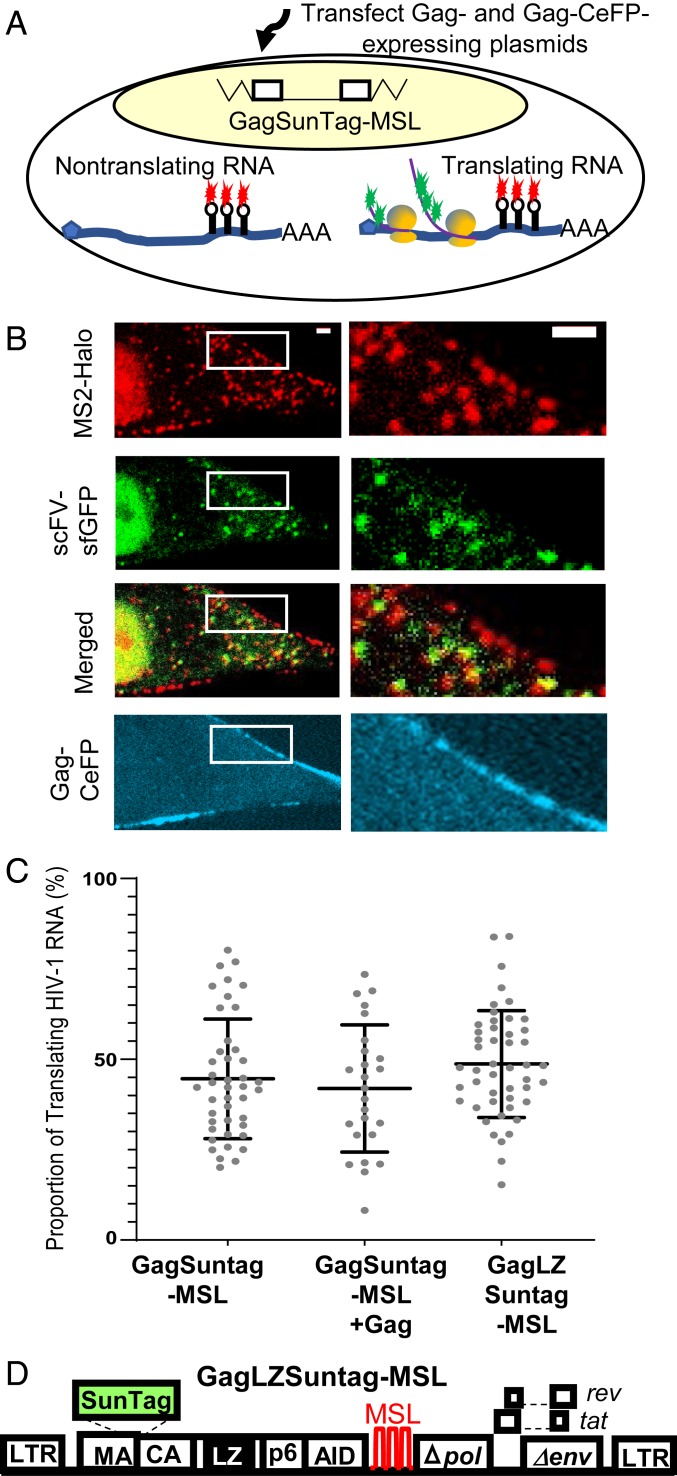
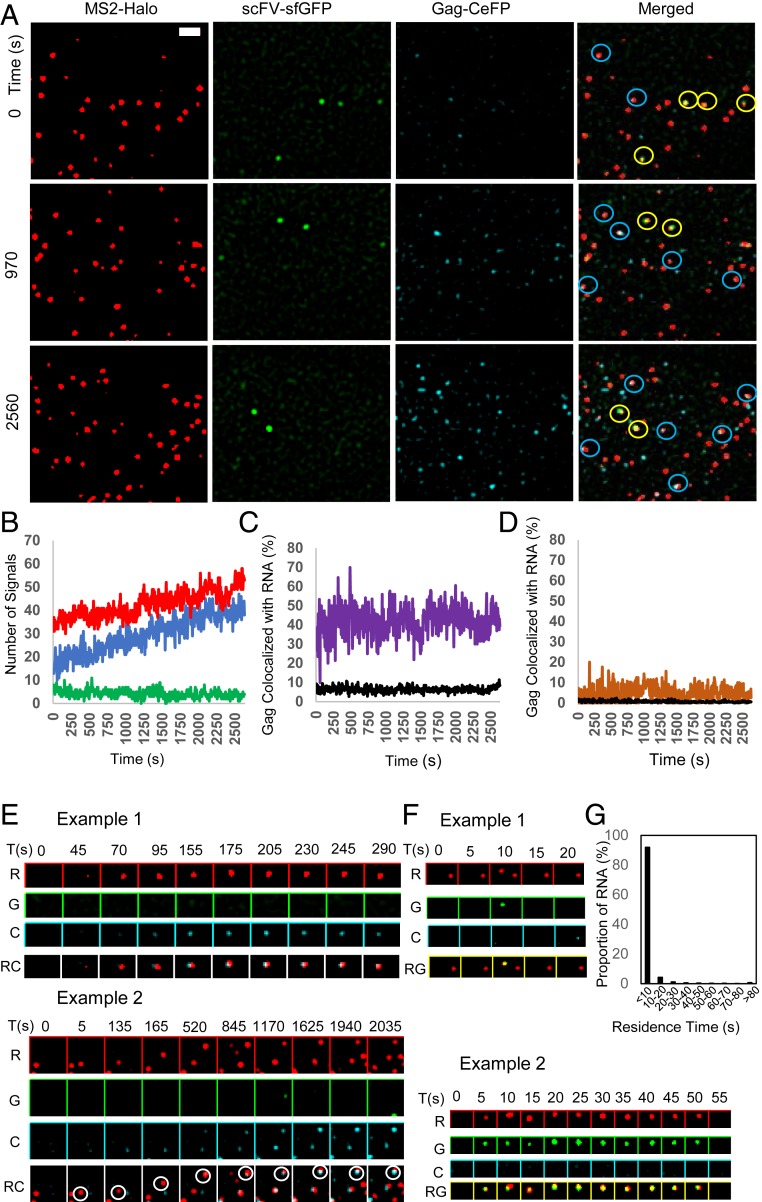
HIV-1 full-length RNA (HIV-1 RNA) plays a central role in viral replication, serving as a template for Gag/Gag-Pol translation and as a genome for the progeny virion. To gain a better understanding of the regulatory mechanisms of HIV-1 replication, we adapted a recently described system to visualize and track translation from individual HIV-1 RNA molecules in living cells. We found that, on average, half of the cytoplasmic HIV-1 RNAs are being actively translated at a given time. Furthermore, translating and nontranslating RNAs are well mixed in the cytoplasm; thus, Gag biogenesis occurs throughout the cytoplasm without being constrained to particular subcellular locations. Gag is an RNA binding protein that selects and packages HIV-1 RNA during virus assembly. A long-standing question in HIV-1 gene expression is whether Gag modulates HIV-1 RNA translation. We observed that despite its RNA-binding ability, Gag expression does not alter the proportion of translating HIV-1 RNA. Using single-molecule tracking, we found that both translating and nontranslating RNAs exhibit dynamic cytoplasmic movement and can reach the plasma membrane, the major HIV-1 assembly site. However, Gag selectively packages nontranslating RNA into the assembly complex. These studies illustrate that although HIV-1 RNA serves two functions, as a translation template and as a viral genome, individual RNA molecules carry out only one function at a time. These studies shed light on previously unknown aspects of HIV-1 gene expression and regulation.

Keywords: Gag; HIV; RNA; genome packaging; translation.


Conflict of interest statement

The authors declare no competing interest.

Figures

Fig. 1.
Fig. 1.
System used to visualize the translation of full-length HIV-1 RNA. (A) General structures of constructs used to detect HIV-1 RNA translation. GagSunTag-MSL contains two in-frame insertions in gag, a SunTag sequence and an AID sequence. Stem-loop sequences recognized by MSL were inserted into pol, and a mouse HAS gene is inserted into the nef gene (not illustrated). An NLS is located at the C termini of MS2-Halo and scFV-sfGFP protein. A vector containing an OsTIR1 gene was also expressed but is not illustrated. (B) U2OS cells containing a GagSunTag-MSL provirus were used for imaging studies. Both translating and nontranslating RNAs were labeled by MS2-Halo stained with JF549 dye (red). The nascent polypeptides associated with the translating RNA are detected by scFV-sfGFP (green). Thus, nontranslating RNA exhibits a red signal and translating RNA generats a red-green dual-colored signal. (C) Representative images of a U2OS cell in which both translating and nontranslating RNAs were detected in the cytoplasm. Red arrow, nontranslating RNA; yellow arrow, translating RNA. [Scale bar, 2 μm (both upper panel and enlargement).]
Fig. 2.
Fig. 2.
Validation of translating RNA detection. Images of cells were captured every 5 s for 13 frames, paused to allow the addition of puromycin (A) or cycloheximide (B), and resumed at the same frame rate. Representative images immediately before the pause (time 0) and 100 s after the pause are shown for puromycin (A) or cycloheximide (B) treatments; a Laplacian of Gaussian filter was applied by using ImageJ. (Scale bars, 2 μm.) (C) The proportion of red/green dual-colored signals before and after inhibitor treatment. The proportion of dual-colored signals at −60 s was defined as 100% and used to normalize data from other time points. Results from puromycin or cycloheximide treatment are shown by the orange and blue lines, respectively; the average and SD of three cells are shown.
Fig. 3.
Fig. 3.
Proportion of translating RNA determined using imaging and biochemical methods. (A) The proportion of translating RNA in 43 cells as determined by imaging. Each dot represents data from an individual cell. Mean and SD are shown. (B) The relationship between the amount of cytoplasmic RNA (x axis) and the proportion of translating RNA (y axis). (C) Representative ribosome profile from a fractionation experiment. (D) The proportion of translating RNA was determined using human 293T cells and human U2OS cells containing H0 provirus. Additionally, the proportion of translating RNA was determined in human U2OS cells containing GagSunTag-MSL provirus in the presence or absence of IAA. Averages and SDs from three independent fractionation experiments are shown.
Fig. 4.
Fig. 4.
Determining the properties of translating and nontranslating RNAs. (A) Representative trajectories of nontranslating and translating RNA tracks; trajectories are depicted with changing colors from start (red) to end (yellow). Distributions of the one-step jump distance of nontranslating (B) and translating RNA (C). To plot the jump distance distribution, data were binned (40-nm bin size) and normalized to the bin that contained the most events, which was set to 100; x axis, one-step jump distance (displacement); y axis, frequency in arbitrary units (a.u.). The distribution was fitted with a three-component model as previously described (14). The solid red line represents the fitted curve and the three dotted lines represent the distribution of each mobility fractions. (D) The spatial relationship between translating and nontranslating RNAs. The distances of individual translating RNA molecules to the nearest translating RNA (T to T) or to the nearest nontranslating RNA (T to N) in a representative cell are shown. To generate distances expected from a cell in which translating and nontranslating RNAs were mixed randomly, we used the spatial information of the RNAs, based on the number of translating RNA molecules in the cell, randomly assigned a subset of RNAs as translating RNAs, and measured the minimal distance of translating RNA to translating or nontranslating RNA; these values are shown as “Random.”
Fig. 5.
Fig. 5.
The effects of Gag expression on HIV-1 RNA translation. (A) Schematic of the experimental approach. Gag- and Gag-CeFP–expressing plasmids were transfected into GagSunTag-MSL-provirus containing U2OS cells before imaging. (B) Representative images of RNA, translating polypeptide, and Gag-CeFP signals in a cell. Insets shown on the left images are enlarged and shown on the right. (Scale bars, 2 μm.) (C) Quantitation of the proportion of HIV-1 translating RNAs. (D) General structure of the GagLZ-SunTag-MSL construct. The NC domain of Gag was replaced with an LZ motif.
Fig. 6.
Fig. 6.
Determining the translation status of HIV-1 RNA assembling with Gag at the plasma membrane by TIRF microscopy. (A) Representative images of RNA (MS2-Halo, red), translating polypeptide (scFV-sfGFP, green), and Gag-CeFP (cyan) signals at the plasma membrane at various times during observation. Blue circles, colocalized red and cyan signals; yellow circles, colocalized red and green signals. A Laplacian of Gaussian filter was applied using ImageJ. (Scale bar, 2 μm.) (B) Proportion of the HIV-1 RNA signals and Gag-CeFP puncta detected near the plasma membrane through observation time. Red, green, and blue lines represent the number of nontranslating RNA molecules with only a red signal, translating RNA with dual-colored signal, and Gag-CeFP puncta, respectively. Proportions of Gag-CeFP puncta colocalized with nontranslating RNA (C) and translating RNA (D) are shown as purple and orange lines, respectively. Black lines represent the proportion of Gag-CeFP expected to colocalize with each type of RNA by random distribution. (E) Representative images of nontranslating RNA (red signal) interacting and colocalizing with Gag (CeFP signal). Images obtained in the red, green, and cyan channels are marked as R, G, and C, respectively. RC, merged images of both the red and cyan channels. Images were captured every 5 s; time (in seconds) of image capture during observation is shown on top of the panels as T(s). (F) Representative images of the arrival and departure of translating RNA near the plasma membrane. RG, merged images of both the red and green channels. Image magnification in E and F is same as in A. (G) Residence time of translating RNA near the plasma membrane. The plasma membrane residence time of 3,263 green signals was separated into multiple bins and displayed. y axis, proportion of RNA (%); x axis, residence time.

References

    1. Freed E. O., Martin M. A., “Human immunodeficiency viruses: Replication” in Fields Virology, Knipe D. M., Howley P. M., Eds. (Lippincott, Williams, & Wilkins, Philadelphia, PA, ed. 6, 2013), vol. II, pp. 1502–1560.
    1. Stoltzfus C. M., Chapter 1. Regulation of HIV-1 alternative RNA splicing and its role in virus replication. Adv. Virus Res. 74, 1–40 (2009). - PubMed
    1. Kuzembayeva M., Dilley K., Sardo L., Hu W. S., Life of psi: How full-length HIV-1 RNAs become packaged genomes in the viral particles. Virology 454-455, 362–370 (2014). - PMC - PubMed
    1. Swanstrom R., Wills J. W., “Synthesis, assembly, and processing of viral proteins” in Retroviruses, Coffin J. M., Hughes S. H., Varmus H. E., Eds. (Cold Spring Harbor Press, Cold Spring Harbor, 1997), pp. 263–334. - PubMed
    1. Freed E. O., HIV-1 assembly, release and maturation. Nat. Rev. Microbiol. 13, 484–496 (2015). - PMC - PubMed

Publication types

MeSH terms

Substances

LinkOut - more resources