. 2020 Mar 4;11(1):1189.
doi: 10.1038/s41467-020-15020-6.

Differential DNA methylation of vocal and facial anatomy genes in modern humans

Affiliations

Differential DNA methylation of vocal and facial anatomy genes in modern humans

David Gokhman et al. Nat Commun. .

Abstract

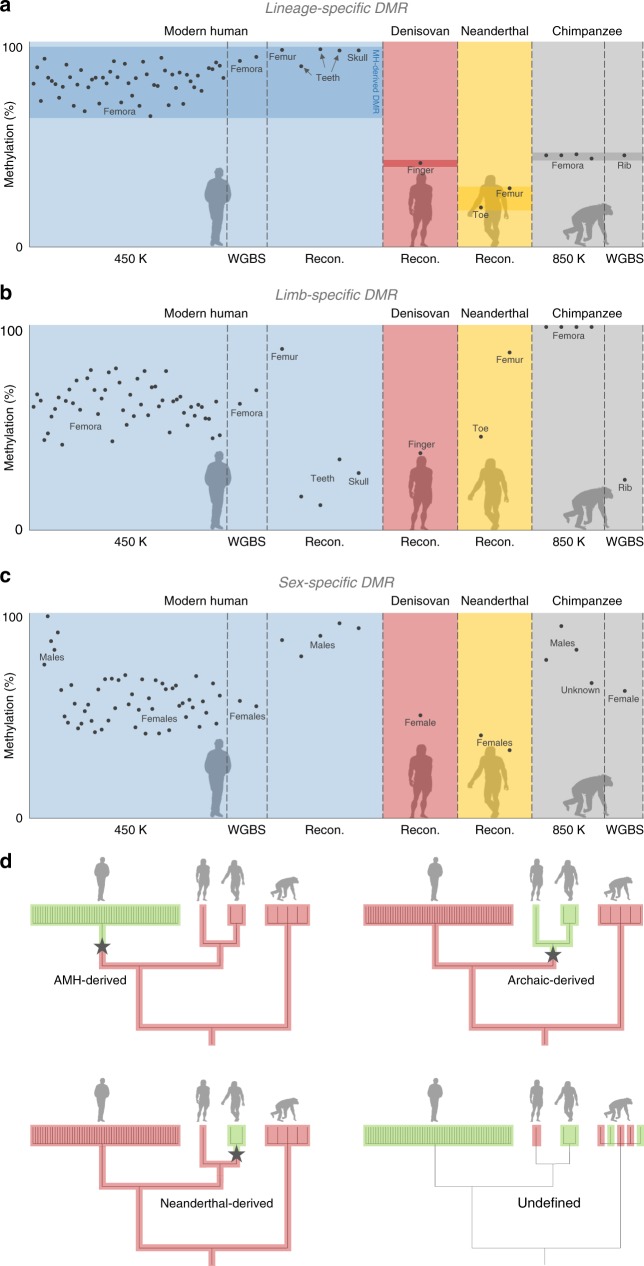
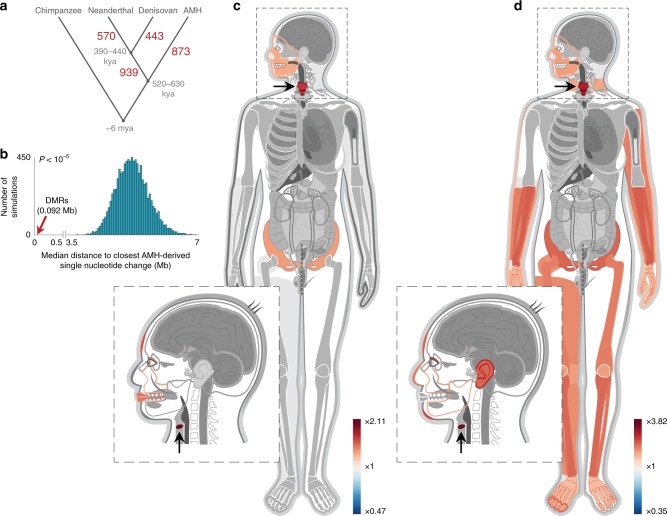
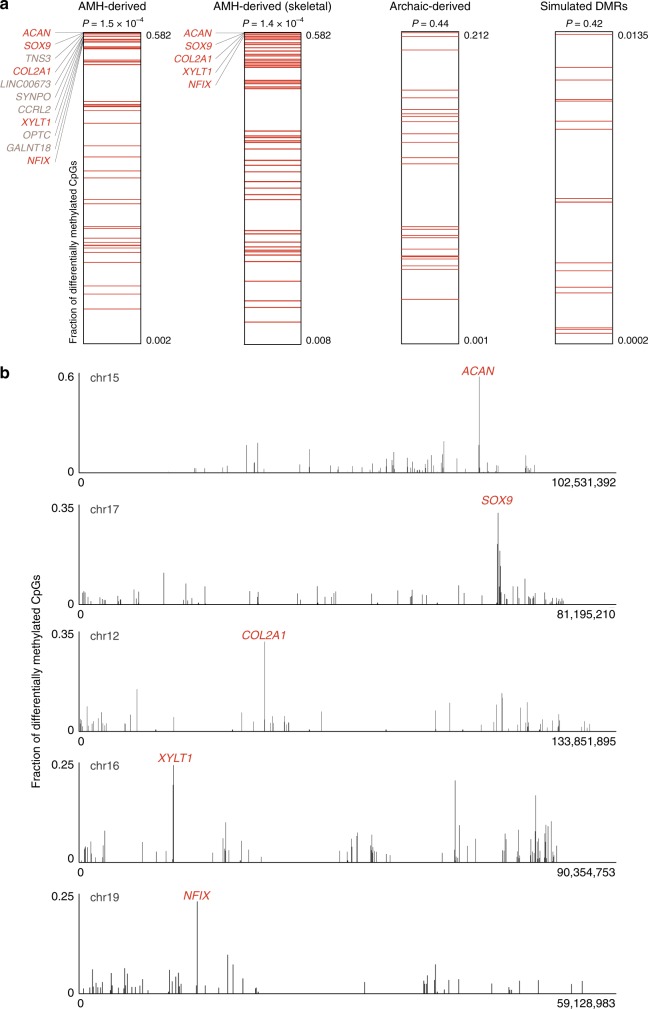
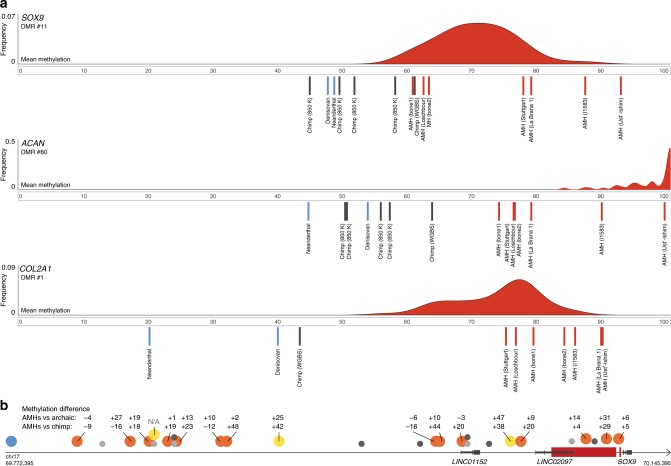
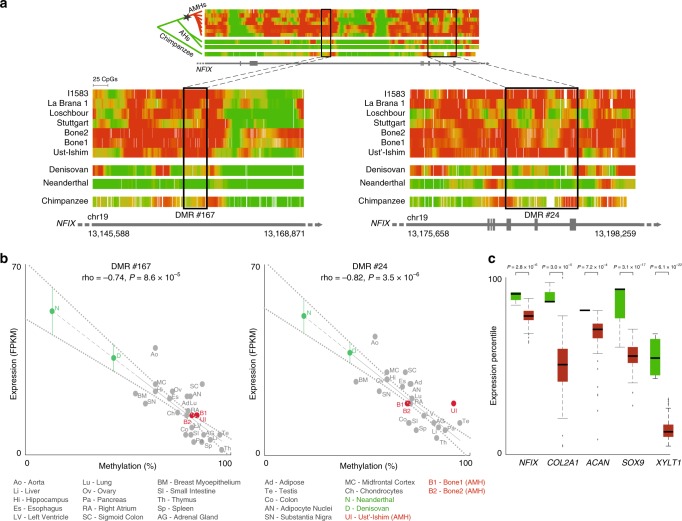
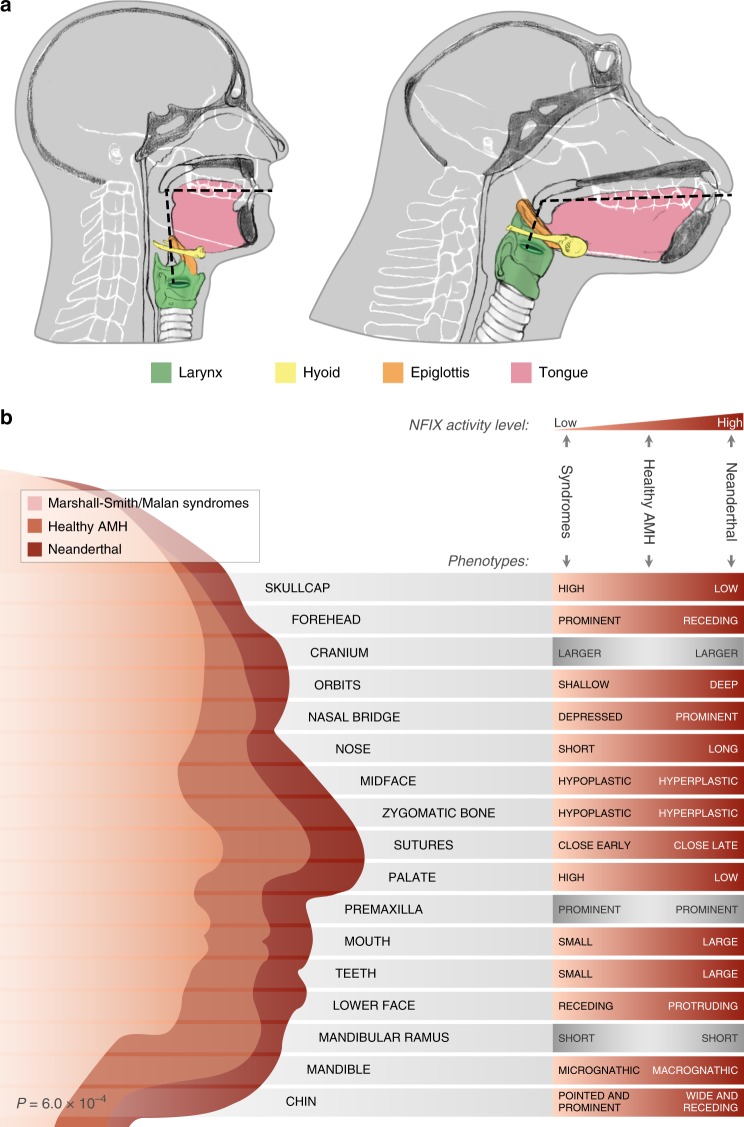
Changes in potential regulatory elements are thought to be key drivers of phenotypic divergence. However, identifying changes to regulatory elements that underlie human-specific traits has proven very challenging. Here, we use 63 reconstructed and experimentally measured DNA methylation maps of ancient and present-day humans, as well as of six chimpanzees, to detect differentially methylated regions that likely emerged in modern humans after the split from Neanderthals and Denisovans. We show that genes associated with face and vocal tract anatomy went through particularly extensive methylation changes. Specifically, we identify widespread hypermethylation in a network of face- and voice-associated genes (SOX9, ACAN, COL2A1, NFIX and XYLT1). We propose that these repression patterns appeared after the split from Neanderthals and Denisovans, and that they might have played a key role in shaping the modern human face and vocal tract.


Conflict of interest statement

The authors declare no competing interests.

Figures

Fig. 1
Fig. 1. Variability filtering and lineage assignment.
a Methylation levels across AMH, Denisovan, Neanderthal, and chimpanzee samples in DMR#278 (chr4:38,014,896–38,016,197). This is an example of a lineage-specific DMR, defined as a locus in which all samples of a group are found outside the range of methylation in the other groups. Chimpanzee samples were used during the following step of lineage assignment. b A putative limb-specific DMR (chr3:14,339,371–14,339,823) which was removed from the analysis, as it does not comply with our definition of lineage-specific DMRs. Femur, toe, and finger samples are hypermethylated compared to other skeletal elements. Toe and finger are found at the bottom range of limb samples, suggesting some variation in this locus within limb samples too. c A putative sex-specific DMR (chr3:72,394,336–72,396,901) which was removed from the analysis. Males are hypermethylated compared to females. d Lineage assignment using chimpanzee samples. Only DMRs that passed the previous variability filtering steps were analyzed. Each bar at the tree leaves represents a locus in a sample. Methylation levels of the locus in each sample are marked with red (methylated) and green (unmethylated). The lineage where the methylation change has likely occurred (by parsimony) is marked by a star. Branch lengths are not scaled.
Fig. 2
Fig. 2. Genes affecting voice and face are the most over-represented within AMH-derived DMRs.
a The number of DMRs that emerged along each of the human branches. Divergence times are in thousands of years ago (kya). b Distribution of median distances (turquoise) of DMRs to randomized single nucleotide changes that separate AMHs from archaic humans and chimpanzees. Genomic positions of single nucleotide changes were allocated at random. This was repeated 10,000 times. Red arrow marks the observed distance of DMRs, showing that they tend to be significantly closer to AMH-derived single nucleotide changes than expected by chance. This suggests that some of these sequence changes might be associated with the changes in methylation. c A heat map representing the level of enrichment of each anatomical part within the AMH-derived DMRs. Only body parts that are significantly enriched (FDR < 0.05) are colored. Three skeletal parts are significantly over-represented: the face, pelvis, and larynx (voice box, marked with arrows). d Enrichment levels of anatomical parts within the most significant (top quartile, Q statistic) AMH-derived DMRs, showing a more pronounced enrichment of genes affecting vocal and facial anatomy.
Fig. 3
Fig. 3. The extent of differential methylation is highest among genes associated with the voice.
a Within each lineage, the fraction of differentially methylated CpGs was computed as the number of derived CpGs per 100 kb centered around the middle of each DMR. DMRs were ranked according to the fraction of derived CpG positions in their vicinity. DMRs in genes associated with the voice are marked with red lines. In AMHs, DMRs in voice-affecting genes tend to be ranked significantly higher. Although known voice-associated genes comprise less than 2% of the genome, three of the top five AMH-derived DMRs, and all top five skeleton-related AMH-derived DMRs are in genes known to associate with the voice. In archaic-derived DMRs and in simulated DMRs, voice-associated genes do not show higher ranking compared to the rest of the DMGs. t-test P-values are shown for each group. b The fraction of differentially methylated CpGs along the five chromosomes containing ACAN, SOX9, COL2A1, XYLT1, and NFIX. In each of these chromosomes, the most extensive changes are found within these genes. All five genes control facial projection and the development of the larynx.
Fig. 4
Fig. 4. Hypermethylation of SOX9, ACAN, and COL2A1 in AMHs.
a Methylation levels in the AMH-derived DMRs in SOX9, ACAN, and COL2A1. AMH samples are marked with red lines, archaic human samples are marked with blue lines and chimpanzee samples are marked with gray lines. The distribution of methylation across 52 AMH samples (450K methylation arrays) is presented in red. b SOX9 and its upstream regulatory elements. AMH-derived DMRs are marked with red rectangles. Previously identified putative enhancers are marked with circles: human craniofacial (orange), human craniofacial, chimpanzee-biased (blue), human skeletal (yellow), human non-skeletal (dark gray), and mouse (light gray). Numbers above skeletal enhancers show the difference in mean bone methylation between AMHs and archaic humans (top) and between AMHs and chimpanzee (bottom). Across almost all SOX9 enhancers, AMHs are hypermethylated compared to archaic humans and the chimpanzee.
Fig. 5
Fig. 5. DNA methylation and expression pattern of NFIX in modern and archaic humans.
a Methylation levels along NFIX, color-coded from green (unmethylated) to red (methylated). Methylation levels around the two AMH-derived DMRs (#24 and #167) are shown in the zoomed-in panels. These two DMRs represent the regions where the most significant methylation changes are observed, but hypermethylation of NFIX in AMHs can be seen throughout the entire gene body. Chimpanzee and present-day samples were smoothed using the same sliding window as in ancient samples to allow easier comparison. The inferred schematic regulatory evolution of NFIX is shown using a phylogenetic tree to the left of the top panel. Star marks the shift in methylation from unmethylated (green) to methylated (red). b Methylation levels in DMRs #167 and #24 vs. expression levels of NFIX across 22 AMH tissues (gray). In both DMRs, higher methylation is significantly associated with lower expression of NFIX. Ust’-Ishim, Bone1 and Bone2 methylation levels (red) are plotted against mean NFIX expression across 13 osteoblast lines. Neanderthal and Denisovan methylation levels (green) are plotted against their predicted expression levels, based on the extrapolated regression line (dashed). Standard errors are marked with dotted lines. The expression levels of NFIX in Neanderthal and Denisovan shown in these graphs are extrapolated (green dots). c Box plots of expression levels of NFIX, COL2A1, ACAN, SOX9, and XYLT1 in 89 AMH samples (red) and four mouse samples (green) from appendicular bones (limbs and pelvis). Central line shows mean, box borders show 25th and 75th percentiles, whiskers extend to the most extreme data points not considered outliers, crosses show outliers. Expression levels were converted to percentiles based on the level of gene expression compared to the rest of the genome in each sample. t-test P-values are shown for each gene.
Fig. 6
Fig. 6. NFIX down-regulation is associated with modern human-derived traits.
a Vocal anatomy of chimpanzee and AMH. The vocal tract is the cavity from the lips to the larynx (marked by dashed lines). In AMHs, the flattening of the face together with the descent of the larynx led to approximately 1:1 proportions of the horizontal and vertical portions of the vocal tract. b Craniofacial features of the Neanderthal, healthy AMH, and AMH with Marshall-Smith or Malan syndromes. Each box shows a phenotype that occurs in the Marshall-Smith/Malan syndromes (i.e., when NFIX is partially or completely inactive). The righthand side of each box shows the observed phenotypes of individuals with the syndromes (left), healthy AMHs (middle) and Neanderthals (right). In most phenotypes, the observed phenotypes match the expected phenotypes based on NFIX expression. Binomial test P-value is shown.

Similar articles

Cited by

References

    1. Prüfer K, et al. The complete genome sequence of a Neanderthal from the Altai Mountains. Nature. 2014;505:43–49. doi: 10.1038/nature12886. - DOI - PMC - PubMed
    1. King MC, Wilson AC. Evolution at two levels in humans and chimpanzees. Science. 1975;188:107–116. doi: 10.1126/science.1090005. - DOI - PubMed
    1. Hernando-Herraez, I., Garcia-Perez, R., Sharp, A. J. & Marques-Bonet, T. DNA methylation: insights into human evolution. PLoS Genet.11, (2015). - PMC - PubMed
    1. Gokhman, D. et al. Reconstructing the DNA methylation maps of the Neandertal and the Denisovan. Science344, 523–527 (2014). - PubMed
    1. Prüfer K, et al. A high-coverage Neandertal genome from Vindija Cave in Croatia. Science. 2017;358:655–658. doi: 10.1126/science.aao1887. - DOI - PMC - PubMed

Publication types

MeSH terms