. 2020 Mar 4;10(1):4045.
doi: 10.1038/s41598-020-60691-2.

Lactation stage impacts the glycolytic function of bovine CD4+ T cells during ex vivo activation

Affiliations

Lactation stage impacts the glycolytic function of bovine CD4+ T cells during ex vivo activation

Jordan M Eder et al. Sci Rep. .

Abstract

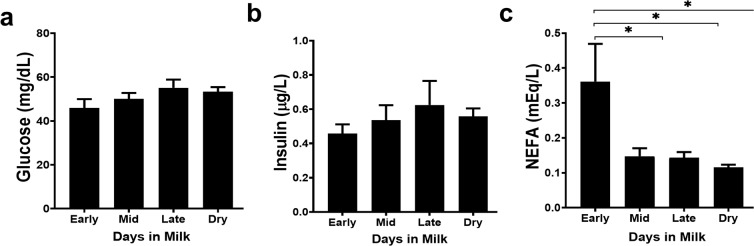
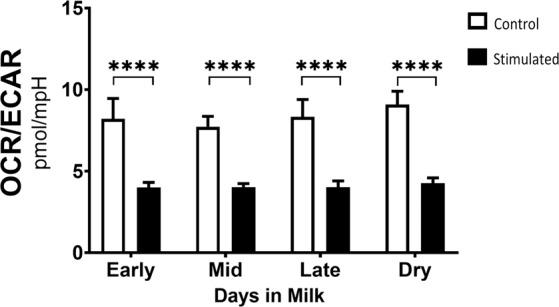
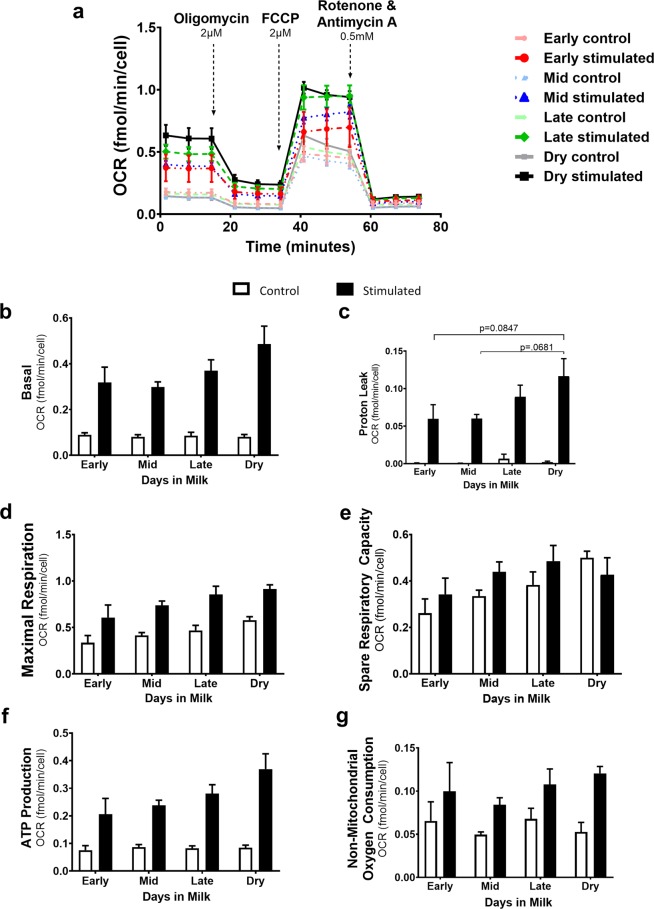
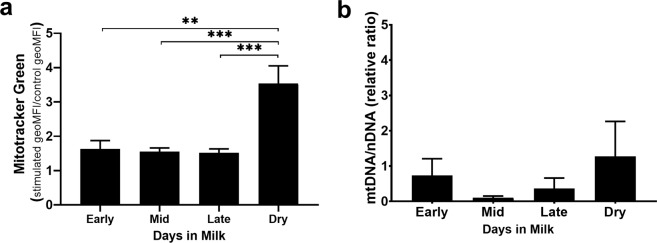
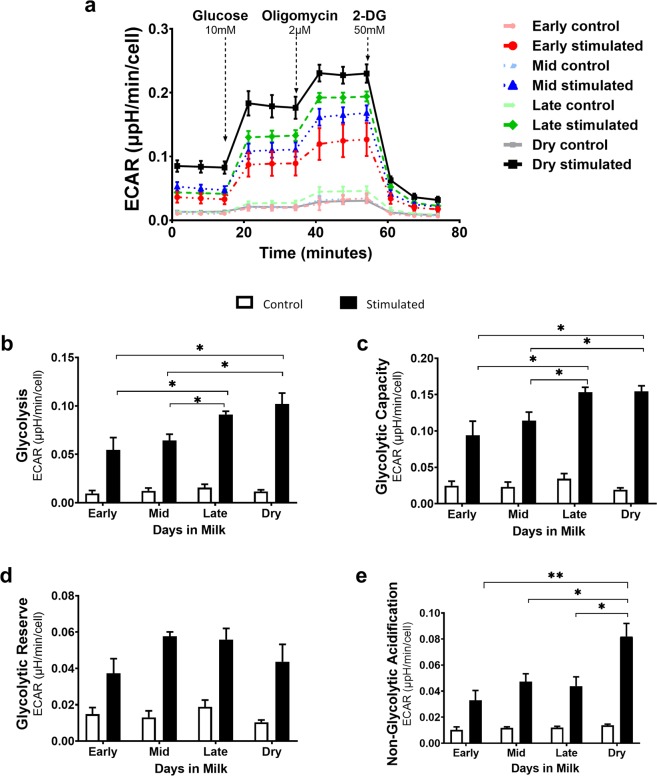
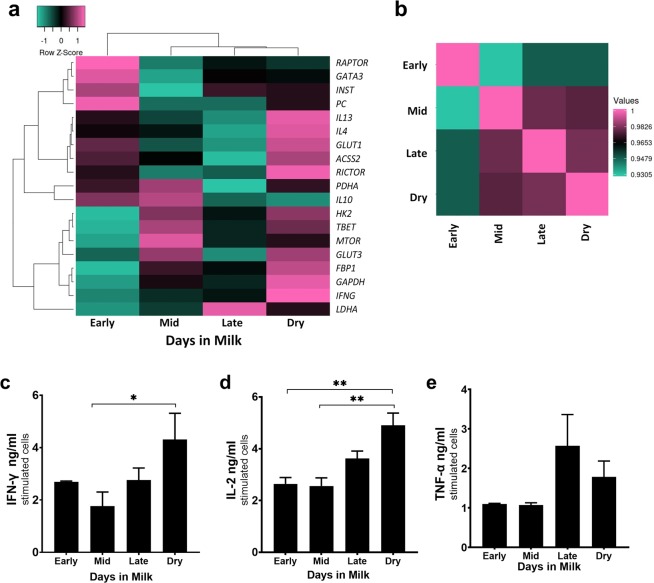
Dairy cattle undergo dynamic physiological changes over the course of a full lactation into the dry period, which impacts their immunocompetence. During activation, T cells undergo a characteristic rewiring to increase the uptake of glucose and metabolically reprogram to favor aerobic glycolysis over oxidative phosphorylation. To date it remains to be completely elucidated how the altered energetic demands associated with lactation in dairy cows impacts T cell metabolic reprogramming. Thus, in our ex vivo studies we have examined the influence of stage of lactation (early lactation into the dry period) on cellular metabolism in activated bovine CD4+ T cells. Results showed higher rates of glycolytic function in activated CD4+ T cells from late lactation and dry cows compared to cells from early and mid-lactation cows. Similarly, protein and mRNA expression of cytokines were higher in CD4+ T cells from dry cows than CD4+ T cells from lactating cows. The data suggest CD4+ T cells from lactating cows have an altered metabolic responsiveness that could impact the immunocompetence of these animals, particularly those in early lactation, and increase their susceptibility to infection.


Conflict of interest statement

The authors declare no competing interests.

Figures

Figure 1
Figure 1
Glucose, insulin, and non-esterified fatty acids concentrations were determined from serum samples from dairy cows from different lactation stages and dry cows. Cows were separated into groups according to lactation stage as determined by days in milk (DIM) or indicated as dry for those not lactating. Early lactation cows (n = 5) were 14–43 DIM, mid lactation cows (n = 6) were 81–147 DIM, late lactation cows (n = 6) were 243–354 DIM, and dry cows are not lactating. Glucose and NEFAs were analyzed by colorimetric assay and insulin was analyzed by using an ELISA. Data shown are mean ± SEM. One-way ANOVA with Sidak’s multiple comparisons among all stages. *p < 0.05.
Figure 2
Figure 2
Metabolic reprogramming was observed in activated CD4+ T cells from dairy cows. (a) Peripheral blood CD4+ T cells were sorted and activated for 24 hours with plate-bound CD3 (5 μg/ml) and soluble CD28 (1 μg/ml) mAb and their metabolic phenotype was analyzed using the Seahorse extracellular flux analyzer. The OCR/ECAR ratio was measured from stimulated (black bars) and control T cells (white bars) in each lactation stages- early (14–43 DIM, n = 5), mid (81–147 DIM, n = 6), late (243–354 DIM, n = 6), dry (not lactating, n = 6). Data were log-transformed and shown are mean ± SEM. P values of CD4+ T cells were calculated by ordinary two-way ANOVA and Sidak’s multiple comparison post-hoc. ****p < 0.001.
Figure 3
Figure 3
Mitochondrial function of peripheral blood CD4+ T cells from dairy cows of different lactation stages was assessed. Peripheral blood CD4+ T cells were sorted and activated with plate-bound CD3 (5 μg/ml) and soluble CD28 (1 μg/ml) mAb for 24 hours and mitochondria function was analyzed using the XF Cell Mito Stress Test kit (black lines/bars). Lighter lines/white bars represent control, unstimulated cells cultured for 24 hours, used as a point of reference for stimulated CD4+ T cells (darker lines/black bars) from cows in different stages of lactation and dry cows. Lactation stages were assigned as the following: early (14–43 DIM, n = 5), mid (81–147 DIM, n = 6), late (243–354 DIM, n = 6), dry (not lactating, n = 6). (a) Mitochondria function kinetics were recorded in real-time measuring oxygen consumption rate (OCR) under basal conditions and in response to electron transport chain inhibitors oligomycin (complex V), FCCP (a protonophore), and rotenone and antimycin A (complex I and complex III). This was used to calculate the following parameters: (b) Basal OCR, (c) Proton Leak, (d) Maximal Respiration, (e) Spare Respiratory Capacity, and (f) ATP Production. Data shown are mean ± SEM. Mitochondrial stress test was analyzed by Kruskal-Willis and Dunn test for multiple comparisons, post-hoc. Adjusted p-values were reported using Benjamini-Hochberg multiple comparison correction and false discover rate (FDR). *p < 0.05. FCCP, carbonyl cyanide-4-(trifluoromethoxy) phenylhydrazone.
Figure 4
Figure 4
Mitochondria mass assessed as part of functional differences of activated bovine CD4+ T cells. Peripheral blood CD4+ T cells from dairy cows were stimulated ex vivo for 24 hours with plate-bound CD3 (5 μg/ml) and soluble CD28 (1 μg/ml) mAb. Cells were stained with (a) Mitotracker green (25 nM) to determine mitochondrial mass by flow cytometry. Data represents geometric MFI (geoMFI) ratio of stimulated to unstimulated CD4+ T cells from each lactation stage, early (14–43 DIM, n = 5), mid (81–147 DIM, n = 6), late (243–354 DIM, n = 6), dry (not lactating, n = 6). (b) qPCR analysis of relative mitochondrial DNA to nuclear DNA ratio (mtDNA/nDNA). Data presented are mean ± SEM. Ratio of Mitotracker green geoMFI was analyzed with one-way ANOVA using Tukey’s multiple comparison of CD4+ T cells among all stages. mtDNA/nDNA was analyzed with Brown-Forsythe ANOVA with Dunnett T3 multiple comparison test **p < 0.01, ***p < 0.001.
Figure 5
Figure 5
Metabolic shift towards aerobic glycolysis occurs in activated bovine CD4+ T cells. The glycolytic function was assessed using the XF Glycolysis Stress Test kit on bovine CD4+ T cells isolated from peripheral blood. Cells were activated ex vivo for 24 hours with plate-bound CD3 (5 μg/ml) and soluble CD28 (1 μg/ml) mAb. Stimulated cells are represented by darker lines/black bars. Control, unstimulated cells are represented by lighter lines/white bar and were cultured for 24 h. Extracellular acidification rate (ECAR) was recorded in real-time showing glycolytic function in a kinetic graph. (a) Cells were starved of glucose for 1 hour, the first injection of 10 mM glucose measures (b) the rate of glycolysis. Other parameters measured include (c) glycolytic capacity, (d) glycolytic reserve and (e) non-glycolytic acidification. Data presented are mean ± SEM. Glycolytic stress test was analyzed by Kruskal-Willis and Dunn test for multiple comparisons, post-hoc. Adjusted p-values were reported using Benjamini-Hochberg multiple comparison correction and false discover rate (FDR). *p < 0.05. Note: Oligomycin stimulates maximum ECAR by inhibiting ATP synthase. 2-deoxyglucose (2-DG) inhibits glycolysis and provides baseline ECAR.
Figure 6
Figure 6
mRNA expression of enzymes and proteins involved in the immune response differ among lactation group. Peripheral blood CD4+ T cells were sorted and activated for 24 hours with plate-bound CD3 (5 μg/ml) and soluble CD28 (1 μg/ml) mAb. qPCR relative expression is the log2 of stimulated cells to unstimulated cells. (a) Expression-based heatmap of 19 genes involved in eliciting an immune response were analyzed and hierarchically clustered by average linking and Pearson’s distance measurement by the log2 relative expression from qPCR. (b) Pairwise Pearson’s correlation plot of the lactation groups (Pearson correlation coefficient 0.9305–1 for all lactation stages). Supernatants from unstimulated cells and cells stimulated for 24 hours with anti-CD3:anti-CD28 were used in ELISAs detecting the following cytokines (c) IFN-γ, (d) IL-2, (e) TNF-α. Unstimulated cells were below the level of detection in all ELISAs. Data presented are the mean ± SEM. One-way ANOVA with Tukey’s multiple comparison of CD4+ T cells among all stages. *p < 0.05, **p < 0.01.

References

    1. Bell AW, Bauman DE. Adaptations of glucose metabolism during pregnancy and lactation. J. Mammary Gland Biol. Neoplasia. 1997;2:265–78. doi: 10.1023/A:1026336505343. - DOI - PubMed
    1. Wu G, Greene LW. Glutamine and glucose metabolism in bovine blood lymphocytes. Comp. Biochem. Physiol. B. 1992;103:821–5. doi: 10.1016/0305-0491(92)90199-2. - DOI - PubMed
    1. Ingvartsen KL, Moyes KM. Factors contributing to immunosuppression in the dairy cow during the periparturient period. Jpn. J. Vet. Res. 2015;63(Suppl 1):S15–24. - PubMed
    1. Jacobs SR, et al. Glucose uptake is limiting in T cell activation and requires CD28-mediated Akt-dependent and independent pathways. J. Immunol. 2008;180:4476–86. doi: 10.4049/jimmunol.180.7.4476. - DOI - PMC - PubMed
    1. Palmer CS, Ostrowski M, Balderson B, Christian N, Crowe SM. Glucose metabolism regulates T cell activation, differentiation, and functions. Front. Immunol. 2015;6:1. doi: 10.3389/fimmu.2015.00001. - DOI - PMC - PubMed