

Tibial subchondral trabecular bone micromechanical and microarchitectural properties are affected by alignment and osteoarthritis stage
- PMID: 32132556
- PMCID: PMC7055326
- DOI: 10.1038/s41598-020-60464-x
Tibial subchondral trabecular bone micromechanical and microarchitectural properties are affected by alignment and osteoarthritis stage
Abstract
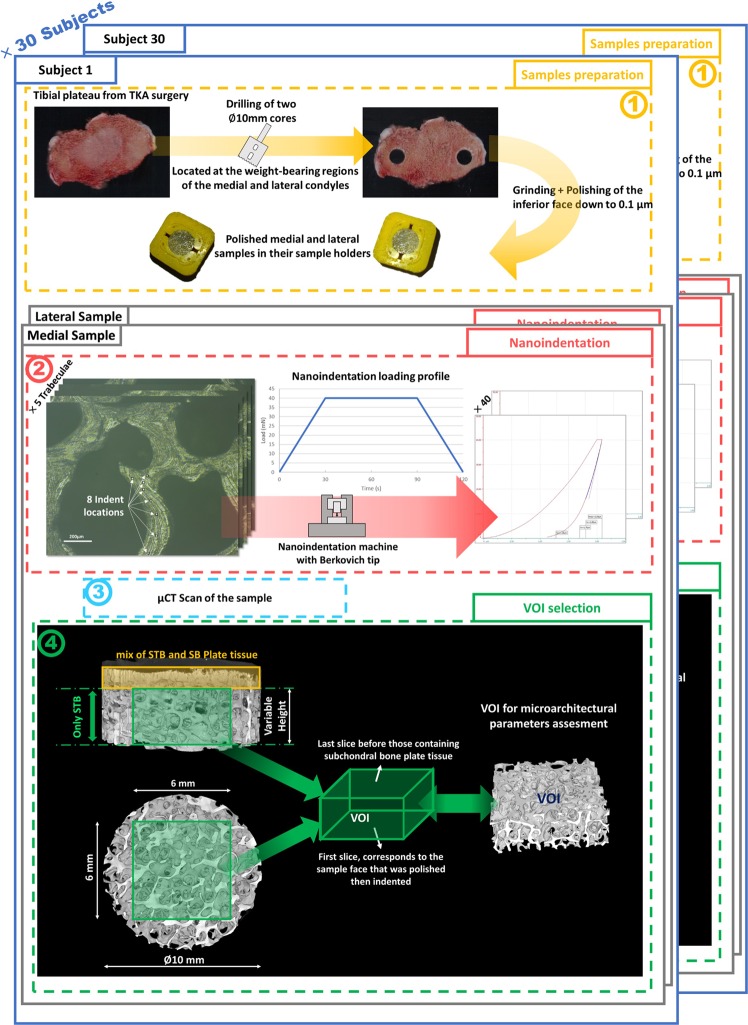
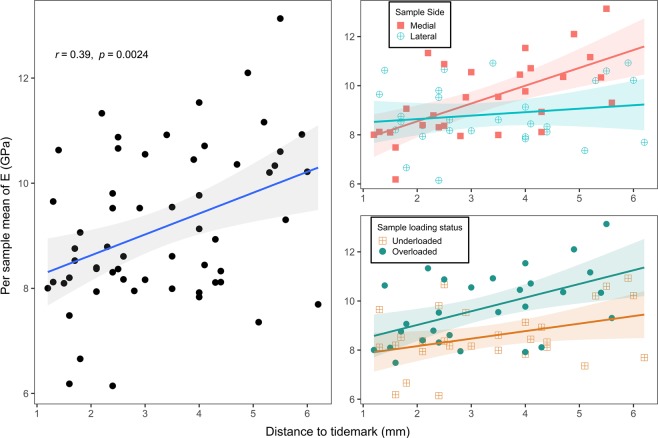
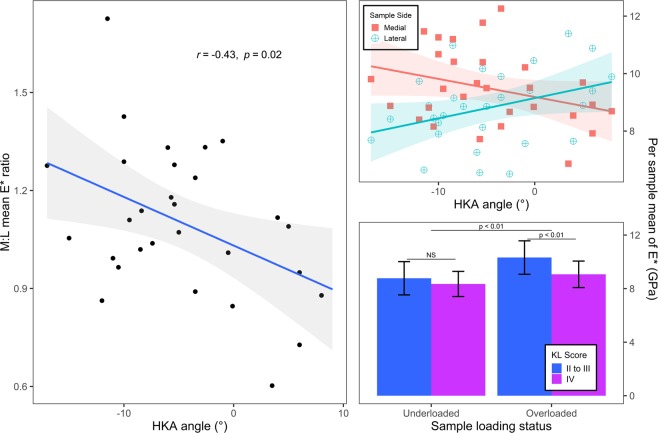
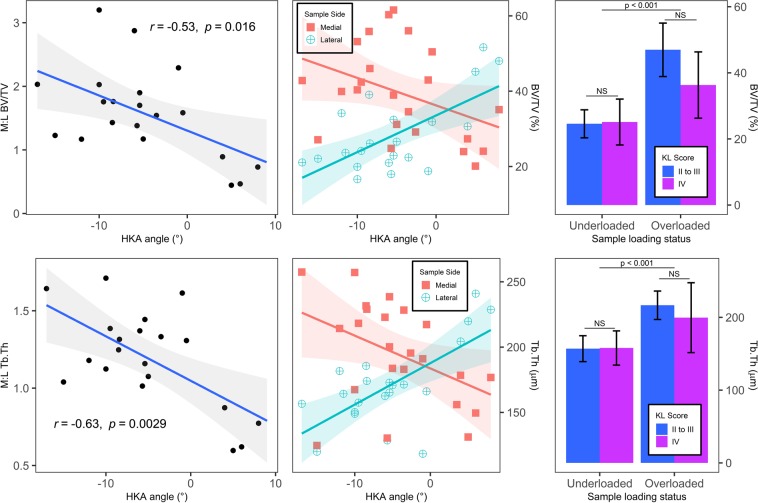
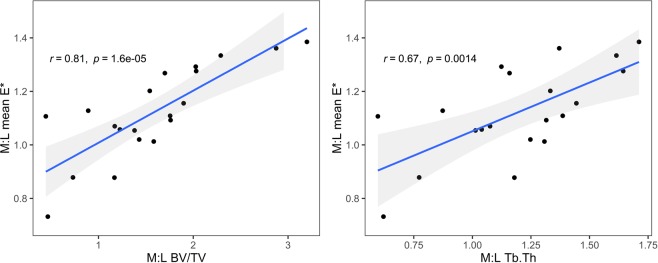
At advanced knee osteoarthritis (OA) stages subchondral trabecular bone (STB) is altered. Lower limb alignment plays a role in OA progression and modify the macroscopic loading of the medial and lateral condyles of the tibial plateau. How the properties of the STB relate to alignment and OA stage is not well defined. OA stage (KL scores 2-4) and alignment (HKA from 17° Varus to 8° Valgus) of 30 patients were measured and their tibial plateau were collected after total knee arthroplasty. STB tissue elastic modulus, bone volume fraction (BV/TV) and trabecula thickness (Tb.Th) were evaluated with nanoindentation and µCT scans (8.1 µm voxel-size) of medial and lateral samples of each plateau. HKA and KL scores were statistically significantly associated with STB elastic modulus, BV/TV and Tb.Th. Medial to lateral BV/TV ratio correlated with HKA angle (R = -0.53, p = 0.016), revealing a higher ratio for varus than valgus subjects. STB properties showed lower values for KL stage 4 patients. Tissue elastic modulus ratios and BV.TV ratios were strongly correlated (R = 0.81, p < 0.001). Results showed that both micromechanical and microarchitectural properties of STB are affected by macroscopic loading at late stage knee OA. For the first time, a strong association between tissue stiffness and quantity of OA STB was demonstrated.
Conflict of interest statement
The authors declare no competing interests.
Figures
Similar articles
-
Association between knee alignment, osteoarthritis disease severity, and subchondral trabecular bone microarchitecture in patients with knee osteoarthritis: a cross-sectional study.Arthritis Res Ther. 2020 Sep 4;22(1):203. doi: 10.1186/s13075-020-02274-0. Arthritis Res Ther. 2020. PMID: 32887657 Free PMC article.
-
Tibial cartilage, subchondral bone plate and trabecular bone microarchitecture in varus- and valgus-osteoarthritis versus controls.J Orthop Res. 2021 Sep;39(9):1988-1999. doi: 10.1002/jor.24914. Epub 2020 Nov 25. J Orthop Res. 2021. PMID: 33241575
-
Systematic mapping of the subchondral bone 3D microarchitecture in the human tibial plateau: Variations with joint alignment.J Orthop Res. 2017 Sep;35(9):1927-1941. doi: 10.1002/jor.23474. Epub 2016 Nov 28. J Orthop Res. 2017. PMID: 27891668
-
In vivo analysis of subchondral trabecular bone in patients with osteoarthritis of the knee using second-generation high-resolution peripheral quantitative computed tomography (HR-pQCT).Bone. 2020 Mar;132:115155. doi: 10.1016/j.bone.2019.115155. Epub 2019 Nov 14. Bone. 2020. PMID: 31733422
-
Highly variable coronal tibial and femoral alignment in osteoarthritic knees: a systematic review.Knee Surg Sports Traumatol Arthrosc. 2019 May;27(5):1368-1377. doi: 10.1007/s00167-019-05506-2. Epub 2019 Apr 15. Knee Surg Sports Traumatol Arthrosc. 2019. PMID: 30989273
Cited by
-
Freezing does not influence the microarchitectural parameters of the microstructure of the freshly harvested femoral head bone.Cell Tissue Bank. 2024 Sep;25(3):747-754. doi: 10.1007/s10561-024-10147-y. Epub 2024 Aug 5. Cell Tissue Bank. 2024. PMID: 39103569
-
Multiscale Femoral Neck Imaging and Multimodal Trabeculae Quality Characterization in an Osteoporotic Bone Sample.Materials (Basel). 2022 Nov 14;15(22):8048. doi: 10.3390/ma15228048. Materials (Basel). 2022. PMID: 36431532 Free PMC article.
-
The supercritical CO2 process does not affect the mechanical properties and the microarchitecture of trabecular bone at the microscopic scale: A microindentation and microcomputed tomography study.Bone Rep. 2025 Jul 25;26:101859. doi: 10.1016/j.bonr.2025.101859. eCollection 2025 Sep. Bone Rep. 2025. PMID: 40757247 Free PMC article.
-
3D Printed Multiphasic Scaffolds for Osteochondral Repair: Challenges and Opportunities.Int J Mol Sci. 2021 Nov 17;22(22):12420. doi: 10.3390/ijms222212420. Int J Mol Sci. 2021. PMID: 34830302 Free PMC article. Review.
-
3D profiling of mouse epiphyses across ages reveals new potential imaging biomarkers of early spontaneous osteoarthritis.J Anat. 2023 Jun;242(6):1037-1050. doi: 10.1111/joa.13834. Epub 2023 Feb 11. J Anat. 2023. PMID: 36772893 Free PMC article.
References
-
- Hurwitz DE, Ryals AR, Karar A, Case JP, Andriacchi TP. Static Alignment is a Better Indicator of the Dynamic Knee Joint Loads During Gait in Subjects with Knee Osteoarthritis Than Radiographic Disease Severity, Toe Out Angle and Pain. Orthop. Res. Soc. 2002;20:101–107. doi: 10.1016/S0736-0266(01)00081-X. - DOI - PubMed
Publication types
MeSH terms
LinkOut - more resources
Full Text Sources
