. 2020 Mar 4;10(1):4022.
doi: 10.1038/s41598-020-60875-w.

Networks and long-range mobility in cities: A study of more than one billion taxi trips in New York City

Affiliations

Networks and long-range mobility in cities: A study of more than one billion taxi trips in New York City

A P Riascos et al. Sci Rep. .

Abstract

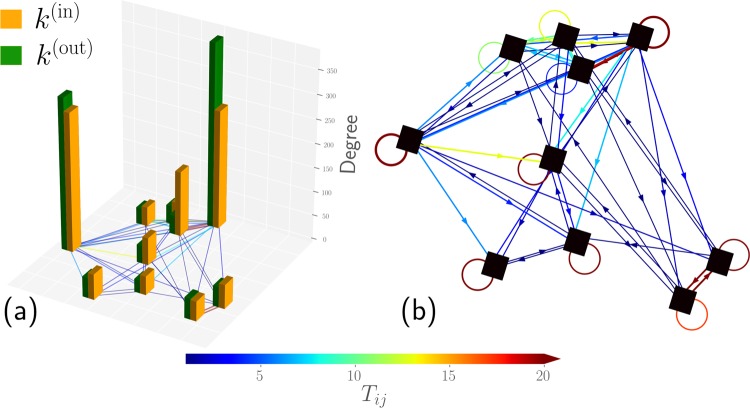
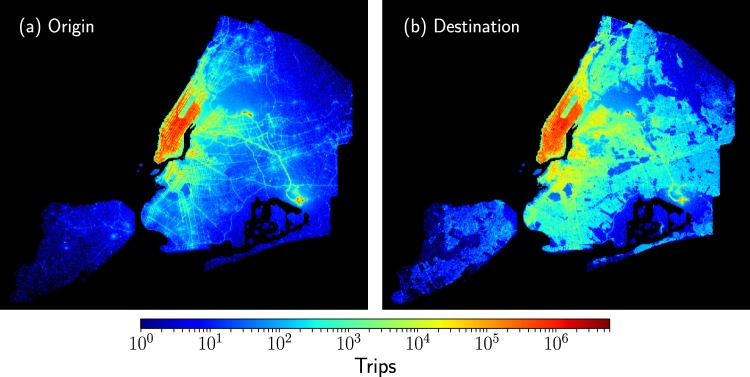
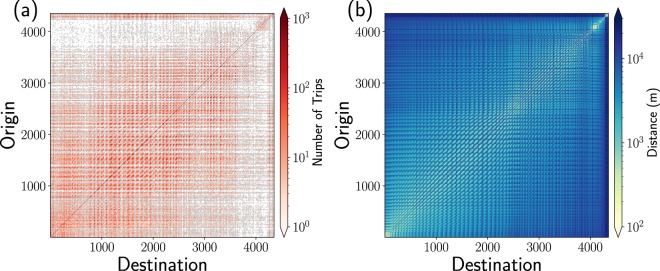
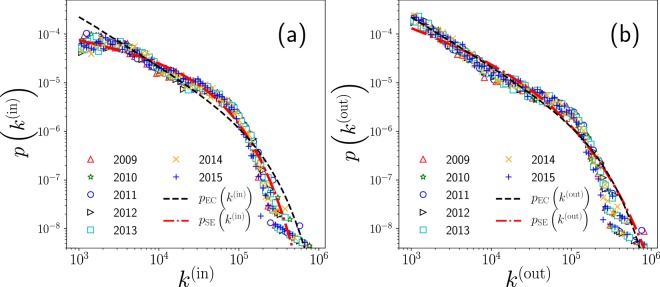
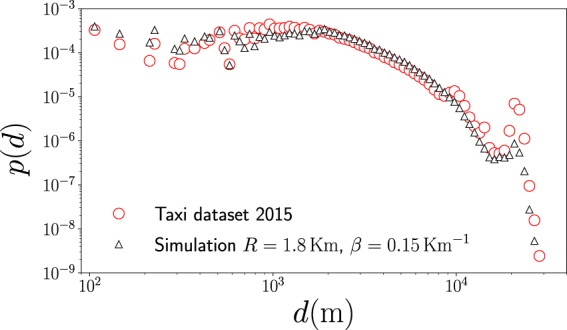
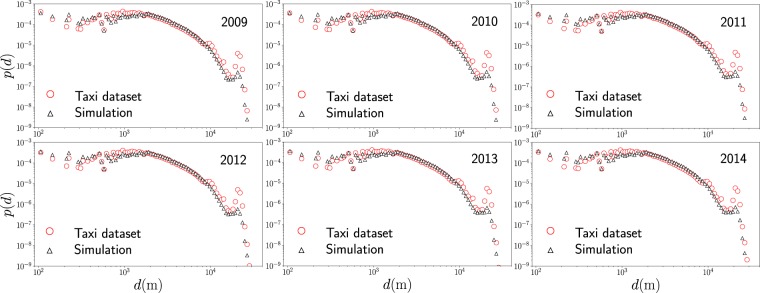
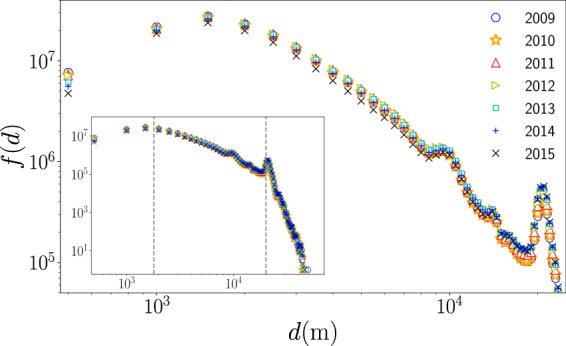
We analyze the massive data set of more than one billion taxi trips in New York City, from January 2009 to December 2015. With these records of seven years, we generate an origin-destination matrix that has information of a vast number of trips. The mobility and flow of taxis can be described as a directed weighted network that connects different zones of high demand for taxis. This network has in and out degrees that follow a stretched exponential and a power law with an exponential cutoff distributions, respectively. Using the origin-destination matrix, we obtain a rank, called "OD rank", analogous to the page rank of Google, that gives the more relevant places in New York City in terms of taxi trips. We introduced a model that captures the local and global dynamics that agrees with the data. Considering the taxi trips as a proxy of human mobility in cities, it might be possible that the long-range mobility found for New York City would be a general feature in other large cities around the world.


Conflict of interest statement

The authors declare no competing interests.

Figures

Figure 1
Figure 1
Schematic illustration of mobility as a spatially embedded directed weighted network. We show N = 10 square zones in the plane representing particular regions where agents can start or end a trip; we simulate T=1000 trips of agents between these locations. (a) Bar representation of the total number arrivals k(in) and the number of departures k(out). (b) Diagram of the system expressed as a directed network, we represent with colors the number of trips Tij between sites i and j. In the study of human mobility, this information is expressed as an origin-destination matrix N × N with elements Tij. In particular, the directions of the links are depicted by arrows and self-loops represent the number of trips with the same origin and destination.
Figure 2
Figure 2
Origins and destinations of taxi trips in New York City. In this analysis, we divide the city in 100 m × 100 m square regions and, for each region, we count the number of taxi trips considering the registers of longitude and latitude of the initial and final locations of each trip. The results are presented in (a) for the origins and (b) for the destinations of taxis. The colorbar indicates the number of trips in each zone; regions outside the boundaries of New York City are presented in black. We analyze T=1148050837 trips from taxi trip records between January 2009 to December 2015. In this representation of the data, using only the information of origins and destinations of taxis, we can see in detail the spatial complexity of New York City and how the street network emerges from the large number of trips analyzed.
Figure 3
Figure 3
Global activity of taxis between zones of high demand for this service in New York City. We analyze the movement of taxis trips made in 2015 and, from the study of a grid with square zones with 100 m × 100 m, similar to the one presented in Fig. 2, we identify zones of high demand of taxis considering that at least 1 000 trips have departed or arrived from a zone. We found with this criterion N = 4 353 high demand zones. In (a) we present the origin-destination matrix for taxi trips moving between zones, the respective colorbar codifies the trip counts. In (b) we present the geographical distance between origin and destination zones; the values of the distance are represented in the colorbar.
Figure 4
Figure 4
Statistical analysis of the number of taxi trips that depart and arrive in high demand zones in New York City. We present the probability density for the values of the degrees: (a) ki(in) and (b) ki(out) defined in Eqs. 1–2 for i = 1, 2, …, N, where N is the number of high activity zones presented in Table 1 for each of the years explored. The results were obtained with normalized counts using logarithmically spaced bins. In both cases, we show with different curves, the power law with an exponential cutoff pEC(k) in Eq. 4 and the stretched exponential fit pSE(k) in Eq. 5.
Figure 5
Figure 5
Transition probabilities between zones of taxi trips in New York City. In (a) we present the results obtained for the year 2015 with origin-destination matrix and the respective distances presented in Fig. 3. In (b) we depict our findings for each year from 2009 to 2014. In all these cases, we analyze the non-null transition probabilities wij(out) and the geographical distance dij between zones i and j. We show hexagonally binned two-dimensional histograms for the logarithm of wij(out) and the logarithm of dij/d0 where d0 = 1 Km is a reference distance. The values codified in the colorbar represent the frequencies denoted as f(dij/d0,wij(out)) of the pairs log10dijd0,log10wij(out) found in each hexagonal bin. Dashed lines are used as a guide and represent the behavior wij(out) constant, for d ≤ 1.8 Km, and wij(out)dij1eβ(dijR) with β = 0.15 Km−1 for d > 1.8 Km.
Figure 6
Figure 6
Statistical analysis of the parameters c and β. We present the probability density ρ of the numerical values c and β found for each pair log10dijd0,log10wij(out) in the interval 0.1 Km ≤ dij ≤ 11 Km for the years 2009, 2010, …, 2015. (a) Values c=log10wij(out) for dij ≤ R = 1.8 Km, (b) values β obtained from Eq. 8 for dij > R. Vertical dashed lines represent the values c = −3.2 and β = 0.15 Km−1.
Figure 7
Figure 7
Numerical analysis of the eigenvalues and OD rank of the transition matrix W(out). We analyze the transition probability matrix for the taxi’s flow in 2015 with origin-destination matrix presented in Fig. 3 with N = 4 353 high demand zones. In (a), we show the eigenvalues λ of W(out) satisfying Eq. 9. In this way, we have 4 353 values represented in the complex plane with dots; in the inset, we depict the results for the eigenvalues in a region close to the origin, where we observe more eigenvalues with a non-null complex part. In (b) we plot the components Pi of the eigenvector P with eigenvalue λ = 1; we represent the numerical values of Pi in terms of the respective degree ki(in) for i = 1, 2, …, N. We also show the values Pi(q) obtained with Eq. 11 for q = 0 and the best fit q* = 0.062.
Figure 8
Figure 8
A schematic illustration of the mobility of taxis between high demand zones. There are two types of trips from a particular location i: First, to a site j inside a circular region of radius R centered in the location i, the probabilities to have a trip to these zones are constant; and, second, a trip to a zone k outside the circle of radius R. In this case, the probability to have this long-range movement decays as a power law with an exponential cutoff proportional to eβ(dikR)dik1, where dik is the geographical distance between i and k.
Figure 9
Figure 9
Statistical analysis of displacements of taxi trips in New York City. We depict the probability density p(d) of the geographical distance d between the departure zone and the final destination of taxis. We present statistics obtained from the analysis of the complete dataset for displacements in 2015 and data generated by using Monte Carlo simulations with transition probabilities wij(model)(R,β) defined by the our model in Eqs. 13 and 14 with R = 1.8 Km and β = 0.15 Km−1. In both cases we use logarithmic spaced bin counts for distances between 102 m ≤ d ≤ 4 × 104 m.
Figure 10
Figure 10
Probability density p(d) of the geographical distance d between the departure zone and final destination of taxis and the results generated through Monte Carlo simulations with transition probabilities between high demand zones wij(model)(R,β) with R = 1.8 Km and β = 0.15 Km−1.
Figure 11
Figure 11
Statistics of displacements d of taxi trips in New York City. We depict the frequency f(d) of the geographical distance d between the origin and destination of taxis. The results are obtained from annual datasets between January 2009 to December 2015. In the inset, we present f(d) as a function of d for the analysis of all the distances with a scale in the frequencies that ranges from 100 to 108. The two vertical dashed lines represent d = 1.8 Km and d = 20 Km. Additional information about the datasets explored is presented in Table 2.
Figure 12
Figure 12
Distances between intersections in Manhattan. (a) Manhattan’s street network, (b) Distance matrices for 4 409 intersections in this network. We depict the results for the length of the intermediary path and the geographical distance between these intersections; the distances are indicated by the colorbar. In (c) we present the hexagonal bin counts for the geographical distances and the respective length of the intermediary path. We depict a dashed line, with unit slope, that represents the case when the two distances are the same. Clearly, since the intermediary path is always greater or equal than the geographic distance, we only have data in the lower triangle of the figure. We show with a colorbar the frequencies for the values found in each bin. The street map, intersections, and intermediary paths were obtained and analyzed with the OSMnx package,.

Similar articles

Cited by

References

    1. Batty, M. The New Science of Cities (MIT Press, Cambridge, MA, 2013).
    1. Barthélemy, M. The Structure and Dynamics of Cities: Urban Data Analysis and Theoretical Modeling (Cambridge University Press, 2016).
    1. Barbosa H, et al. Human mobility: Models and applications. Phys. Rep. 2018;734:1–74. doi: 10.1016/j.physrep.2018.01.001. - DOI
    1. Louail T, et al. From mobile phone data to the spatial structure of cities. Sci. Rep. 2014;4:5276. doi: 10.1038/srep05276. - DOI - PMC - PubMed
    1. Louail T, et al. Uncovering the spatial structure of mobility networks. Nat. Commun. 2015;6:6007. doi: 10.1038/ncomms7007. - DOI - PubMed

Publication types