. 2020 Apr;122(9):1354-1366.
doi: 10.1038/s41416-020-0773-2. Epub 2020 Mar 5.

miR-27a is a master regulator of metabolic reprogramming and chemoresistance in colorectal cancer

Affiliations

miR-27a is a master regulator of metabolic reprogramming and chemoresistance in colorectal cancer

Giovannina Barisciano et al. Br J Cancer. 2020 Apr.

Erratum in

Abstract

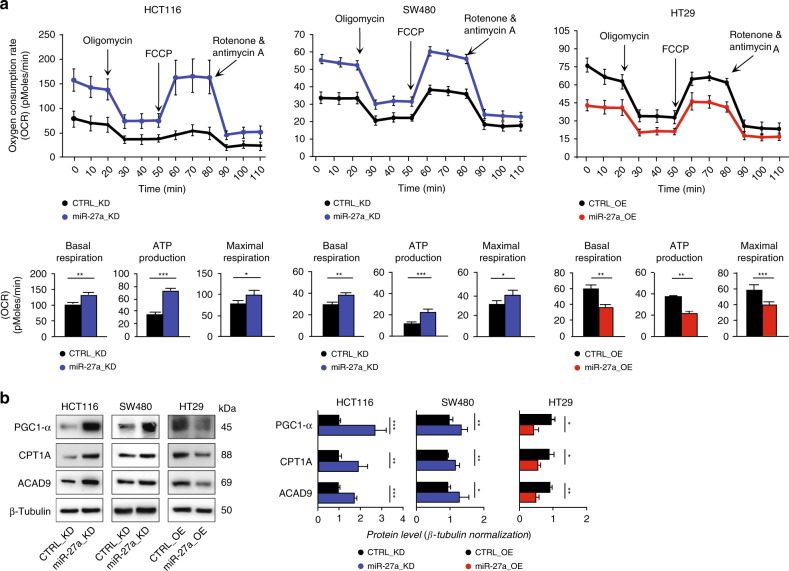
Background: Metabolic reprogramming towards aerobic glycolysis in cancer supports unrestricted cell proliferation, survival and chemoresistance. The molecular bases of these processes are still undefined. Recent reports suggest crucial roles for microRNAs. Here, we provide new evidence of the implication of miR-27a in modulating colorectal cancer (CRC) metabolism and chemoresistance.

Methods: A survey of miR-27a expression profile in TCGA-COAD dataset revealed that miR-27a-overexpressing CRCs are enriched in gene signatures of mitochondrial dysfunction, deregulated oxidative phosphorylation, mTOR activation and reduced chemosensitivity. The same pathways were analysed in cell lines in which we modified miR-27a levels. The response to chemotherapy was investigated in an independent cohort and cell lines.

Results: miR-27a upregulation in vitro associated with impaired oxidative phosphorylation, overall mitochondrial activities and slight influence on glycolysis. miR-27a hampered AMPK, enhanced mTOR signalling and acted in concert with oncogenes and tumour cell metabolic regulators to force an aerobic glycolytic metabolism supporting biomass production, unrestricted growth and chemoresistance. This latter association was confirmed in our cohort of patients and cell lines.

Conclusions: We disclose an unprecedented role for miR-27a as a master regulator of cancer metabolism reprogramming that impinges on CRC response to chemotherapy, underscoring its theragnostic properties.


Conflict of interest statement

The authors declare no competing interests.

Figures

Fig. 1
Fig. 1. In silico analysis of miR-27a expression in the TCGA-COAD dataset.
a Overview of the strategy used to identify dysregulated molecular mechanisms in high- or low-miR-27a expressing tumours. On the left, ranked CRC samples based on miR-27a expression; the 75th and 25th percentile rank of expression values were used to categorise high- or low-miR-27a expressing CRCs, respectively. In the middle, GSEA analysis of a total of 3,272 gene-sets (see methods) to select those significantly enriched in high-miR-27a (q value < 0.1; Benjiamini-Hochberg multiple test correction) or low-miR-27a CRCs (q value < 0.1). On the right, leading-edge analysis to identify overlapping core-genes in the various gene-sets found enriched in high/low miR-27a CRCs; genes overlapping in at least five gene-sets were considered. b Ingenuity pathway analysis (IPA) of canonical pathways overrepresented in high-miR-27a CRCs. Overlapping pathways are shown together with significance of overrepresentation (q value; Benjiamini-Hochberg multiple test correction) and number of molecules overlapping in different pathways (numbers close to lines). c Heatmap of median of scores (see methods) in high-miR-27a (N = 71) and low-miR-27a (N = 71) CRCs of metabolic pathways as per the legend, i.e.: Glyc glycolysis; Pyr. Ox. pyruvate oxidation; TCA tricarboxylic acid cycle; PPP pentose phosphate pathway; mTOR sign. mTOR signalling; AMPK sign. AMPK signalling; Gln lysis glutaminolysis; GSH synth. glutathione synthesis. Colour codes in the heatmap indicate: predicted pathway activation (Activ., red), predicted pathway inhibition (Inhib., blue), significance of scores (−Log p value; calculated by the Mann–Whitney U test) difference in high- vs. low-miR-27a CRCs (grey scale). d Scatterplot shows the distribution of log2 transformed TCPA metabolic proteins abundance ratio from high/low miR-27a. The p value is calculated by the Mann–Whitney U test. e Mutational analysis of 30 recurrently mutated genes with available information in TCGA-COAD cohort (224 patients). Columns represent patients and are ordered according to miR-27a expression level (upper coloured bar). Rows represent the mutational profile of each of the 29 genes across patients. The type of mutation for each gene is colour-coded as per the legend (see below the diagram). Tumour stages are indicated in the upper part of the diagram by coloured bars. Asterisks indicate significantly mutated genes upon comparing high- vs low-miR-27a CRCs (LR test).
Fig. 2
Fig. 2. miR-27a affects overall mitochondrial activities.
a Kinetic profile of the Oxygen Consuming Rate (OCR) assay in HCT116 and SW480 miR-27a_KD and HT29 miR-27a_OE cells and their relative CTRL_KD and CTRL_OE cells, respectively. OCR, expressed as picomoles of oxygen/minute, was measured in real time under basal conditions and in response to the indicated compounds: Oligomycin, FCCP, Rotenone and Antimycin A. Data are reported as mean ± SEM of experiments performed in triplicate; the means values were compared by one-way analysis of variance test (ANOVA). Statistical significance was considered when *p ≤ 0.05, **p ≤ 0.01, ***p < 0.001. The histograms show the values of basal respiration, ATP production and maximal respiration as by the calculations of the experimental OCR data obtained from the various pairs of cell lines analysed. b Immunoblot analysis of PGC-1α, CPT1A and ACAD9 in the same cells as in a. β-Tubulin was used for protein loading normalisation. Data are reported as mean ± SEM of experiments performed in triplicate; the means values were compared by one-way analysis of variance test (ANOVA). Statistical significance was considered when *p ≤ 0.05, **p ≤ 0.01, ***p < 0.001.
Fig. 3
Fig. 3. miR-27a controls the destiny of glucose in CRC cells.
a Kinetic profile of extracellular acidification rate (ECAR) in HCT116 and SW480 miR-27a_KD and HT29 miR-27a_OE cells and their relative CTRL_KD and CTRL_OE cells, respectively. ECAR, expressed as mpH/min, was measured in real time, under basal conditions and in response to glucose, oligomycin and 2DG. Data are reported as mean ± SEM of experiments performed in triplicate; the means values were compared by one-way analysis of variance test (ANOVA). Statistical significance was considered when *p ≤ 0.05, **p ≤ 0.01, ***p < 0.001. The histograms show the quantification of ECAR kinetic profile in: (a) basal glycolysis, (b) basal glycolysis post-glucose injection, (c) glycolytic capacity, (d) glycolytic reserve (d = c − b). b “Cell energy phenotype profile”. The drawings illustrate the metabolic potential of the same cells as in a as a measure of cells’ ability to respond to an energy request after a stress via mitochondrial respiration and glycolysis. The baseline phenotype (levels of mitochondrial respiration and glycolysis in basal conditions) is reported on the left of each drawing; the stressed phenotype (relative utilisation of aerobic respiration and glycolysis upon stressed conditions) is on the right. Data are reported as mean ± SEM of experiments performed in triplicate; the means values were compared by one-way analysis of variance test (ANOVA). Statistical significance was considered when ***p < 0.001. c Immunoblot analysis of glycolytic enzymes levels in the same cell lines as in a. β-Tubulin was used for protein loading normalisation. Data are reported as mean ± SEM of experiments performed in triplicate; the means values were compared by one-way analysis of variance test (ANOVA). Statistical significance was considered when *p ≤ 0.05, **p ≤ 0.01, ***p < 0.001.
Fig. 4
Fig. 4. miR-27a finely orchestrates different cell signalling.
Total protein extracts from HCT116 and SW480 miR-27a_KD and HT29 miR-27a_OE cells and their relative CTRL_KD and CTRL_OE were analysed by Western blot for: a AMPK and its phosphorylation level; b mTOR pathway activation; c pAKT/AKT and PTEN; d pERK/ERK; e cMYC. The density value of each band was referred to β-Tubulin, used for protein loading normalisation, and expressed as fold-change relative to control. Data are reported as mean ± SEM of experiments performed in triplicate; the means values were compared by one-way analysis of variance test (ANOVA). Statistical significance was considered when *p ≤ 0.05, **p ≤ 0.01, ***p < 0.001.
Fig. 5
Fig. 5. miR-27a modulates sensitivity to chemotherapeutics in CRC patients and cells in culture.
a The scatter dot plots report miR-27a expression levels referred to the response to therapy in a subset of the TCGA-COAD cohort (n = 126) for which follow-up information was available. The p value was calculated by the Mann–Whitney U test. b The box plots show miR-27a expression levels referred to the response to chemotherapy in our series of CRC bearing-patients (n = 62) stratified in responders (n = 30) vs non-responders (n = 32), while the box plots in c, d show miR-27a expression levels referred to responders and non-responders to 5FU alone or to 5FU + OXA. The p value was calculated by the Mann–Whitney U test. e Kaplan–Meier curve of disease free survival (DFS) in the TCGA COAD cohort: patients with low miR-27a expression (indicated in blue) show a better DFS (p = 0.02) than those with high miR-27a expression (indicated in red). DFS was calculated with the Log-rank test. f Kaplan–Meier curve of disease free survival (DFS) in our cohort: patients with low miR-27a expression (indicated in blue) show a better DFS (p = 0.02) than those with high miR-27a expression (indicated in red). DFS was calculated with the Log-rank test. g, h The graphs illustrate the growth curves of HCT116 and SW480 miR-27a_KD as well as of HT29 miR-27a_OE and relative controls, respectively, exposed to increasing concentrations of 5FU and OXA for 72 h. The doses that inhibit cell growth by 50% are reported as GR50 and represent the mean ± SEM of three independent experiments carried out in triplicates; the p values are calculated by the two-way analysis of variance test (ANOVA).

References

    1. Hanahan D, Weinberg RA. Hallmarks of cancer: the next generation. Cell. 2011;144:646–674. - PubMed
    1. DeBerardinis RJ, Chandel NS. Fundamentals of cancer metabolism. Sci. Adv. 2016;2:e1600200. - PMC - PubMed
    1. Warburg O. On respiratory impairment in cancer cells. Science. 1956;124:269–270. - PubMed
    1. Ippolito L, Morandi A, Giannoni E, Chiarugi P. Lactate: a metabolic driver in the tumour landscape. Trends Biochem. Sci. 2019;44:153–166. - PubMed
    1. Morrot A, da Fonseca LM, Salustiano EJ, Gentile LB, Conde L, Filardy AA, et al. Metabolic symbiosis and immunomodulation: how tumor cell-derived lactate may disturb innate and adaptive immune responses. Front. Oncol. 2018;8:81. - PMC - PubMed

Publication types

MeSH terms