. 2020 Mar;579(7797):80-87.
doi: 10.1038/s41586-020-2035-0. Epub 2020 Mar 4.

Asynchronous carbon sink saturation in African and Amazonian tropical forests

Wannes Hubau #  1   2   3 Simon L Lewis #  4   5 Oliver L Phillips  4 Kofi Affum-Baffoe  6 Hans Beeckman  7 Aida Cuní-Sanchez  5   8 Armandu K Daniels  9 Corneille E N Ewango  10   11   12 Sophie Fauset  13 Jacques M Mukinzi  10   14   15 Douglas Sheil  16 Bonaventure Sonké  17 Martin J P Sullivan  4   18 Terry C H Sunderland  19   20 Hermann Taedoumg  17   21 Sean C Thomas  22 Lee J T White  23   24   25 Katharine A Abernethy  24   25 Stephen Adu-Bredu  26 Christian A Amani  19   27 Timothy R Baker  4 Lindsay F Banin  28 Fidèle Baya  29   30 Serge K Begne  4   17 Amy C Bennett  4 Fabrice Benedet  31   32 Robert Bitariho  33 Yannick E Bocko  34 Pascal Boeckx  35 Patrick Boundja  19   36 Roel J W Brienen  4 Terry Brncic  36 Eric Chezeaux  37 George B Chuyong  38 Connie J Clark  39 Murray Collins  40   41 James A Comiskey  42   43 David A Coomes  44 Greta C Dargie  4 Thales de Haulleville  7 Marie Noel Djuikouo Kamdem  38 Jean-Louis Doucet  45 Adriane Esquivel-Muelbert  4   46 Ted R Feldpausch  47 Alusine Fofanah  48 Ernest G Foli  26 Martin Gilpin  4 Emanuel Gloor  4 Christelle Gonmadje  49 Sylvie Gourlet-Fleury  31   32 Jefferson S Hall  50 Alan C Hamilton  51 David J Harris  52 Terese B Hart  53   54 Mireille B N Hockemba  36 Annette Hladik  55 Suspense A Ifo  56 Kathryn J Jeffery  25 Tommaso Jucker  57 Emmanuel Kasongo Yakusu  7   58   12 Elizabeth Kearsley  7   59 David Kenfack  50   60 Alexander Koch  5   61 Miguel E Leal  62 Aurora Levesley  4 Jeremy A Lindsell  63   64 Janvier Lisingo  65 Gabriela Lopez-Gonzalez  4 Jon C Lovett  4   66 Jean-Remy Makana  65 Yadvinder Malhi  67 Andrew R Marshall  8   68   69 Jim Martin  70 Emanuel H Martin  60   71 Faustin M Mbayu  12 Vincent P Medjibe  39   72   73 Vianet Mihindou  23   73 Edward T A Mitchard  40 Sam Moore  67 Pantaleo K T Munishi  74 Natacha Nssi Bengone  23 Lucas Ojo  75 Fidèle Evouna Ondo  73 Kelvin S-H Peh  76   77 Georgia C Pickavance  4 Axel Dalberg Poulsen  52 John R Poulsen  39 Lan Qie  4   78 Jan Reitsma  79 Francesco Rovero  80   81 Michael D Swaine  82 Joey Talbot  4   83 James Taplin  84 David M Taylor  85 Duncan W Thomas  86 Benjamin Toirambe  7   87 John Tshibamba Mukendi  7   12   88 Darlington Tuagben  9   89 Peter M Umunay  90   91 Geertje M F van der Heijden  92 Hans Verbeeck  59 Jason Vleminckx  93   94 Simon Willcock  95 Hannsjörg Wöll  96 John T Woods  97 Lise Zemagho  17
Affiliations

Asynchronous carbon sink saturation in African and Amazonian tropical forests

Wannes Hubau et al. Nature. 2020 Mar.

Abstract

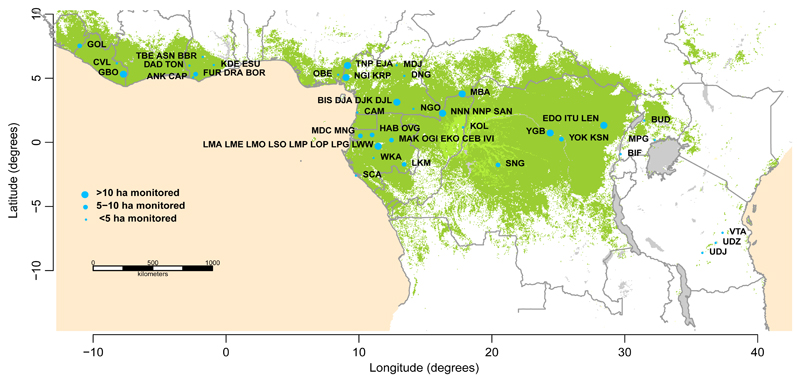
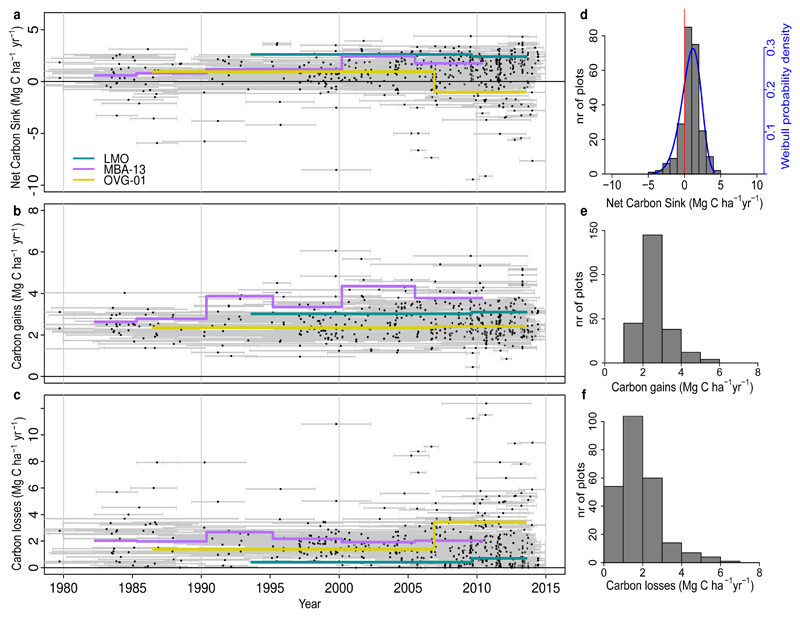
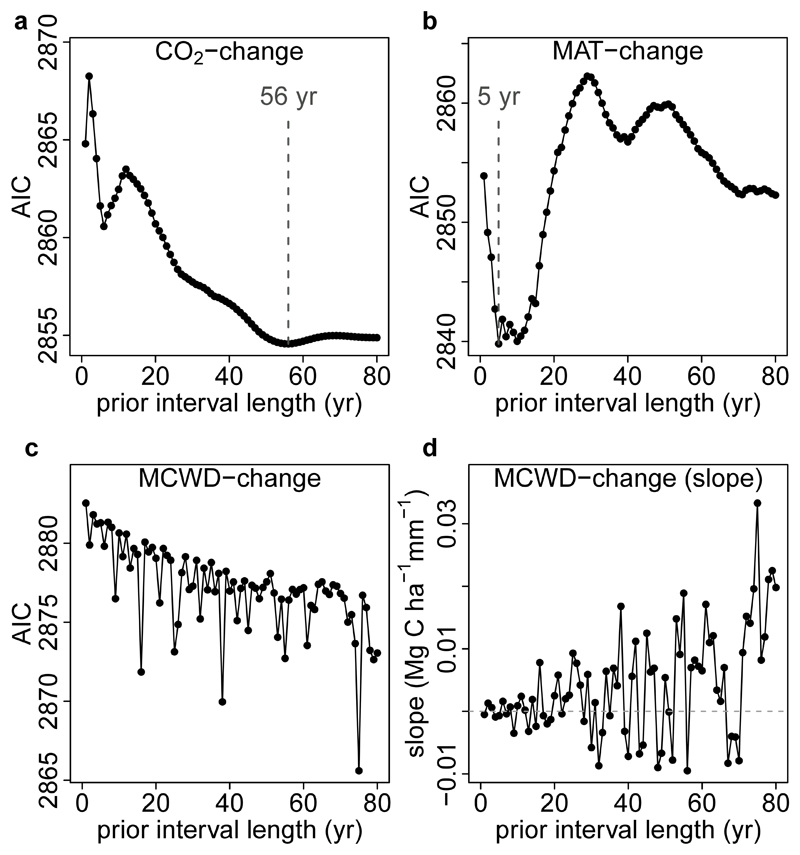
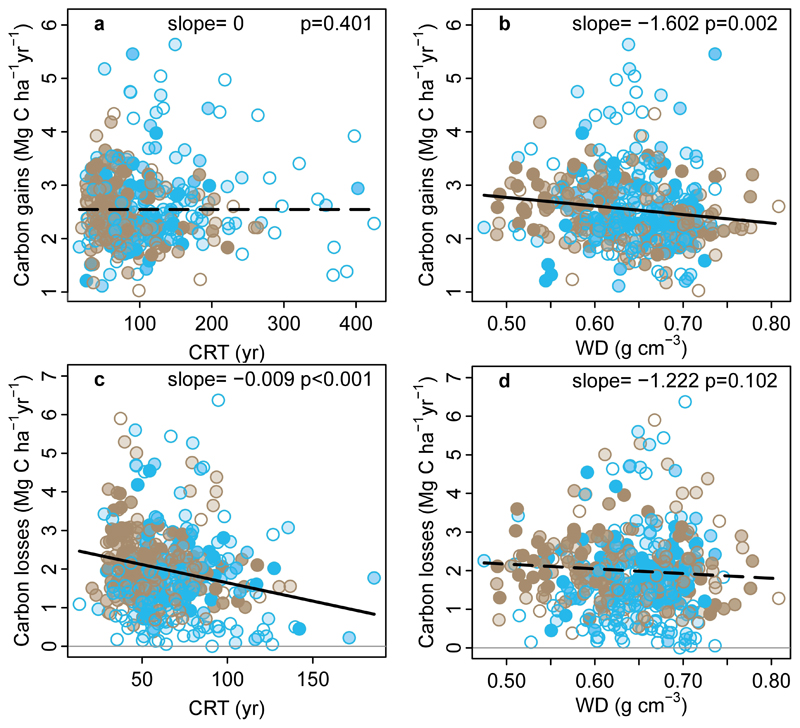
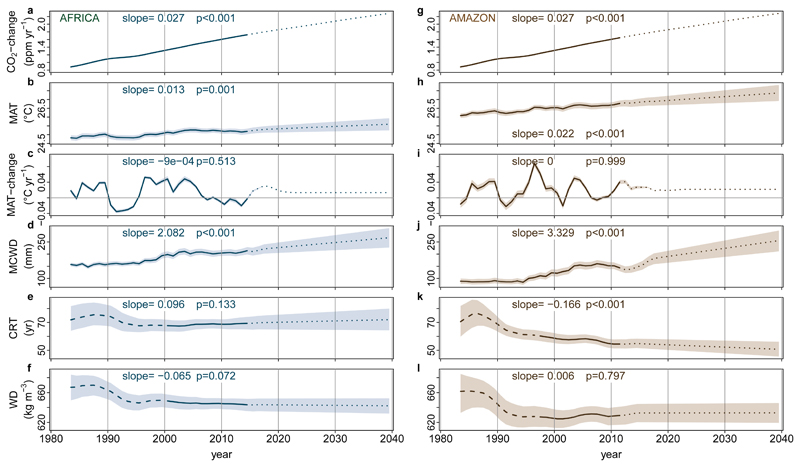
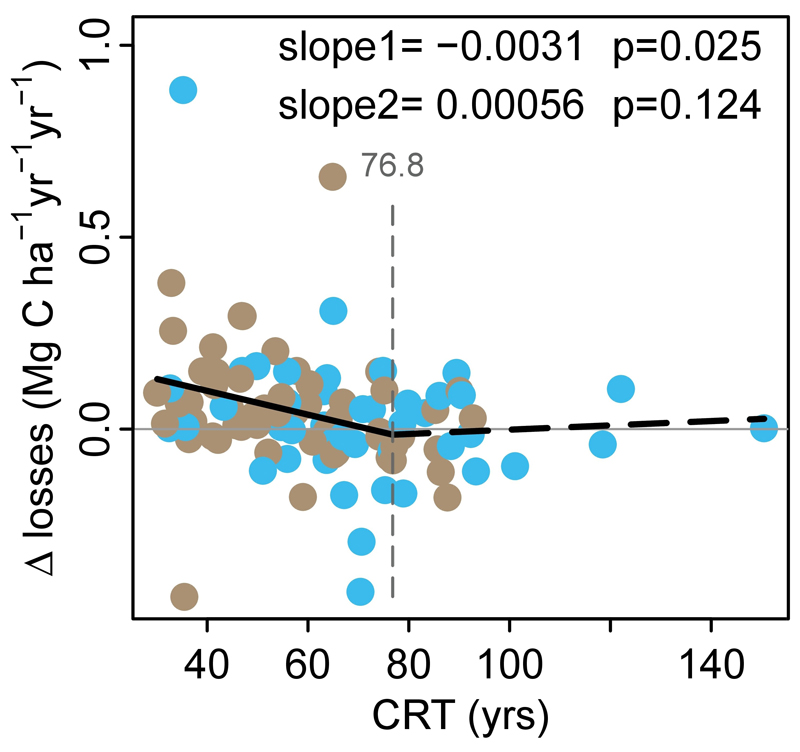
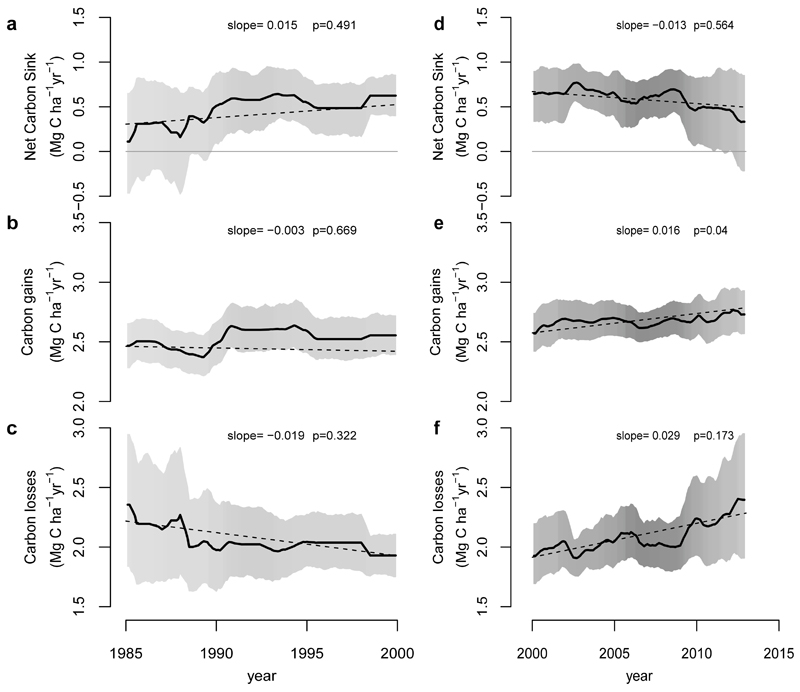
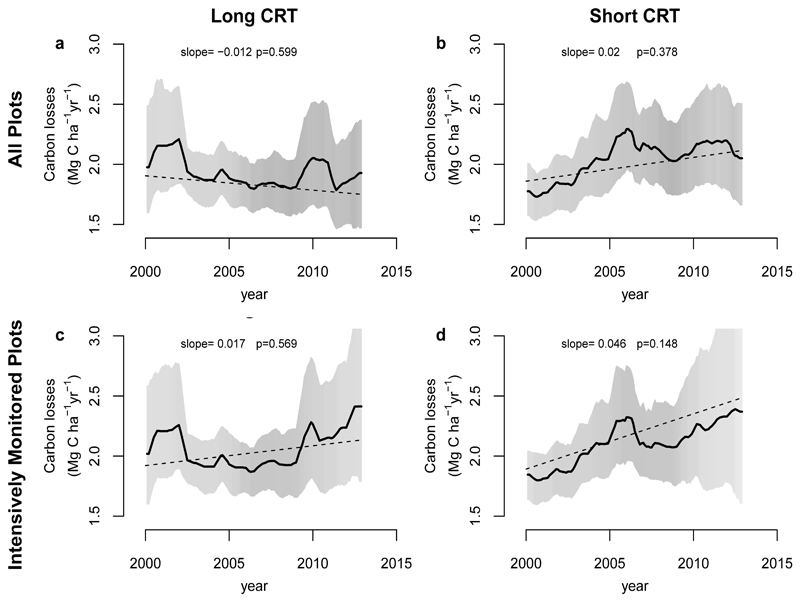
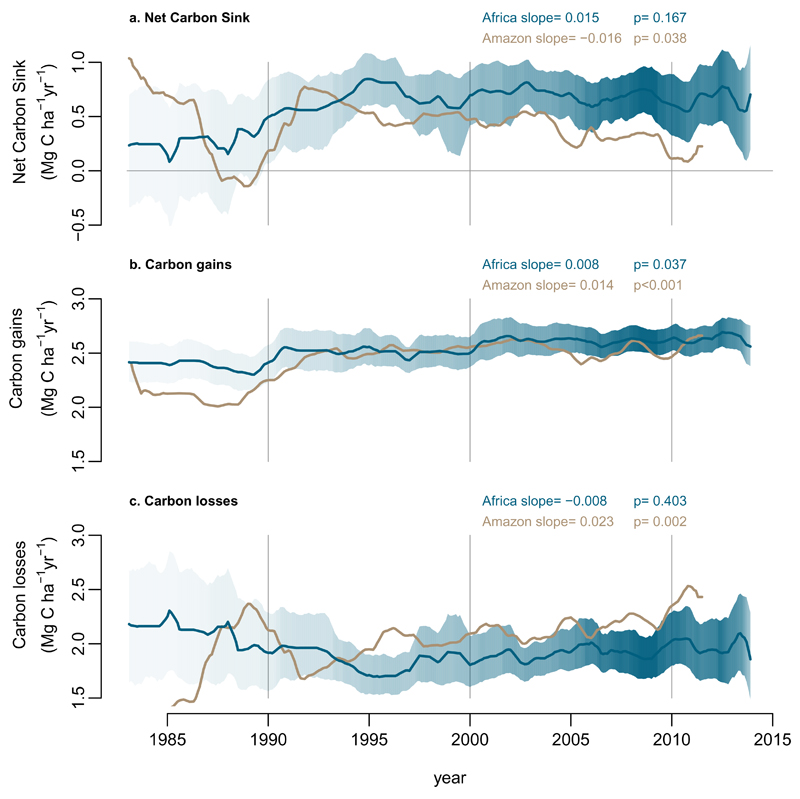
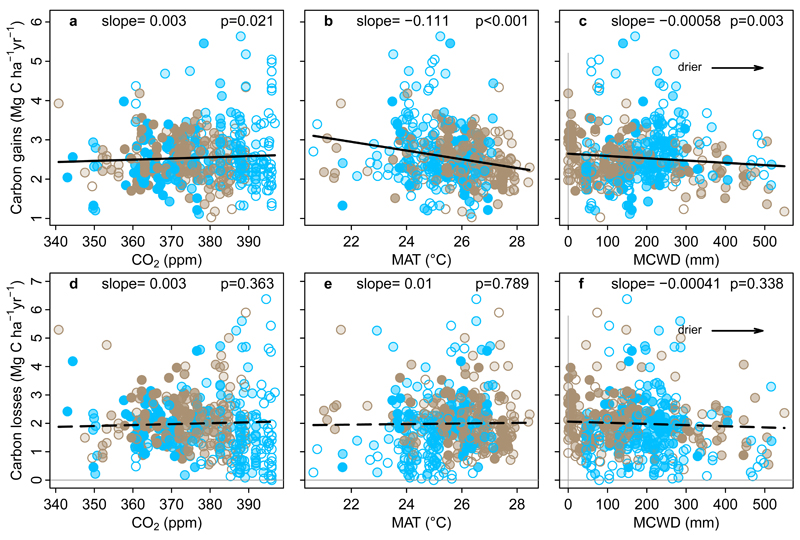
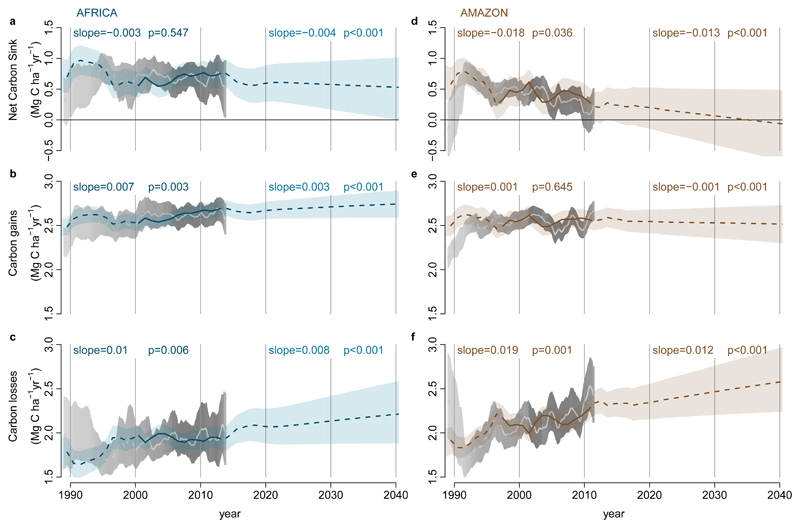
Structurally intact tropical forests sequestered about half of the global terrestrial carbon uptake over the 1990s and early 2000s, removing about 15 per cent of anthropogenic carbon dioxide emissions1-3. Climate-driven vegetation models typically predict that this tropical forest 'carbon sink' will continue for decades4,5. Here we assess trends in the carbon sink using 244 structurally intact African tropical forests spanning 11 countries, compare them with 321 published plots from Amazonia and investigate the underlying drivers of the trends. The carbon sink in live aboveground biomass in intact African tropical forests has been stable for the three decades to 2015, at 0.66 tonnes of carbon per hectare per year (95 per cent confidence interval 0.53-0.79), in contrast to the long-term decline in Amazonian forests6. Therefore the carbon sink responses of Earth's two largest expanses of tropical forest have diverged. The difference is largely driven by carbon losses from tree mortality, with no detectable multi-decadal trend in Africa and a long-term increase in Amazonia. Both continents show increasing tree growth, consistent with the expected net effect of rising atmospheric carbon dioxide and air temperature7-9. Despite the past stability of the African carbon sink, our most intensively monitored plots suggest a post-2010 increase in carbon losses, delayed compared to Amazonia, indicating asynchronous carbon sink saturation on the two continents. A statistical model including carbon dioxide, temperature, drought and forest dynamics accounts for the observed trends and indicates a long-term future decline in the African sink, whereas the Amazonian sink continues to weaken rapidly. Overall, the uptake of carbon into Earth's intact tropical forests peaked in the 1990s. Given that the global terrestrial carbon sink is increasing in size, independent observations indicating greater recent carbon uptake into the Northern Hemisphere landmass10 reinforce our conclusion that the intact tropical forest carbon sink has already peaked. This saturation and ongoing decline of the tropical forest carbon sink has consequences for policies intended to stabilize Earth's climate.


Conflict of interest statement

Author Information

The authors declare no competing financial interests.

Figures

Extended Data Figure 1
Extended Data Figure 1. Map showing the locations of the 244 plots included in this study.
Dark green represents all lowland closed-canopy forests, submontane forests and forest-agriculture mosaics; light green shows swamp forests and mangroves, blue circles represent plot clusters, referred to by three-letter codes (see Supplementary Table 1 for the full list of plots). Clusters <50 km apart are shown as one point for display only, with the circlesize corresponding to sampling effort in terms of hectares monitored. Land cover data is from The Land Cover Map for Africa in the Year 2000 (GLC2000 database),. This map was created using the R statistical platform, version 3.2.1 (ref.), which is under the GNU Public License.
Extended Data Figure 2
Extended Data Figure 2. Long-term above-ground carbon dynamics of 244 African intact tropical forest inventory plots.
Points in the scatterplots indicate the mid-census interval date, with horizontal bars connecting the start and end date for each census interval for net aboveground biomass carbon change (a), carbon gains (from woody production from tree growth and newly recruited stems) (b), and carbon losses (from tree mortality) (c). Examples of time series for three individual plots are shown in purple, yellow and green. Associated histograms show the distribution of the plot-level net aboveground biomass carbon (d) (with a three-parameter Weibull probability density distribution fitted in blue, showing the carbon sink is significantly larger than zero; one-tail t-test: p<0.001), carbon gains (e), and carbon losses (f).
Extended Data Figure 3
Extended Data Figure 3. Akaike’s Information Criterion (AIC) from correlations between the carbon gain in tropical forest inventory plots and changes in either atmospheric CO2, temperature (as MAT) or drought (as MCWD), each calculated over ever-longer prior intervals.
Panels show AIC from linear mixed effects models of carbon gains from 565 plots and corresponding, atmospheric CO2 (CO2-change) (a), Mean Annual Temperature (MAT-change) (b), and Maximum Climatological Water Deficit (MCWD-change) (c). For CO2 the AIC minimum was observed when predicting the carbon gain from the change in CO2 calculated over a 56 year long prior interval length. We use this length of time to calculate our CO2-change parameter. Such a value is expected because forest stands will respond most strongly to CO2 when most individuals have grown under the new rapidly changing condition, which should be at its maximum at a time approximately equivalent to the carbon residence time of a forest stand, (mean of 62 years in this pooled African and Amazonian dataset). For MAT the AIC minimum was 5 years, which we use as the prior interval to calculate our MAT-change parameter. This length is consistent with experiments showing temperature acclimation of leaf- and plant-level photosynthetic and respiration processes over approximately half-decadal timescales,. For MCWD the AIC minimum is not obvious, while the slope of the correlation, shown in panel (d), shows no overall trend and oscillates between positive or negative values, meaning there is no relationship between carbon gains and the change in MCWD over intervals longer than 1 year; thus MCWD-change is not included in our models. This result suggests that once a drought ends, its impact on tree growth fades rapidly, as seen in other studies,. Also in the moist tropics wet-season rainfall is expected to re-charge soil water, hence lagged impacts of droughts are not expected.
Extended Data Figure 4
Extended Data Figure 4. Potential forest dynamics-related drivers of carbon gains and losses in structurally intact African and Amazonian tropical forest inventory plots.
The aboveground carbon gains, from woody production (a-b), and aboveground carbon losses, from tree mortality (c-d), are plotted against the carbon residence time (CRT), and wood density (WD), for African (blue) and Amazonian (brown) inventory plots. Linear mixed effect models were performed with census intervals (n=1566) nested within plots (n=565) to avoid pseudo-replication, using an empirically derived weighting based on interval length and plot area (see methods). Significant regression lines for the complete dataset are shown as a solid line; non-significant regressions as a dashed line. Each dot represents a time-weighted mean plot-level value; transparency of the inner part of the dot represents total monitoring length, with empty circles corresponding to plots monitored for ≤ 5 years and solid circles for plots monitored for >20 years. Carbon loss data are presented untransformed for comparison with carbon gains; linear mixed effects models on transformed data to fit normality assumptions do not change the significance of the results. Note, CRT is calculated differently for the carbon gains and losses models (see methods).
Extended Data Figure 5
Extended Data Figure 5. Trends in predictor variables used to estimate long-term trends in above-ground carbon gains, carbon losses and the resulting net carbon sink in African and Amazonian intact tropical forest plot networks.
Mean annual CO2-change (a), MAT (b), MAT-change (c), MCWD (d), CRT (e), and WD (f) for African plot locations in blue, and corresponding Amazon plots locations in brown (g-l). Solid lines for CO2-change, MAT, MAT-change, MCWD represent obervational data, and solid lines for CRT and WD represent plot means and a time window where >75% of the plots were monitored, long-dashed lines are plot means were <75% of plots were monitored. Dotted lines are future values estimated from linear trends on the 1983-2014 (Africa) or 1983-2011 (Amazon) data (slope and p-value reported in each panel), see methods for details. Upper and lower confidence intervals (shaded area) for the past (Africa: 1983-2014; Amazonia: 1983-2011) are calculated by respectively adding and subtracting 2σ to the mean of each annual value. Upper and lower confidence intervals for the future were estimated by adding and subtracting 2σ from the slope of the regression model.
Extended Data Figure 6
Extended Data Figure 6. The change in carbon losses versus carbon residence time (CRT) of inventory plots in Africa and Amazonia.
For plots with two census intervals, we calculated the change in carbon losses (∆losses, in Mg C ha-1 yr-1 yr-1) as the carbon losses (Mg C ha-1 yr-1) of the second interval minus the carbon losses of the first interval, divided by the difference in mid-interval dates. For plots with more than two intervals, we calculated the change in carbon losses for each pair of subsequent intervals, then calculated the plot-level mean over all pairs, weighted by the time length between mid-interval dates. This analysis includes only plots with at least two census intervals and monitored for ≥20 years (i.e. roughly one-third of the mean CRT of the pooled African and Amazon dataset; n = 116). Breakpoint regression was used to assess the CRT length below which forest carbon losses begin to increase. Plots with CRT <77 years show a recent long-term increase in carbon losses, longer CRT plots do not. Blue points are African plots, brown points are Amazonian plots.
Extended Data Figure 7
Extended Data Figure 7. Trends in African tropical forest net aboveground live biomass carbon, carbon gains and carbon losses, calculated for the last 15 years of the twentieth century (left panels a-c) and the first 15 years of the twenty-first century (right panels d-f).
Plots were selected from the full dataset if their census intervals cover at least 50% of the respective time windows, i.e. they are intensely monitored (n=56 plots for 1985-2000, and n=134 plots for 2000-2015, respectively). Solid lines show mean values, shading corresponds to the 95% CI, as calculated in Figure 1. Dashed lines, slopes and p-values are from linear mixed effects models, as in Figure 1. The data shows a difference compared to Figure 1, notably the sink decline after ~2010 driven by rising carbon losses. This is because in Figure 1 we include all available plots over the 1983-2015 window, which includes clusters of plots monitored only in the 2010s that had low carbon loss and high carbon sink values.
Extended Data Figure 8
Extended Data Figure 8. Twenty-first century trends in aboveground biomass carbon losses from African tropical forest inventory plots with either long (left panels) or short (right panels) carbon residence time.
Upper panels include all plots, i.e. as in Figure 1, but split into a long-CRT group (a), and a short-CRT group (b), each containing half the 244 plots. Lower panels restrict plots to those spanning >50% of the time window, i.e. intensely monitored plots, as in Extended Data Figure 7, but split into a long-CRT group (c), and a short-CRT group (d), each containing half the 134 plots. Solid lines indicate mean values, shading the 95% CI, as for Figure 1. Dashed lines, slopes and p-values are from linear mixed-effects models, as for Figure 1. Carbon losses increase at a higher rate in the short-CRT than the long-CRT group of plots, in both datasets, although this increase is not statistically significant.
Figure 1
Figure 1. Long-term carbon dynamics of structurally intact tropical forests in Africa (blue) and Amazonia (brown).
Trends in net aboveground live biomass carbon sink (a), carbon gains to the system from wood production (b), and carbon losses from the system from tree mortality (c), measured in 244 African inventory plots (blue lines) and contrasting published Amazonian inventory data (brown lines; 321 plots). Shading corresponds to the 95% CI, with less transparent shading indicating a greater number of plots monitored in that year (most transparent: minimum 25 plots monitored). The CI for the Amazonian dataset is omitted for clarity, but can be seen in Figure 3. Slopes and p-values are from linear mixed effects models (see Methods).
Figure 2
Figure 2. Potential environmental drivers of carbon gains and losses in structurally intact old-growth African and Amazonian tropical forests.
Aboveground carbon gains, from woody production (a-c), and aboveground carbon losses, from tree mortality (d-f), presented as time-weighted mean values for each plot, i.e. each census within a plot is weighted by its length, against the corresponding values of atmospheric carbon dioxide concentration (CO2), mean annual air temperature (MAT) and drought (as Maximum Climatological Water Deficit, MCWD), for African (blue) and Amazonian (brown) inventory plots. Each data point therefore represents an inventory plot, for visual clarity, and the level of transparency represents the total monitoring length, with empty circles corresponding to plots monitored for ≤ 5 years and solid circles for plots monitored for >20 years. Solid lines show significant trends, dashed lines non-significant trends calculated using linear mixed effect models with census intervals (n=1566) nested within plots (n=565), using an empirically derived weighting based on interval length and plot area, on the untransformed pooled Africa and Amazon dataset (see Methods). Slopes and p-values are from the same linear mixed effects models. Carbon loss data and models are presented untransformed for comparison with carbon gains, but transformation is needed to fit normality assumptions; linear mixed effects models on transformed carbon loss data does not change the significance of the results, nor does including all three parameters and transformed data in a model (see Extended Data Table 1).
Figure 3
Figure 3. Modelled past and future carbon dynamics of structurally intact tropical forests in Africa and Amazonia.
Predictions of net aboveground live biomass carbon sink (a,d), carbon gains (b,e), and carbon losses (c,f), for African (left panels) and Amazonian (right panels) plot inventory networks, based on CO2-change, Mean Annual Temperature, Mean Annual Temperature-change, drought (as Maximum Climatological Water Deficit), plot wood density, and plot carbon residence time, using observations in Africa until 2014 and Amazonia until 2011.5, and extrapolations of prior trends to 2040. Model predictions are in blue (Africa) and brown (Amazon), with solid lines spanning the window when ≥75% of plots were monitored to show model consistency with the observed trends, and shading showing upper and lower confidence intervals accounting for uncertainties in the model (both fixed and random effects) and uncertainties in the predictor variables. Light grey lines and grey shading are the mean and 95% CI of the observations from the African and Amazonian plot networks.

Comment in

References

    1. Pan Y, et al. A Large and Persistent Carbon Sink in the World’s Forests. Science. 2011;333:988–993. - PubMed
    1. Sitch S, et al. Recent trends and drivers of regional sources and sinks of carbon dioxide. Biogeosciences. 2015;12:653–679. doi: 10.5194/bg-12-653-2015. - DOI
    1. Gaubert B, et al. Global atmospheric CO2 inverse models converging on neutral tropical land exchange, but disagreeing on fossil fuel and atmospheric growth rate. Biogeosciences. 2019;16:117–134. doi: 10.5194/bg-16-117-2019. - DOI - PMC - PubMed
    1. Huntingford C, et al. Simulated resilience of tropical rainforests to CO2-induced climate change. Nature Geoscience. 2013;6:268–273. doi: 10.1038/ngeo1741. - DOI
    1. Mercado LM, et al. Large sensitivity in land carbon storage due to geographical and temporal variation in the thermal response of photosynthetic capacity. New Phytologist. 2018;218:1462–1477. doi: 10.1111/nph.15100. - DOI - PMC - PubMed

Publication types