. 2020 Mar;579(7799):427-432.
doi: 10.1038/s41586-020-2078-2. Epub 2020 Mar 4.

Mitochondrial stress is relayed to the cytosol by an OMA1-DELE1-HRI pathway

Affiliations

Mitochondrial stress is relayed to the cytosol by an OMA1-DELE1-HRI pathway

Xiaoyan Guo et al. Nature. 2020 Mar.

Abstract

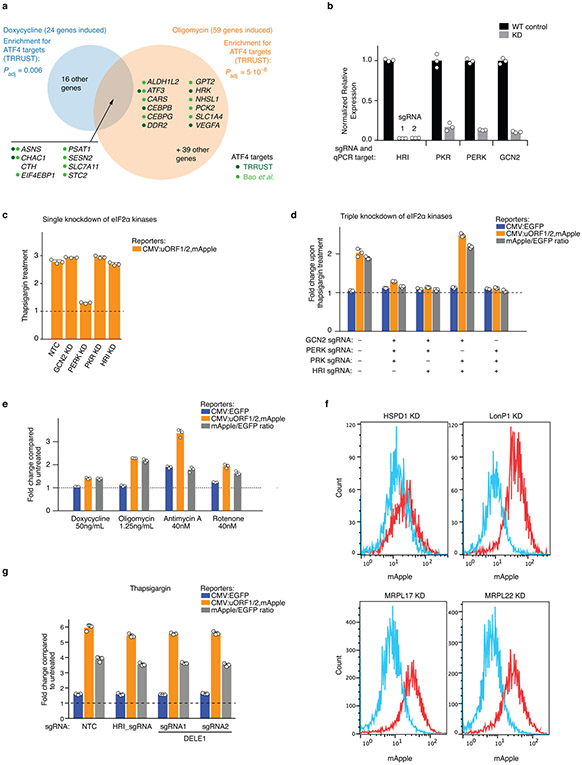
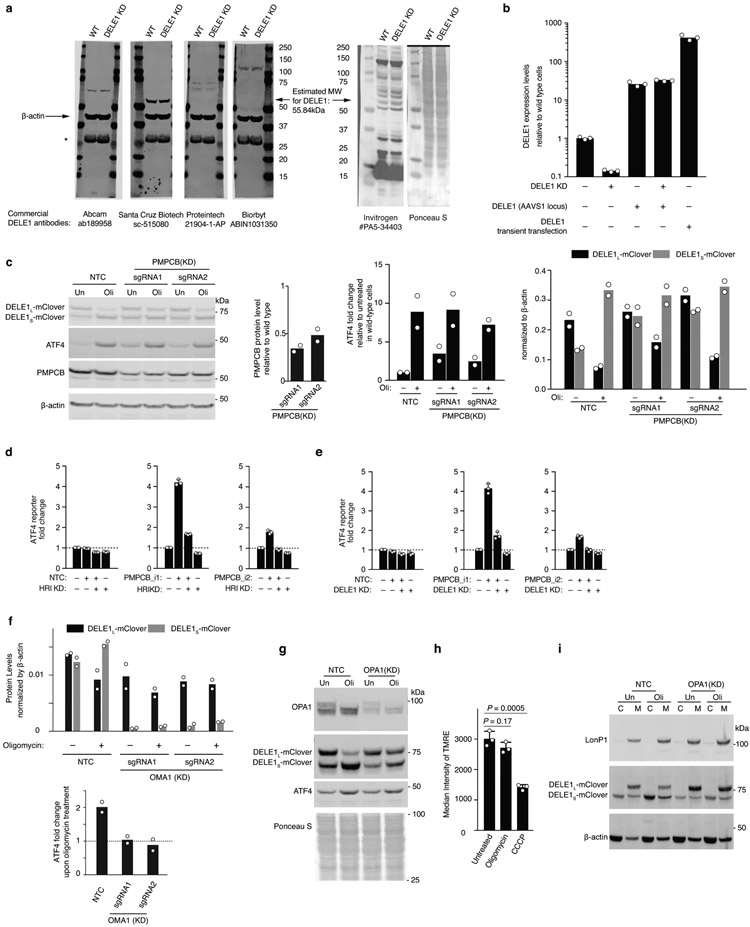
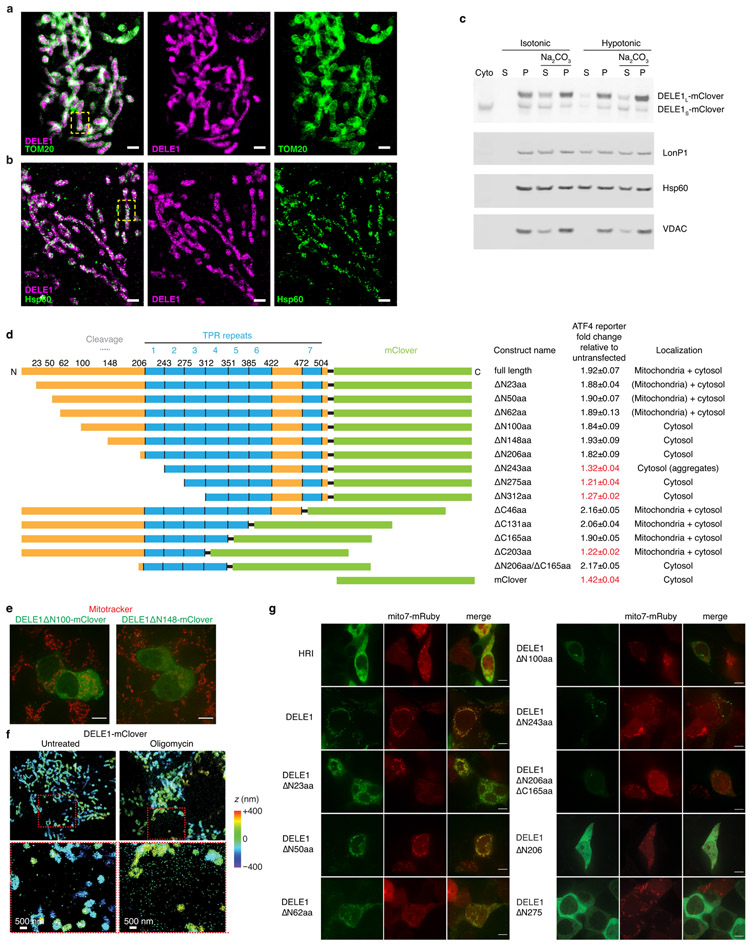
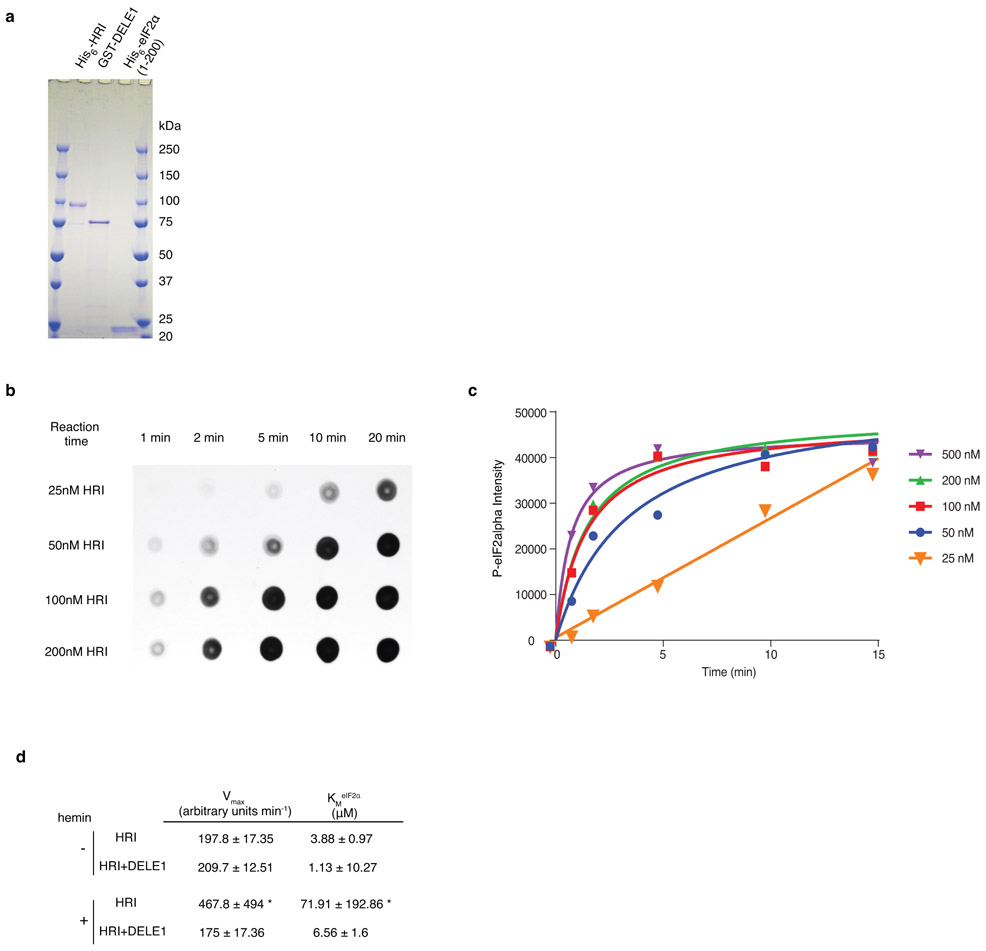
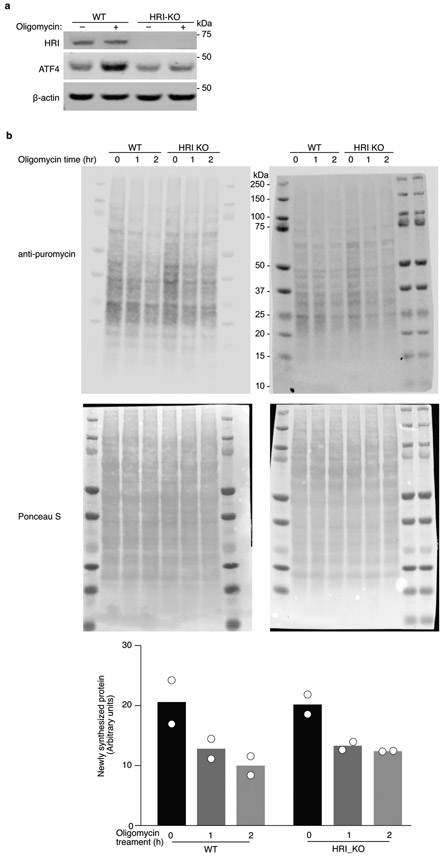
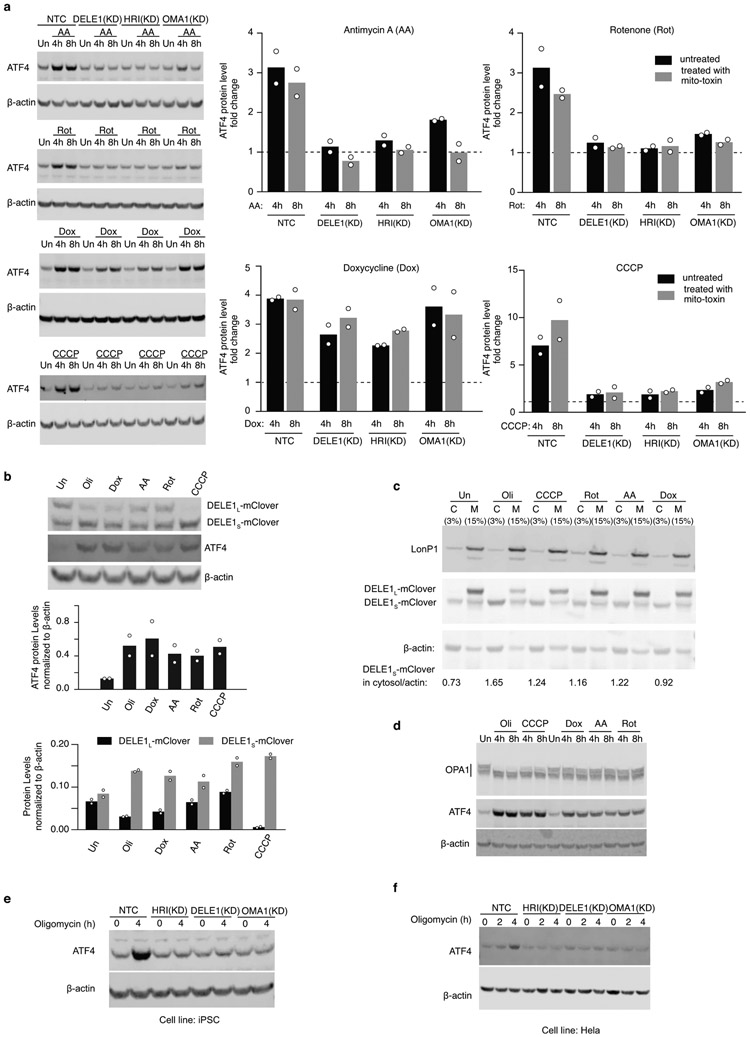
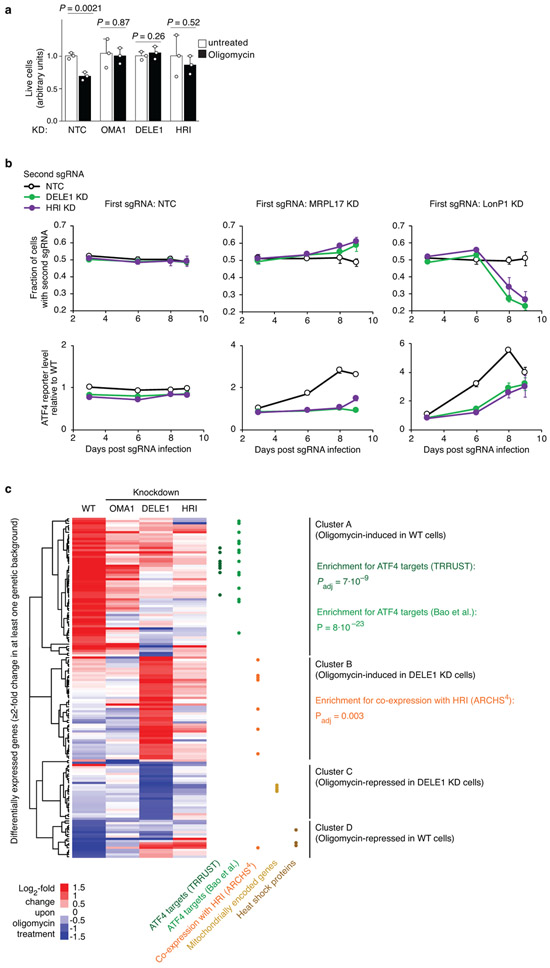
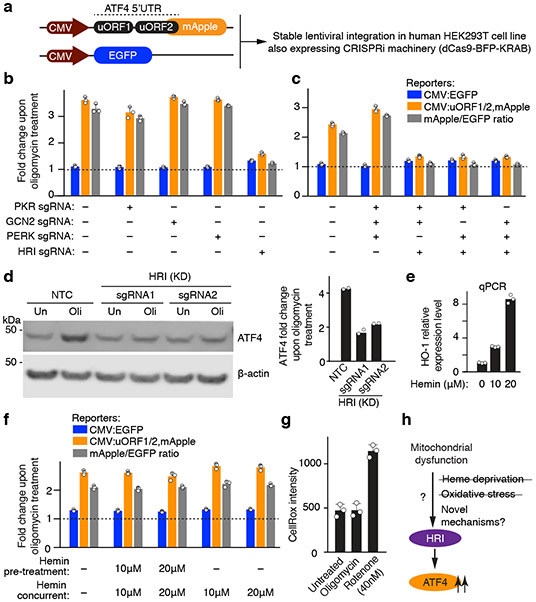
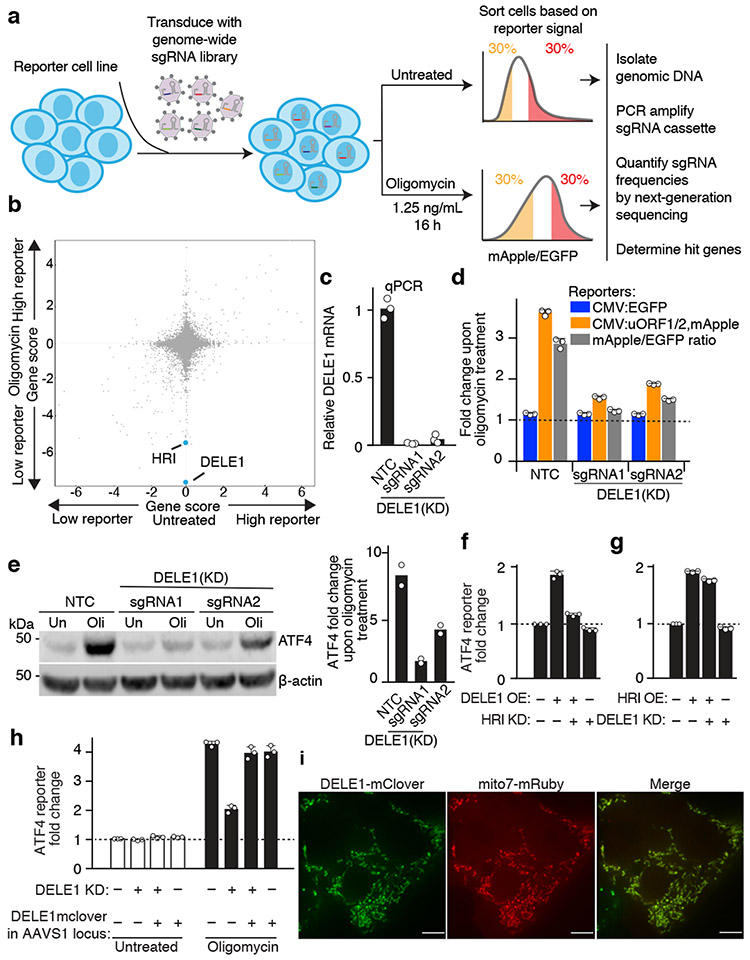
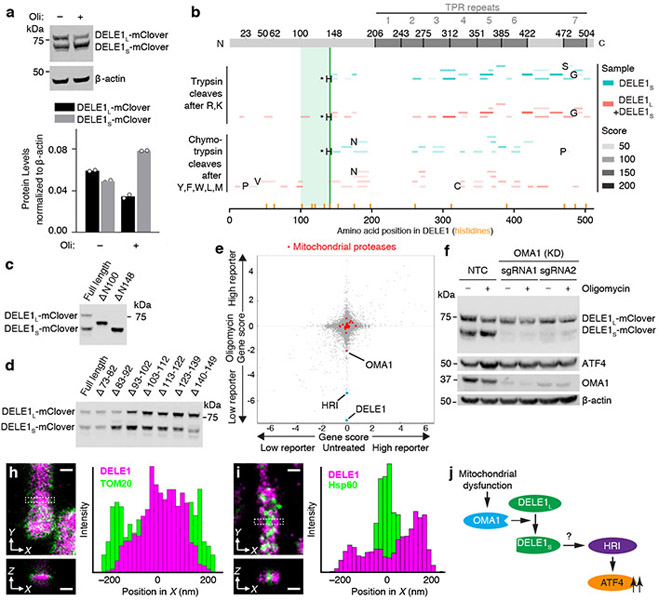
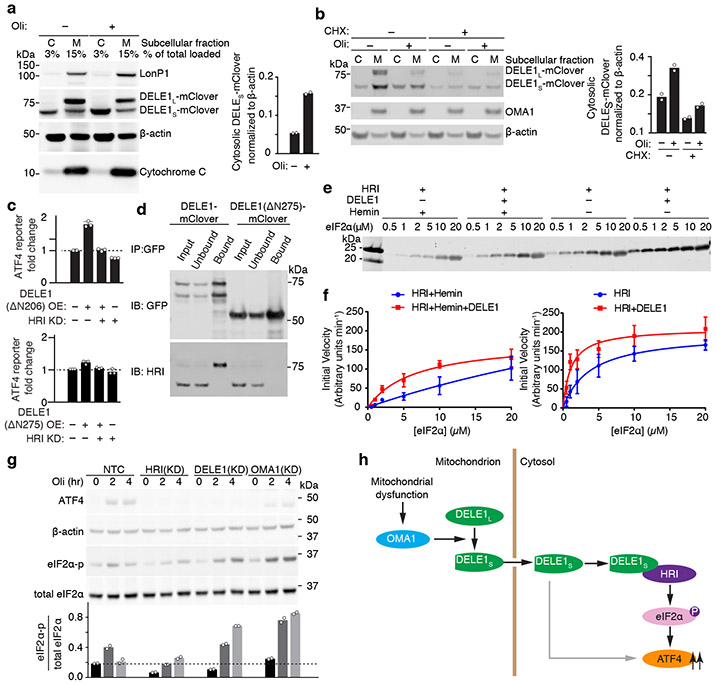
In mammalian cells, mitochondrial dysfunction triggers the integrated stress response, in which the phosphorylation of eukaryotic translation initiation factor 2α (eIF2α) results in the induction of the transcription factor ATF41-3. However, how mitochondrial stress is relayed to ATF4 is unknown. Here we show that HRI is the eIF2α kinase that is necessary and sufficient for this relay. In a genome-wide CRISPR interference screen, we identified factors upstream of HRI: OMA1, a mitochondrial stress-activated protease; and DELE1, a little-characterized protein that we found was associated with the inner mitochondrial membrane. Mitochondrial stress stimulates OMA1-dependent cleavage of DELE1 and leads to the accumulation of DELE1 in the cytosol, where it interacts with HRI and activates the eIF2α kinase activity of HRI. In addition, DELE1 is required for ATF4 translation downstream of eIF2α phosphorylation. Blockade of the OMA1-DELE1-HRI pathway triggers an alternative response in which specific molecular chaperones are induced. The OMA1-DELE1-HRI pathway therefore represents a potential therapeutic target that could enable fine-tuning of the integrated stress response for beneficial outcomes in diseases that involve mitochondrial dysfunction.


Figures

Extended Data Figure 1.
Extended Data Figure 1.. Induction of ATF4 target genes under mitochondrial stress conditions and characterization of the ATF4 translational reporter.
(a) HEK293T cells were treated with 50 μg/mL doxycycline or with 1.25 ng/mL of oligomycin for 16 h, and transcript levels were compared to untreated cells using RNA-Seq for n = 2 (doxycyclin) or n = 3 (oligomycin) independent experiments. Differentially expressed genes and P values were determined as described in the Methods (full datasets in Supplementary Tables 1,2). This Figure analyzes significantly induced genes (Padj < 0.05) with at least a 2-fold increase in treated over untreated conditions. Enrichment analysis for targets of transcription factors annotated in the TRRUST database (statistical analysis described in the Methods) detected ATF4 as the only significant transcription factor (Padj < 0.05) for both treatments. Genes induced by both treatments are listed, as well as genes annotated as ATF4 targets in TRRUST (dark green dots) or Bao et al. (light green dots). (b) Quantification of the knockdown efficiency of sgRNAs targeting the eIF2α kinases by Quantitative RT-PCR (n = 3 technical replicates). For HRI, two independent sgRNAs, 1 and 2, were characterized. (c, d) Validation of the reporter cell line using endoplasmic reticulum stressor, tharpsigargin (Tg). Reporter cells expressing either individual or triple sgRNAs targeting the indicated eIF2α kinases were exposed to 75 nM Tg for 8 h before measuring reporter levels by flow cytometry. The induction of ATF4 reporter by Tg is blocked by PERK knockdown. The reporter fold change was quantified as in Fig. 1b (mean ± s.d., n = 3 culture wells). (e) Pharmacological inhibition of mitochondrial function, using the mitochondrial ribosome inhibitor doxycycline, the electron transport chain inhibitors antimycin A and rotenone, and the ATP synthase inhibitor oligomycin, induces the ATF4 reporter. Reporter cells were exposed to the indicated treatments for 16 h before measuring reporter levels by flow cytometry. The reporter fold change was quantified as in Fig 1b (mean ± s.d., n = 3 culture wells). (f) CRISPRi knockdown (KD) of factors required for mitochondrial protein homeostasis (HSPD1 and LONP1) and mitochondrial ribosomal proteins (MRPL17 and MRPL22) (red) induce the ATF4 reporter compared to WT cells (blue). Similar results obtained in n > 3 independent experiments. (g) DELE1 and HRI are not required to trigger the integrated stress response in response to ER stress. Reporter cells expressing non-targeting control sgRNAs (NTC) or sgRNAs targeting HRI or DELE1 were exposed to 75 nM thapsigargin for 8 h before measuring reporter levels by flow cytometry. The reporter fold change (mean ± s.d., n = 3 culture wells) is the ratio of median fluorescence values for thapsigargin over untreated samples.
Extended Data Figure 2.
Extended Data Figure 2.. Expression levels of DELE1 constructs and investigation of DELE1 cleavage and export mechanisms.
(a) Commercially available antibodies fail to detect DELE1. Lysates from HEK293T cells that were either WT or expressing a sgRNA knocking down DELE1 were probed with the indicated DELE1 antibodies and an antibody against β-actin. None of the bands detected by the DELE1 antibodies decreases in intensity in DELE1 knockdown cells. *Non-specific band. Similar results obtained in n > 2 independent experiments. (b) Quantitative RT-PCR quantification of DELE1 mRNA levels in HEK293T cells knocking down (KD) DELE1 by CRISPRi and/or expressing DELE1-mClover stably from the AAVS1 safe-harbor locus or via transient transfection (n = 3 technical replicates). (c-e) PMPCB knockdown induces the ATF4 translational reporter in the absence of mitochondrial stressors in an HRI-dependent and DELE1-dependent manner. (c) Left, representative immunoblot of ATF4, DELE1-mClover, PMPCB in two PMPCB knockdown cell lines and NTC control cells treated with 1.25 ng/ml oligomycin for 16 hrs where indicated. Right, quantification (mean ± s.d. n = 2 blots). (d,e) HEK293T reporter cells were co-transfected with PMPCB sgRNAs 1 or 2 (with a BFP marker) and HRI (d) or DELE1 (e) sgRNA (with a GFP maker) to generate a cell line with four populations as shown. The intensity of ATF4 reporter was quantified via flow cytometry (mean ± s.d., n = 3 culture wells). (f) Quantification of immunoblot shown in Fig. 3f. n = 2 blots. (g) Immunoblot of OPA1, DELE1-mClover, ATF4 in OPA1 knockdown and NTC control cells treated with 1.25ng/mL oligomycin for 16 hrs (Oli) or untreated (Un). Similar results obtained in n > 2 technical replicates. (h) Measurement of mitochondrial potential by TMRE staining in cells treated with 1.25 ng/mL of oligomycin or 5 μM CCCP for 4 hrs (mean ± s.d., n = 3 culture wells, P values were determined using two-tailed unpaired t test). (i) Subcellular localization of DELE1L and DELE1S in OPA1 knockdown and NTC control cells treated with 1.25ng/mL oligomycin for 16 hrs (Oli) or untreated (Un). Similar results obtained in n > 2 technical replicates. For gel source data, see Supplementary Figure 1.
Extended Data Figure 3.
Extended Data Figure 3.. Characterization of DELE1 submitochondrial localization.
(a-b) Zoom-out views for two-color 3D-STORM super-resolution images of DELE1-mClover vs. TOM20 and Hsp60. Two-color DELE1-mClover (magenta) vs. (a) TOM20 (green) or (b) Hsp60 (green), followed by the two separated color channels. Scale bars: 1 μm. The boxed regions correspond to Fig. 3g, h. Similar results were obtained in n = 3 independent experiments. (c) Biochemical fractionation indicates that DELE1 associates with mitochondrial membranes. Cells stably expressing DELE1-mClover were fractionated into cytosol and mitochondria. Mitochondria were incubated in either isotonic buffer (10 mM Tris HCl, pH 6.7, 0.15 mM MgCl2 0.25mM sucrose,1 mM DTT, protease inhibitor cocktail (Sigma #5892970001)) or H2O (extreme hypotonic condition) for 5 min, followed by centrifugation (10000 xg for 10 min) to separate the supernatant and pellet. The pellet was either dissolved with RIPA buffer or incubated with 0.1M NaCO3 (pH=11.4) for 30 min at 4°C. Supernatant and pellet from NaCO3-treated samples were collected for WB. Unlike soluble matrix protein LonP1 and HSPD1, which can be extracted with H2O incubation, only small proportion of DELE1 is present in the supernatant. NaCO3 can extract the majority of the DELE1S but not DELE1L, which is similar to the pattern of mitochondrial membrane protein VDAC, suggesting that DELE1L is more likely a membrane associated protein. n = 2 independent experiments. For gel source data, see Supplementary Figure 1. (d) The indicated DELE1-mClover constructs were transiently overexpressed in reporter cells, and reporter induction was quantified by flow cytometry (mean ± s.d., n = 3 culture wells). Subcellular localization was evaluated by microscopy in cells also expressing mitochondrial-targeted mRuby. (e) Lack of co-localization of transiently expressed DELE1ΔN100-mClover and DELE1ΔN148-mClover (green) with the mitochondrial stain Mitotracker (red). Scale bar, 7 μm. Similar results obtained in n = 2 culture wells. (f) Increased detection of DELE1-mClover outside the mitochondria upon oligomycin treatment. 3D-STORM super-resolution images of stably expressed DELE1-mClover (colors indicating depth in the z dimension) in untreated cells (left) and cells treated with 1.25 ng/mL oligomycin for 16 h (right). Areas boxed in red in the top panels are shown in higher magnification in the bottom panels. Similar results were obtained in n = 3 independent experiments. (g) Co-localization of transiently expressed HRI-mClover and DELE1-mClover with the mitochondrial-targeted mRuby (Mito7-mRuby). Scale bar, 7 μm. n = 1 culture well.
Extended Data Figure 4.
Extended Data Figure 4.. The protein kinase assay of purified HRI.
(a) Purified recombinant HRI, DELE1 and eIF2α. 800 ng of each recombinant protein was subjected to SDS-PAGE and stained with Coomassie blue (n = 1 gel). (b,c) HRI kinase reactions were performed with 1 μM recombinant yeast eIF2α and various amounts of purified recombinant HRI protein. Reactions were stopped at the time points indicated by removing 5-μl aliquots of the kinase reaction mixture and mixing with equal volume of 2×SDS loading buffer. The SDS samples were then dotted on nitrocellulose blots and subjected to immunoblotting analysis with eIF2αP IgGs. (b) Representative dot blot. (c) Densitometric quantification of dot blots expressed as average value from n = 2 individual experiments. To enable a linear range reaction, 25nM HRI and 5 min incubation time were used for all the subsequence experiments. (d) Enzyme kinetic constants for HRI activity with or without DELE1 in the presence or absence of hemin (mean ± s.e.m., n = 3 individual reactions, fit for data shown in Fig. 4f). Kinetic constants were determined by fitting to the Michaelis-Menten equation using least-squares fit using Prism version 6.07. * The constants calculated from HRI + hemin are not accurate because under the current substrate concentration range, the enzymatic reaction is first order, never reaching Vmax. But higher substrate concentrations cannot be used to obtain Vmax conditions, as purified eIF2α protein will precipitate at higher concentrations.
Extended Data Figure 5.
Extended Data Figure 5.. Measurement of protein synthesis under mitochondrial stress.
(a) Immunoblot of HRI and ATF4 in wild type and HRI knockout (KO) cells. Cells were untreated or treated with 1.25 ng/mL oligomycin for 16 h. Similar results obtained in n = 2 independent experiments. For gel source data, see Supplementary Figure 1. (b) Newly synthesized protein was labeled with puromycin. WT or HRI KO cells were treated with 1.25ng/mL puromycin for 1 or 2 hrs, or left untreated, followed by 10 min puromycin (10ug/mL) incubation. Protein from each sample was quantified by BCA assay (ThermoFisher #23225) and equally loaded. Two immunoblots from separate experiments probed with anti-puromycin (top) and Ponceau S staining (middle). Bottom, quantification of newly synthesized protein (ratio of anti-puromycin signal to Ponceau S signal) for these blots from n = 2 experiments.
Extended Data Figure 6.
Extended Data Figure 6.. Examination of mitochondrial stress response with a broad range of mitochondrial toxins and in non-HEK293T cells.
(a) Immunoblot of ATF4 in wild type, DELE1(KD), HRI (KD) and OMA1(KD) HEK293T cell lines under different mitochondrial stress conditions. Cells were left untreated (Un) or treated with 40nM Antimycin A (AA), 40nM Rotenone (Rot), 50 ug/mL Doxycycline (Dox), or 5 μM CCCP for 2 and 4 hrs. Left, representative blots. Right, ATF4 levels were quantified and normalized to β-actin (mean ± s.d., n = 2 blots). (b) A broad range of mitochondrial toxins stimulates the accumulation of DELE1S. Cells stably expressing DELE1-mClover were untreated or treated with a panel of mitochondrial toxins for 16 h (see Methods for details) and subjected to Western blotting with antibodies detecting DELE1-mClover, ATF4 and actin. Top, representative blot. Middle, bottom, ATF4, DELE1L-mClover and DELE1S-mClover levels were quantified (mean ± s.d., n = 2 blots). (c) Subcellular localization of DELE1L and DELE1S under a broad range of mitochondrial toxins. Biochemical fractionation of cells stably expressing DELE1-mClover that were either treated with different mitochondrial toxins as indicated for 16 h or left untreated. β-actin and LonP1 were probed as markers for cytosol and mitochondria, respectively. Similar results obtained in n = 2 independent experiments. (d) Examination of OPA1 cleavage under a broad range of mitochondrial toxins. Similar results obtained in n = 2 independent experiments. (e) Immunoblot of ATF4 in wild type, DELE1(KD), HRI (KD) and OMA1(KD) in the WTC11 human iPSC line. Cells were left untreated or treated with 1.25 ng/mL oligomycin for 4 hrs. Similar results obtained in n = 2 independent experiments. (f) Immunoblot of ATF4 in wild type, DELE1(KD), HRI (KD) and OMA1(KD) in the human Hela cell line. Cells were left untreated or treated with 1.25 ng/mL oligomycin for 2 and 4hrs. Similar results obtained in n = 2 technical replicates. For gel source data, see Supplementary Figure 1.
Extended Data Figure 7.
Extended Data Figure 7.. The DELE1-HRI pathway can be maladaptive and its blockade induces an alternative program.
(a) OMA1, DELE1, HRI knockdown is protective during oligomycin treatment. HEK293T cells expressing non-targeting control sgRNA (NTC) or an sgRNA knocking down HRI, DELE1 or OMA1 were untreated or treated with 2.5 ng/mL oligomycin for 16 h, and cell numbers were determined by counting (mean ± s.d., n = 3 culture wells, P values were determined by two-tailed unpaired t test). (b) HRI knockdown is protective for cells with depleted mitochondrial ribosomal protein MRPL17, but sensitizes cells with depleted mitochondrial protease LonP1. HEK293T cells were co-infected with lentiviral construct expressing green fluorescent protein and an sgRNA knocking down HRI, and with a lentiviral construct expressing blue fluorescent protein and a non-targeting control sgRNA (NTC) or an sgRNA knocking down MRPL17, MRPL22, or LONP1. Cells were cultured for 9 days and proportions of cells expressing green and blue fluorescent proteins were quantified on days 3, 6, 8 and 9 post infection by flow cytometry (top). Thus, the effect of HRI knockdown on proliferation in different genetic backgrounds could be evaluated in an internally controlled experiment. In parallel, the ATF4 reporter was quantified (bottom). Mean ± s.d., n = 3 culture wells. (c) HEK293T cells that were either infected with a non-targeting control sgRNA or in which OMA1, DELE1 or HRI was knocked down were untreated or treated with 1.25 ng/mL oligomycin for 16 h, and transcriptomes were analyzed by RNA sequencing for n = 3 independent experiments. Differentially expressed genes and P values were determined as described in the Methods (full datasets in Supplementary Tables 2,5-7). The heatmap only includes genes expression of which changed significantly upon oligomycin treatment (Padj < 0.05) by at least two-fold in at least one genetic background. Hierarchical clustering reveals four major gene clusters. Gene groups are indicated by dots in different colors: ATF4 targets annotated by the TRRUST database (dark green, Padj value calculated by Enrichr) or Bao et al. (light green, P value calculated by Fisher’s exact test), genes co-expressed with HRI in the ARCHS database (orange dots, Padj value calculated by Enrichr), mitochondrially encoded genes (golden dots), heat-shock proteins (brown dots).
Figure 1.
Figure 1.. The eIF2α kinase HRI relays mitochondrial stress to ATF4.
(a) ATF4 translational reporter including the upstream open reading frames (uORFs) of the ATF4 5’ untranslated region (5’UTR) followed by mApple replacing the ATF4 coding sequence. Transcription of the reporter and an EGFP transcriptional control is driven by the CMV promoter. (b,c) Reporter cells expressing either single sgRNAs (b) or triple sgRNAs (c) targeting the indicated eIF2α kinases were exposed to 1.25 ng/mL oligomycin for 16 h before measuring reporter levels by flow cytometry (mean ± s.d., n = 3 culture wells). (d) Immunoblot of endogenous ATF4. Cells expressing a non-targeting control sgRNA (NTC) or sgRNAs targeting HRI were treated with 1.25 ng/mL of oligomycin for 16 h where indicated. Left, representative blot; Right, quantification of n = 2 blots. (e) Expression of the heme-induced gene HO-1 after 24-hour incubation with the indicated concentrations of hemin, measured by qPCR (n = 3 technical replicates). (f) Heme supplementation does not abolish ATF4 induction. Reporter levels in cells were treated with the indicated concentrations of hemin for 24 h before a 16 h treatment with 1.25 ng/mL oligomycin in the presence or absence of hemin (mean ± s.d., n = 3 culture wells). (g) Oligomycin treatment used in this study does not induce reactive oxygen species (ROS). Cells were treated with 1.25 ng/mL oligomycin or 40 nM rotenone for 16 h and ROS levels were quantified by flow cytometry using the CellROX reagent (mean ± s.d., n = 3 culture wells). (h) Model.
Fig. 2
Fig. 2. A CRISPRi screen identifies a requirement for DELE1 in ATF4 induction.
(a) Schematic of screen. (b) Comparison of gene scores (defined in Methods) from the screen in untreated and oligomycin-treated conditions. (c) Knockdown of DELE1 quantified by qPCR (n = 3 technical replicates). (d) Reporter activation in cells expressing a non-targeting control sgRNA (NTC) or DELE1 sgRNAs (mean ± s.d., n = 3 culture wells). (e) Immunoblot of endogenous ATF4. Cells were treated with 1.25 ng/mL of oligomycin for 16 hrs (Oli) or untreated (Un). Left, representative blot; Right, quantification of n = 2 blots. (f) ATF4 reporter activation in cells transiently overexpressing (OE) DELE1-mClover and expressing sgRNA to knockdown (KD) HRI where indicated. (mean ± s.d., n = 3 culture wells). (g) ATF4 reporter activation in cells transiently overexpressing (OE) HRI and expressing sgRNA to knockdown (KD) DELE1 where indicated. (mean ± s.d., n = 3 culture wells). (h) DELE1-mClover expression from the AAVS1 safe-harbor locus is not sufficient to induce the ATF4 reporter in the absence of stress, but complements DELE1 knockdown upon oligomycin treatment (mean ± s.d., n = 3 culture wells). (i) Co-localization of DELE1-mClover with the mitochondrial-targeted mRuby (Mito7-mRuby). Scale bar, 7 μm. Similar results for n = 2 culture wells.
Fig. 3
Fig. 3. A cleaved form of DELE1 accumulates upon mitochondrial stress in an OMA1-dependent manner.
(a) Cells stably expressing DELE1-mClover were treated with 1.25 ng/mL of oligomycin for 16 h. Two DELE1-mClover isoforms (DELE1L and DELE1S) were detected using an anti-GFP antibody. Top, representative blot. Bottom, quantification of n = 2 blots. (b) Tryptic and chymotrypic peptides of total DELE1 (red) or DELE1S (cyan) detected by mass spectrometry mapped to the amino acid sequence of DELE1. DELE1S lacks peptides derived from the N-terminal 141 amino acids; the light green box indicates the putative cleavage region. Peptides resulting from cleavage at residues that are not canonical targets of trypsin or chymotrypsin, respectively, are labeled with the amino acid N-terminal to the cleavage event. Peptides resulting from cleavage after histidine-142 are labeled with asterisks, and this position is marked with a solid green line. Positions of all histidines in the DELE1 sequence are labeled with orange lines. (c,d) Immunoblot from cells transiently expressing full-length DELE1-mClover and truncation constructs lacking the indicated amino acids. Similar results in n = 2 independent experiments. (e) Comparison of gene scores (defined in Methods) from the genome-wide CRISPRi screen in untreated and oligomycin-treated conditions. Highlighted in red are mitochondrial proteases, of which OMA1 knockdown significantly reduces ATF4 activation by oligomycin. (f) Immunoblot of DELE1-mClover, ATF4 and OMA1 in cells expressing non-targeting control sgRNAs (NTC) or OMA1 sgRNAs, which were treated with 1.25 ng/mL of oligomycin for 16 h where indicated. Similar results in n = 2 technical replicates. (g-h) Two-color 3D-STORM super-resolution microscopy. Magenta: stably expressed DELE1-mClover, Green: outer mitochondrial membrane protein TOM20 (g) or mitochondrial matrix protein Hsp60 (h). Virtual cross-sections and spatial intensity distributions are shown for the boxed area. Scale bars: 250 nm. Similar results in n = 3 independent experiments. (i) Model.
Fig. 4
Fig. 4. Cytosolic DELE1 physically interacts with and activates HRI.
(a) Immunoblot of biochemical fractionations of cells stably expressing DELE1-mClover treated with 1.25 ng/mL oligomycin (Oli) for 16 h where indicated. Left, representative immunoblot of the cytosolic (C) and mitochondrial (M) fractions. LonP1 and cytochrome c were probed as mitochondrial markers. Right, quantification of the cytosolic DELE1S-mClover from n = 2 blots. (b) Accumulation of DELE1S is protein-synthesis independent. Biochemical fractionation of cells stably expressing DELE1-mClover treated with 1.25 ng/mL oligomycin (Oli) and 20 μg/mL cycloheximide (CHX) for 4 h where indicated. Left, representative immunoblot of the cytosolic (C) and mitochondrial (M) fractions. OMA1 as probed as mitochondrial marker. Right, quantification of the cytosolic DELE1S-mClover from n = 2 blots. (c) Transient overexpression (OE) of the cytosolically localized DELE1(ΔN206), but not the DELE1(ΔN275) construct induces the ATF4 reporter. Knockdown (KD) of HRI blocks reporter activation (mean ± s.d., n = 3 culture wells). (d) Co-immunoprecipitation of HRI with transiently expressed full-length DELE1-mClover but not with DELE1(ΔN275)-mClover. Similar results in n = 2 independent experiments. (e,f) HRI enzyme kinetics in the presence or absence of DELE1 with or without 5 μM hemin using different concentrations of the substrate eIF2α. (e) Representative immunoblot. (f) Quantification and fitting to the Michaelis-Menten equation (mean ± s.e.m., n = 3 independent experiments). (g) Top, immunoblot of ATF4, phospho-eIF2α, total eIF2α in NTC control, HRI KD-, DELE1 KD- and OMA1 KD-cells treated with 1.25ng/mL oligomycin for 0, 2 and 4 hrs. Bottom, quantification of the phospho-eIF2α to total eIF2α ratio from n = 2 blots. (h) Model.

Comment in

References

Main References:

    1. Bao XR et al. Mitochondrial dysfunction remodels one-carbon metabolism in human cells. eLife 5, doi: 10.7554/eLife.10575 (2016). - DOI - PMC - PubMed
    1. Quiros PM et al. Multi-omics analysis identifies ATF4 as a key regulator of the mitochondrial stress response in mammals. J Cell Biol 216, 2027–2045, doi: 10.1083/jcb.201702058 (2017). - DOI - PMC - PubMed
    1. Viader A et al. Aberrant Schwann cell lipid metabolism linked to mitochondrial deficits leads to axon degeneration and neuropathy. Neuron 77, 886–898, doi: 10.1016/j.neuron.2013.01.012 (2013). - DOI - PMC - PubMed
    1. Mattson MP, Gleichmann M & Cheng A Mitochondria in neuroplasticity and neurological disorders. Neuron 60, 748–766, doi: 10.1016/j.neuron.2008.10.010 (2008). - DOI - PMC - PubMed
    1. Sun N, Youle RJ & Finkel T The Mitochondrial Basis of Aging. Molecular cell 61, 654–666, doi: 10.1016/j.molcel.2016.01.028 (2016). - DOI - PMC - PubMed

Methods References

    1. Sidrauski C et al. Pharmacological dimerization and activation of the exchange factor eIF2B antagonizes the integrated stress response. eLife 4, e07314, doi: 10.7554/eLife.07314 (2015). - DOI - PMC - PubMed
    1. Chen JJ et al. Compromised function of the ESCRT pathway promotes endolysosomal escape of tau seeds and propagation of tau aggregation. The Journal of biological chemistry, doi: 10.1074/jbc.RA119.009432 (2019). - DOI - PMC - PubMed
    1. Tian R et al. CRISPR Interference-Based Platform for Multimodal Genetic Screens in Human iPSC-Derived Neurons. Neuron 104, 239–255, doi: 10.1016/j.neuron.2019.07.014 (2019). - DOI - PMC - PubMed
    1. Adamson B et al. A Multiplexed Single-Cell CRISPR Screening Platform Enables Systematic Dissection of the Unfolded Protein Response. Cell 167, 1867–1882 e1821, doi: 10.1016/j.cell.2016.11.048 (2016). - DOI - PMC - PubMed
    1. Patro R, Duggal G, Love MI, Irizarry RA & Kingsford C Salmon provides fast and bias-aware quantification of transcript expression. Nat Methods 14, 417–419, doi: 10.1038/nmeth.4197 (2017). - DOI - PMC - PubMed

Publication types

MeSH terms