. 2020 Mar;579(7798):260-264.
doi: 10.1038/s41586-020-2066-6. Epub 2020 Mar 4.

Decoy exosomes provide protection against bacterial toxins

Affiliations

Decoy exosomes provide protection against bacterial toxins

Matthew D Keller et al. Nature. 2020 Mar.

Abstract

The production of pore-forming toxins that disrupt the plasma membrane of host cells is a common virulence strategy for bacterial pathogens such as methicillin-resistant Staphylococcus aureus (MRSA)1-3. It is unclear, however, whether host species possess innate immune mechanisms that can neutralize pore-forming toxins during infection. We previously showed that the autophagy protein ATG16L1 is necessary for protection against MRSA strains encoding α-toxin4-a pore-forming toxin that binds the metalloprotease ADAM10 on the surface of a broad range of target cells and tissues2,5,6. Autophagy typically involves the targeting of cytosolic material to the lysosome for degradation. Here we demonstrate that ATG16L1 and other ATG proteins mediate protection against α-toxin through the release of ADAM10 on exosomes-extracellular vesicles of endosomal origin. Bacterial DNA and CpG DNA induce the secretion of ADAM10-bearing exosomes from human cells as well as in mice. Transferred exosomes protect host cells in vitro by serving as scavengers that can bind multiple toxins, and improve the survival of mice infected with MRSA in vivo. These findings indicate that ATG proteins mediate a previously unknown form of defence in response to infection, facilitating the release of exosomes that serve as decoys for bacterially produced toxins.


Figures
Extended Figure 1:
Extended Figure 1:. ADAM10 and EpCAM levels following lysosomal inhibition with ammonium chloride (NH4Cl), chloroquine (CQ), bafilomycin (BAF), or proteasomal inhibition with MG132.
a, Time course flow cytometry analysis of ADAM10 following lysosomal inhibition with ammonium chloride (NH4Cl, 20mM) or chloroquine (CQ, 50μM), n = 3. b-d, Western blot analysis of ADAM10 and SQSTM1 following lysosomal inhibition by NH4Cl, CQ, or bafilomycin (BAF, 10nM). Representative Western blot from four independent experiments (b), quantification of ADAM10 levels (n = 5) (c), and quantification of SQSTM1 levels 24 hours post inhibition (n = 3) (d). e-f, Representative histogram (e) and quantification (f) of cell surface EpCAM in BAF treated A549 cells, n = 3. g, Time course flow cytometry analysis of EpCAM following treatment with NH4Cl or CQ, n = 4. h-i, ADAM10, P4D1, and ACTIN levels following proteasomal inhibition by chemical compound MG132. Flow cytometry time course of cell surface ADAM10 levels following MG132 treatment (h) and representative Western blot from three independent experiments (i), n = 3. Measurements were taken from distinct samples and graphs show mean and standard error of mean (s.e.m.). a, c-d, f-h, One-way ANOVA with Dunnet’s post-test compared to PBS or time 0.
Extended Figure 2:
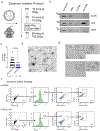
Extended Figure 2:. Exosome isolation and quantification strategies
a, Exosome isolation protocol from in vitro or in vivo sources. Exosomes are isolated using a multi-step centrifugation procedure including a 0.22μM filtration step. b, Western blot of ACTIN, ARF6, and CD9 following each sequential centrifugation step during exosome isolation. c, Electron microscopy (EM) quantification of vesicles 80–150 nm and >150 nm in size, n = 80 images. d, EM negative staining of exosome fractions. Arrows indicate exosomes and protein aggregates. e, Representative EM image of exosome fraction and zoomed inset with arrows indicating the single membranes of exosomes. f, Gating strategy and representative flow cytometry plots from nt shRNA and ATG16L1 KD samples of six independently repeated experiments. Exosomes were stained with antibodies against CD9, CD63, CD81 and ADAM10. Exosomes are concurrently labeled with PKH67, a lipid membrane incorporating dye. Measurements were taken from distinct samples and graphs show mean and standard error of mean (s.e.m.). c, Two-tailed, unpaired t-test with Welch’s correction compared to PBS controls.
Extended Figure 3:
Extended Figure 3:. CQ and BAF elicit ADAM10+ exosome production
a-d. Western blot analysis of cell lysate CD9 (Cell CD9), exosome CD9 (Exo CD9) and exosome ADAM10 (Exo ADAM10) following addition of CQ or BAF. Representative Western blot from six independent experiments (a) and quantification of Cell CD9 (b), Exo CD (c), and Exo ADAM10 (d) after PBS, CQ, or BAF treatment. Measurements were taken from distinct samples and graphs show mean and standard error of mean (s.e.m.). b-d, One-way ANOVA with Dunnet’s post-test compared to PBS controls.
Extended Figure 4:
Extended Figure 4:. Exosomes are produced in response to bacterial exposure.
a, Flow cytometry quantification of exosomes per 100,000 events in murine BMDCs (BMDCs + PBS, n = 3; BMDCs + HKSA, n = 4) and BMDMs (n = 5) following exposure to HKSA. b-h, Quantification of total exosomes in A549 cell culture supernatant by flow cytometry 18 hours following treatment with (b) peptidoglycan (PDG), (c) lipopolysaccharide (LPS), (d) lipoteichoic acid (LTA), (e) Pam3CSK, (f) Pam2CSK, or (g) S. aureus RNA (SA RNA), n = 3. h, Quantification of total exosomes in TLR9 KD A549 cell culture supernatants following treatment with CpG DNA, n = 3. i, Flow cytometry quantification of A549 produced exosomes following exposure to heat killed S. aureus (HKSA) or a strain of S. aureus deficient in the production of α-toxin (HK dHLA). j, Flow cytometry quantification of exosomes isolated from A549 cells treated with PBS (n = 3), S. aureus genomic DNA (SA gDNA; .5ugmL; n = 5) and/or DNase I (n = 2) k, Flow cytometry quantification of exosomes isolated from cells treated with BAF (n = 5), Torin-1 (n = 6), or both (n = 3). l, Representative Western blot of SQSMT1, LC3I/II and ACTIN in cells treated BAF, Torin-1, or both 4 hours post treatment from two independent experiments. p, Flow cytometry quantification of exosomes from A549 cells treated with Mock (PBS, n = 8), CpG DNA (n = 8), or CpG DNA and GW4869 (n = 7). n-o, Plasma exosome quantification of ATG16L1 flow/flox; CD11c-Cre (n), and ATG16L1 flow/flox; LysM-Cre (o) following exposure to either CpG DNA or HKSA, respectively. p, Representative Western blot of ADAM10, ASS1, CD9 and CD81 in exosome fractions submitted to mass spectrometry from three independent experiments. Measurements were taken from distinct samples and graphs show mean and standard error of mean (s.e.m.). a, b-h, Two-tailed, unpaired t-test with Welch’s correction compared to PBS controls. j, k, m-o, One-way ANOVA with Dunnet’s post-test compared to PBS, Mock, CpG DNA or Cre−/+ controls.
Extended Figure 5:
Extended Figure 5:. BAF and CpG DNA decrease acidic organelles.
a-c, Representative flow cytometry histograms from three independent experiments of Lysosensor signal following treatment with BAF, CpG DNA (a), or BAF and CpG DNA (b). c, Quantification of Lysosensor MFI following treatment with PBS (n = 8), BAF (n = 6), CpG DNA (n = 9), and BAF + CpG DNA (n = 6)(c). Measurements were taken from distinct samples and graphs show mean and standard error of mean (s.e.m.). c, One-way ANOVA with Dunnet’s post-test compared to PBS controls.
Extended Figure 6:
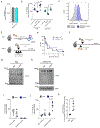
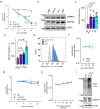
Extended Figure 6:. Exosomes protect from S. aureus toxicity in vitro and in vivo.
a, Flow cytometry exosome quantification from nt shRNA control and ADAM10 KD A549 cells, n = 3. b, Cell death measured by LDH release of A549 cells treated with α-toxin only, pretreated with HKSA or CpG DNA and α-toxin (induced), or pre-exposed to HKSA or CpG DNA followed by PBS wash and then α-toxin treatment (induced; washed), n = 5. c, Representative flow cytometry histograms of CCR5 on CD81+, CD63+, and CD9+ exosomes isolated from murine BMDMs. d, Exogenous exosome transfer protocol. In Step 1, donor mice are pre-exposed to HKSA i.v. to induce exosome production. In Step 2, exosomes from donor mice were then injected intraperitoneally (i.p.) on day −1, day 0, and day +1 following lethal i.v. injection of S. aureus. e, Survival of WT mice infected i.v. with a lethal dose of 5×10⁷ CFU S. aureus (USA300) that were mock-treated (n = 10) or injected i.p. with exosomes from Atg16l1HM mice (n = 8). f, Endogenous exosome protection protocol. Mice are i.v. injected with HKSA to induce exosome production. 4 hours later mice were infected with a lethal dose of S. aureus (2.5–5 ×10⁷). g-h, Western blot analysis of α-toxin oligomerization in total bronchiolar lavage (BAL) or exosome fraction in BAL of mice pre-exposed to HKSA or PBS intranasally (i.n.), representative of four independent experiments. i-j, Quantification of α-toxin monomer (i), heptamer (j) in BAL and exosomes fraction following pre-exposure, n = 4. k, Ratio of α-toxin heptamer in exosome fraction to total α-toxin signal in the BAL, n = 4. Measurements were taken from distinct samples and graphs show mean and standard error of mean (s.e.m.) a, i-k, Two-tailed, unpaired t-test with Welch’s correction. b, One-way ANOVA with Dunnet’s post-test compared to α-toxin only or ‘induced’ controls. e, Log-rank Mantel-Cox test.
Figure 1:
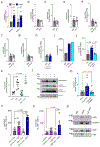
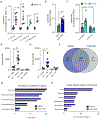
Figure 1:. ATG16L1 inhibits surface ADAM10 independent of lysosomal degradation.
a-b, Representative flow cytometry histogram (a) and quantification of mean fluorescent intensity (MFI) (b) of surface ADAM10 in A459 cells following ATG16L1 knockdown (ATG16L1 KD, n = 5); or cells containing non-targeting control shRNA (nt shRNA, n = 10). c-d, Representative Western blot (c) and quantification (d) of ADAM10 in ATG16L1 KD and control cells, n = 3. e, Quantification of cell death by LDH release assay of nt shRNA, ATG16L1 KD, and ADAM10 KD cells following treatment with purified α-toxin, n = 4. f, Quantification of surface ADAM10 by flow cytometry in nt shRNA (n = 3), ATG5 KD (n = 3), and ULK1 KD (n = 4) A549 cells. g-h, Representative flow cytometry histogram from three independent repeats of surface ADAM10 on A549 cells 24 hours after bafilomycin (BAF; 10nM) (g), and quantification of MFI over time following addition of BAF (n = 3). Measurements were taken from distinct samples and graphs show mean and standard error of the mean (s.e.m.). b, d, f, h, Two tailed, unpaired t-test with Welch’s correction compared to nt shRNA controls. e, Two tailed, unpaired t-test of area under curve compared to nt shRNA controls.
Figure 2:
Figure 2:. ATG proteins regulate the release of ADAM10-containing exosomes.
a-c, Representative ADAM10 and CD9 Western blot from three independently repeated experiments (a), quantification of exosome ADAM10, n = 3 (b), and quantification of CD9 in cell lysates and exosomes from nt shRNA (n = 3) and ATG16L1 KD (n = 6) cells (c). d-e, Representative transmission electron micrographs (d) and quantification (e) of vesicles in the exosome fraction of nt shRNA and ATG16L1 KD culture supernatents. Scale bars, 100μM, n = 80 images. f, Flow cytometric quantification of exosomes from untreated (n = 4), nt shRNA (n = 3), ATG16L1 KD (n = 6), ULK1 KD (n = 6), and ATG7 KD (n = 6) A549 cells. g, Quantification of ADAM10 MFI in untreated, nt shRNA and ATG16L1 KD exosomes from (f), n = 3. h, Exosome quantification (CD9, CD63, CD81, and PKH67+ structures) in blood from C57BL/6J (WT, n = 6) and ATG16L1 hypomorph (HM, n = 8) mice. i, Exosome quantification following PBS (n = 4), CQ (n = 5), or BAF (n = 9) addition. j, Representative Western blot from three independent repeats analyzing ADAM10, SQSTM1, and LC3II levels in nt shRNA and STX17 KD cells. k, ADAM10 MFI of nt shRNA (n = 5) and STX17 KD (n = 6) cells. l, Exosome quantification from nt shRNA and STX17 KD cells, n = 8. Measurements were taken from distinct samples and graphs show mean and s.e.m. b-c, e, h, l, Two tailed, unpaired t-test with Welch’s correction compared to nt shRNA or WT controls. f-g, i, One-way ANOVA with Dunnet’s post-test compared to nt shRNA or PBS. Data represents at least 3 independent experiments.
Figure 3:
Figure 3:. Bacteria induce exosome production.
a-e, Flow cytometric quantification of exosomes in A549 cell culture supernatant 18 hours following exposure to heat killed (HK) S. aureus (n = 7), HK S. pneumoniae (n = 5), HK C. rodentium (n = 4), HK S. Typhimurium (n = 3) (a), following CpG DNA treatment (4uM, n = 5) (b), in nt shRNA (n = 6) and TLR9 shRNA (TLR9 KD, n = 3) targeted A549 cells following HKSA exposure (c), in blood from WT and Atg16l1HM mice following intranasal (i.n.) inoculation with HKSA (1×10⁸ CFU; WT + PBS, n = 7; WT + HKSA, n = 9; HM + PBS, n = 2; HM + HKSA, n = 4) (d), or intravenous (i.v.) live S. aureus (1×10⁷ CFU; WT + PBS, n = 5; WT + HKSA, n = 10; HM + PBS, n = 3; HM + HKSA, n = 6) (e). j, Venn diagram of shared and discreet proteins identified by mass spectrometry in exosomes isolated from the blood of mice exposed to HKSA or CpG DNA i.n. (1×10⁸ CFU; 20ug CpG DNA). k, Gene ontology analysis of subcellular location of proteins identified by mass spectrometry. l, Tissue specific origin of exosome proteins. Measurements were taken from distinct samples and graphs show mean and s.e.m.. a-b, Two-tailed, unpaired t-test with Welch’s correction compared to PBS controls. c-e, One-way ANOVA with Dunnet’s post-test compared to nt shRNA + PBS, or WT + PBS controls.
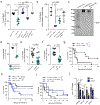
Figure 4:
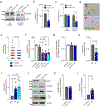
Figure 4:. Exosomes protect against bacterial toxins.
a-b, A549 cell death following treatment with α-toxin or α-toxin together with exosomes isolated from nt shRNA (n = 6), ATG16L1 KD (n = 6), ATG16L1 KD x2 (n = 3), ADAM10 KD (n = 5) cells (a), or FACS-purified exosomes, n = 4 (b). c-d Western blot of α-toxin oligomerization following addition of exosomes isolated from WT or ADAM10 KD A549 cells. Representative Western blot of α-toxin (c), and quantification of α-toxin oligomerization >130 kD (d), n = 3. e, Bone marrow-derived macrophage (BMDM) cell death following treatment with LukED together with exosomes isolated from WT BMDM cultures (LukED only, n = 10; LukED + WT Exo, n = 16). f, Cell death following following exposure to diphtheria toxin (DPT) together with exosomes isolated from of WT A549 cultures, n = 12. g, Survival of WT mice infected i.v. with a lethal dose of S. aureus (USA300; 5 × 10⁷ CFU) mock-treated or injected i.p. with exosomes from WT mice, n = 9 mice/condition. h, Survival of WT (n = 10), and Atg16l1HM (Mock -> HM, n =10; WT exo -> HM, n = 10) mice infected with i.v. 2.5 ×10⁷ CFU S. aureus and receiving exosomes from WT mice. i, Survival of WT mice (n = 10) given a pretreatment of intranasal HKSA followed by a lethal dose of S. aureus (USA300; 5 × 10⁷ CFU; (n = 10) or an isogenic α-toxin deficient strain (Δhla; n = 5). j, S. aureus burden 24 hours post infection with 1×10⁷ USA300 i.v. in kidney, spleen, lung, and blood (per mL) in mice pre-exposed to either PBS or HKSA i.v., n = 6. Measurements were taken from distinct samples and graphs show mean and s.e.m.. a-b, One-way ANOVA with Dunnet’s post-test compared to α-toxin only or control exo. d-f, j, Two-tailed, unpaired t-test with Welch’s correction compared to nt shRNA exo, α-toxin only, or PBS controls. g-i, Log-rank Mantel-Cox test.

Comment in

References

    1. Dal Peraro M & van der Goot FG Pore-forming toxins: ancient, but never really out of fashion. Nat Rev Microbiol 14, 77–92, doi:10.1038/nrmicro.2015.3 (2016). - DOI - PubMed
    1. Seilie ES & Bubeck Wardenburg J Staphylococcus aureus pore-forming toxins: The interface of pathogen and host complexity. Seminars in cell & developmental biology 72, 101–116, doi:10.1016/j.semcdb.2017.04.003 (2017). - DOI - PMC - PubMed
    1. Spaan AN, van Strijp JAG & Torres VJ Leukocidins: staphylococcal bi-component pore-forming toxins find their receptors. Nature Reviews Microbiology 15, 435, doi:10.1038/nrmicro.2017.27 (2017). - DOI - PMC - PubMed
    1. Maurer K et al. Autophagy mediates tolerance to Staphylococcus aureus alpha-toxin. Cell Host Microbe 17, 429–440, doi:10.1016/j.chom.2015.03.001 (2015). - DOI - PMC - PubMed
    1. Inoshima I et al. A Staphylococcus aureus pore-forming toxin subverts the activity of ADAM10 to cause lethal infection in mice. Nat Med 17, 1310–1314, doi:10.1038/nm.2451 (2011). - DOI - PMC - PubMed

MeSH terms