Comparative Study
. 2020 Mar;579(7799):402-408.
doi: 10.1038/s41586-020-2073-7. Epub 2020 Mar 4.

Olfactory receptor and circuit evolution promote host specialization

Affiliations
Comparative Study

Olfactory receptor and circuit evolution promote host specialization

Thomas O Auer et al. Nature. 2020 Mar.

Abstract

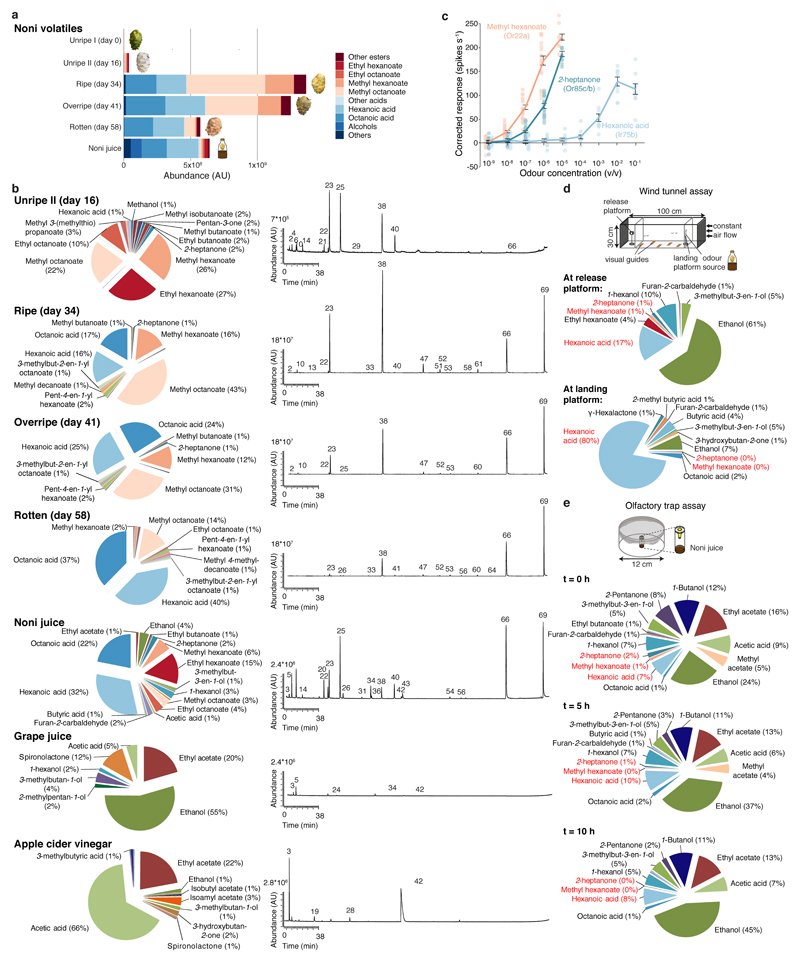
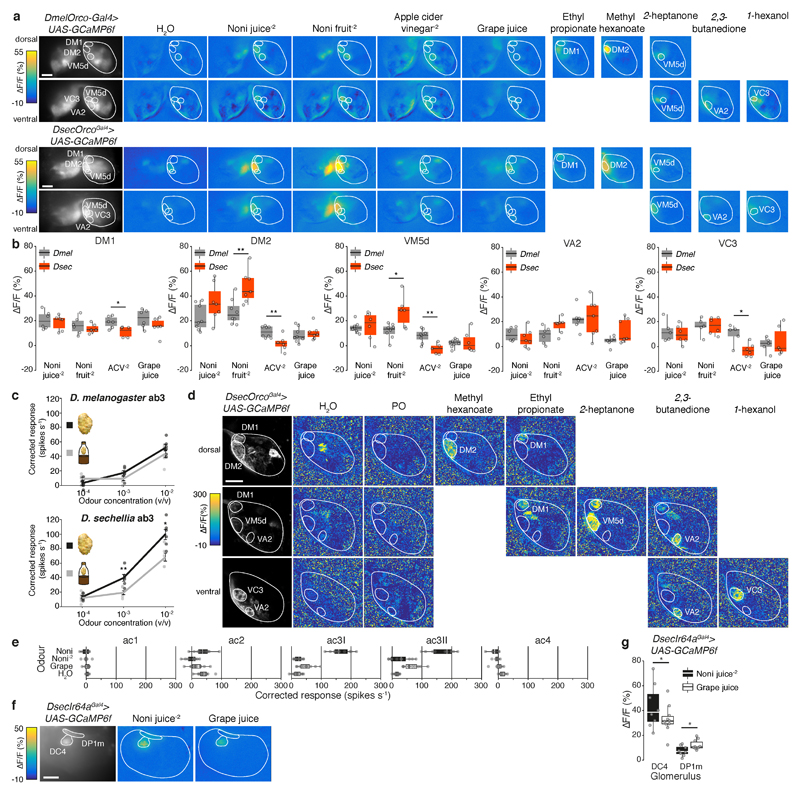
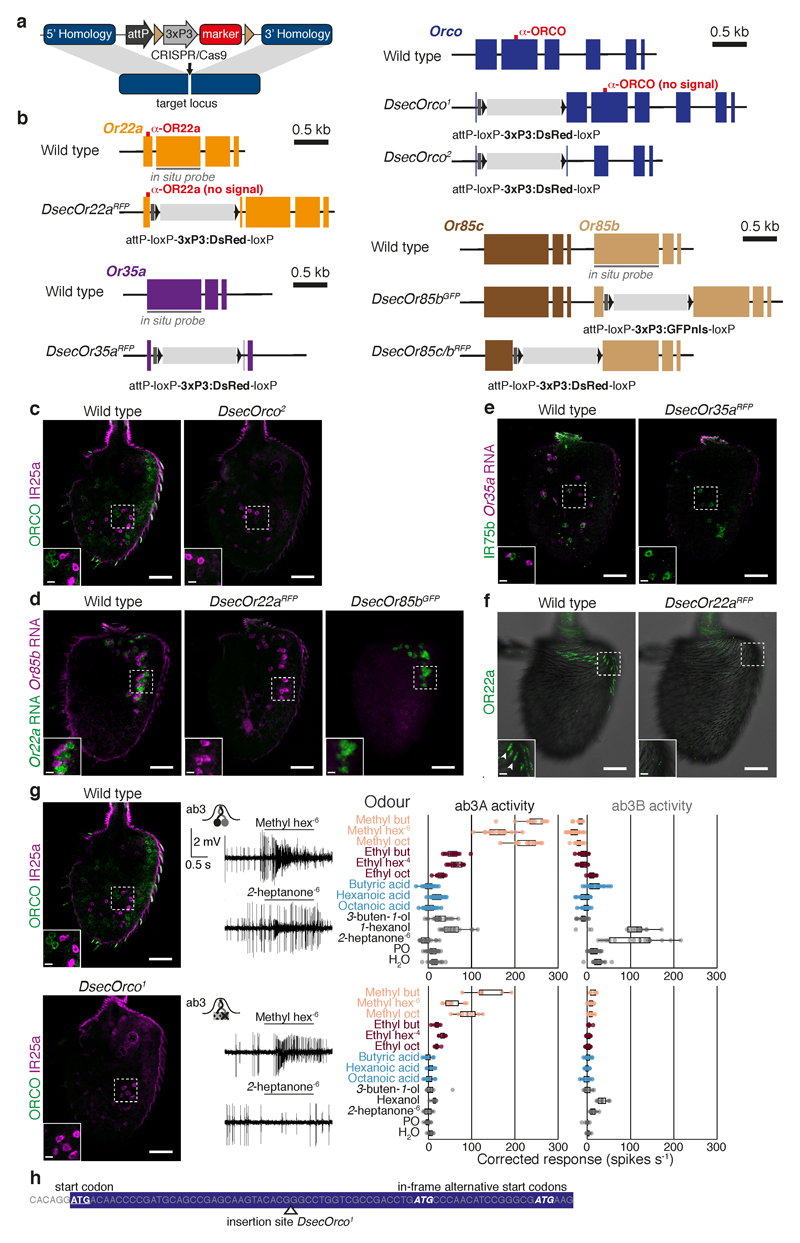
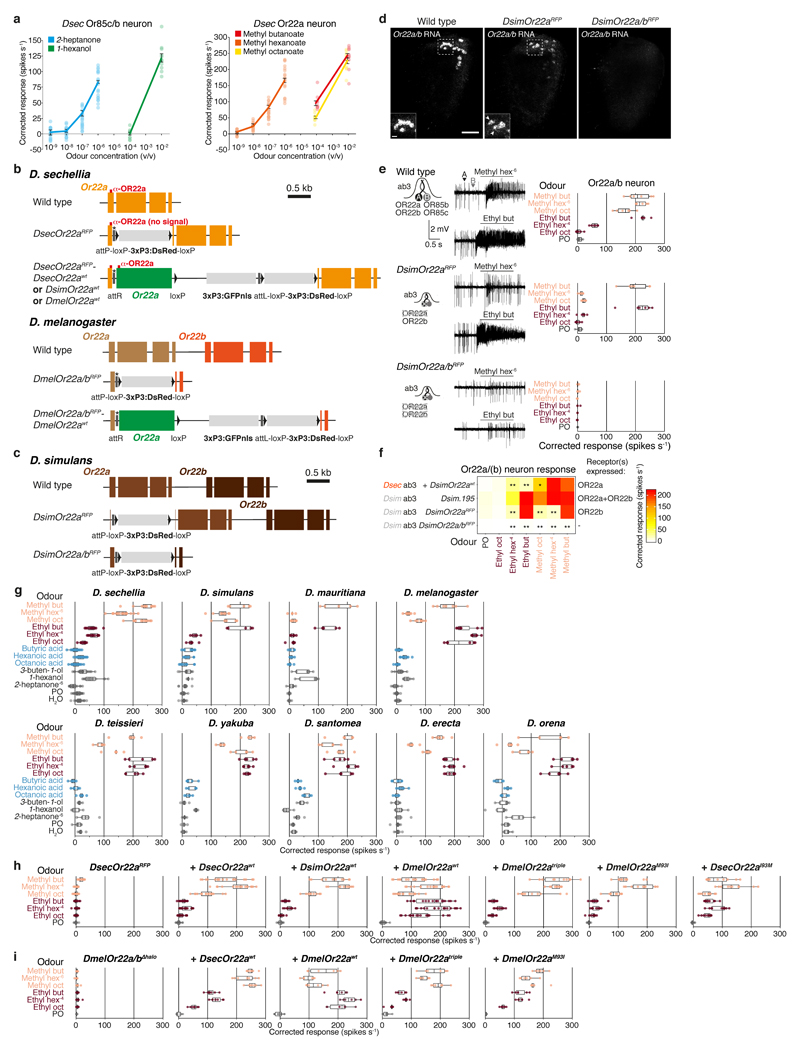
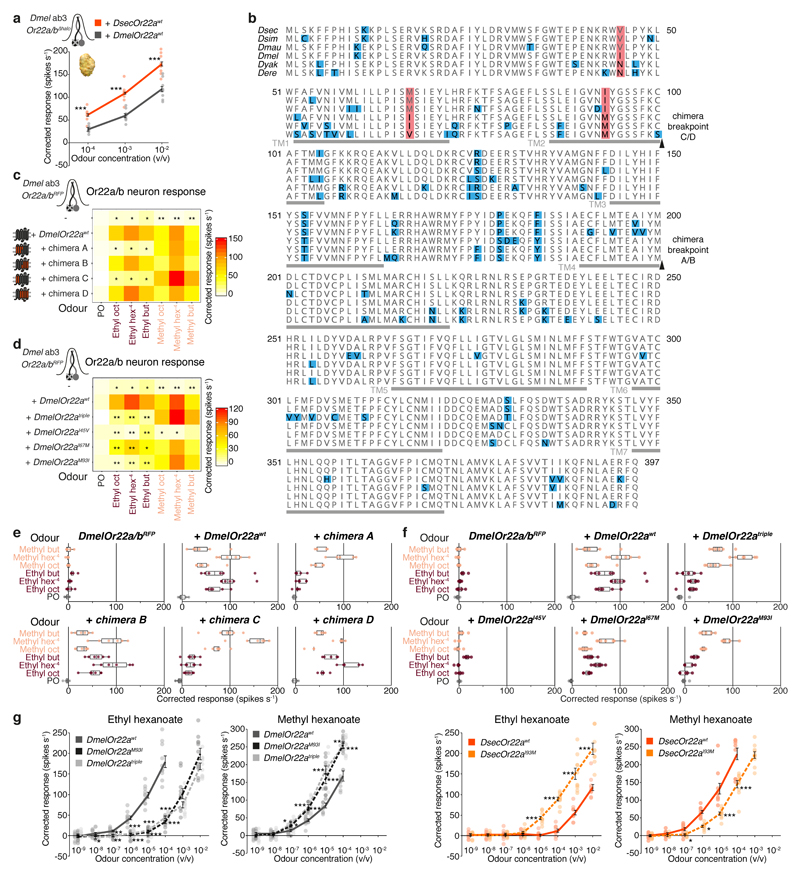
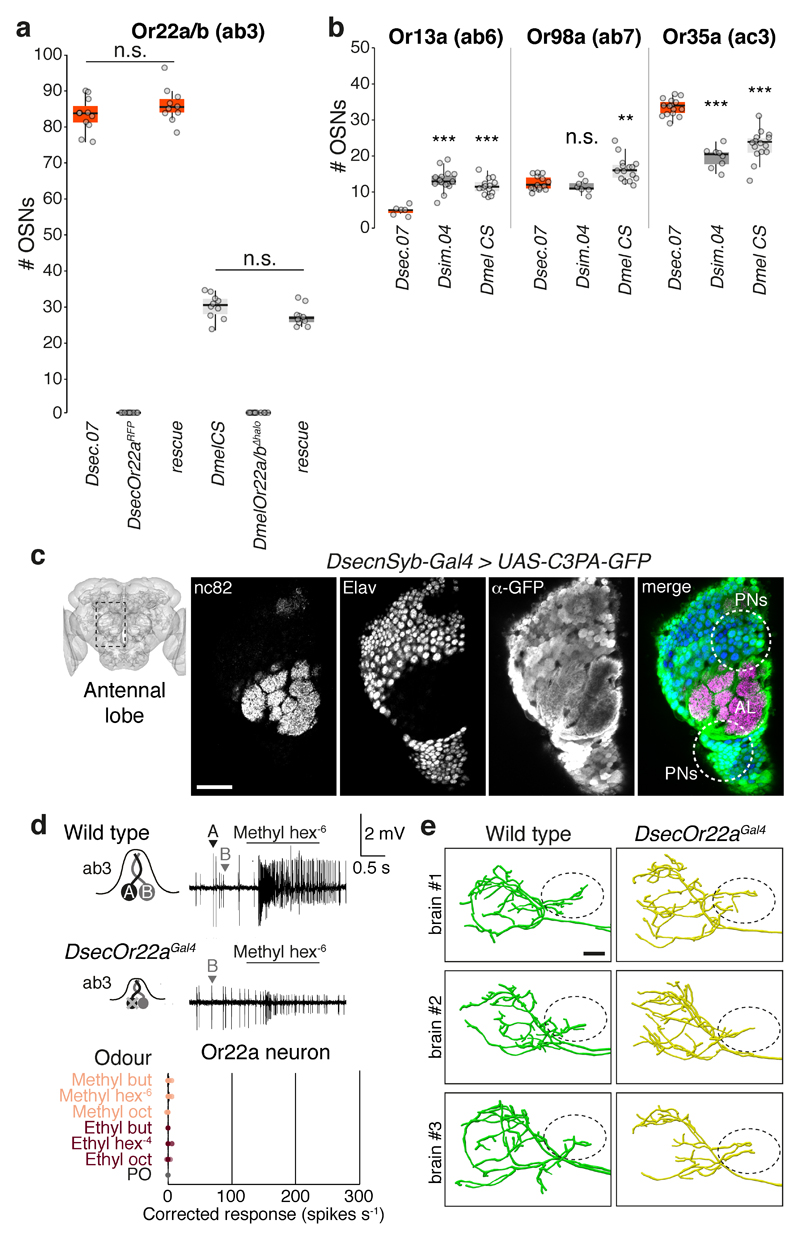
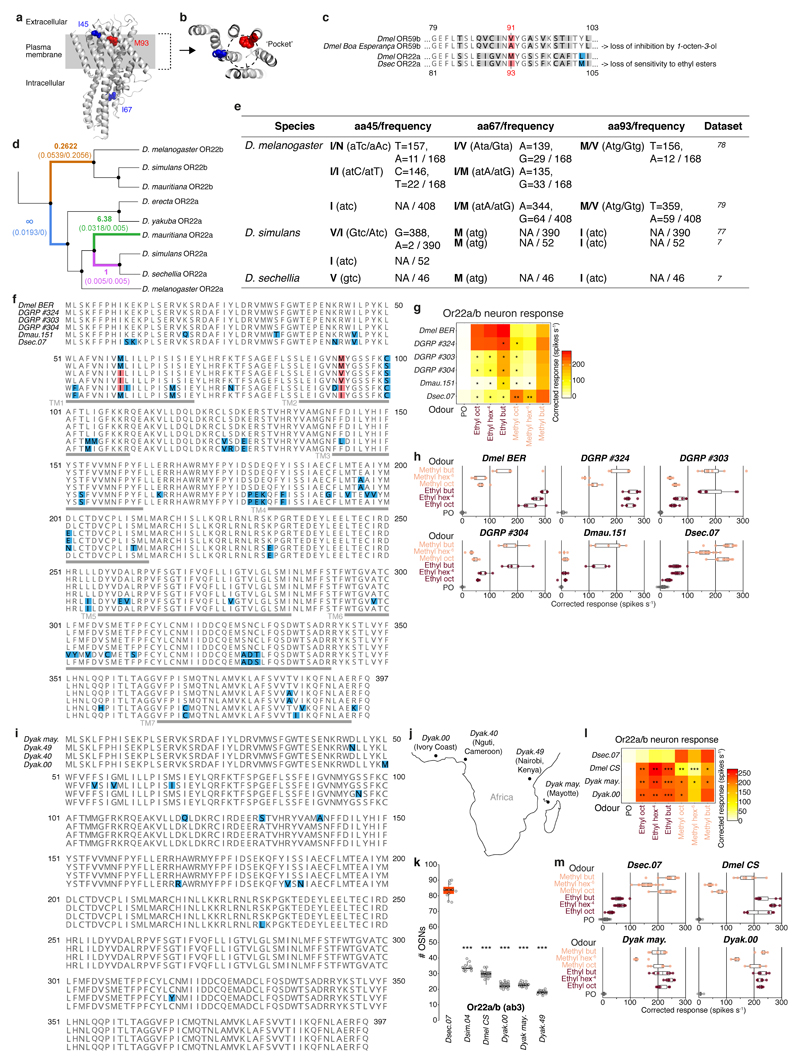
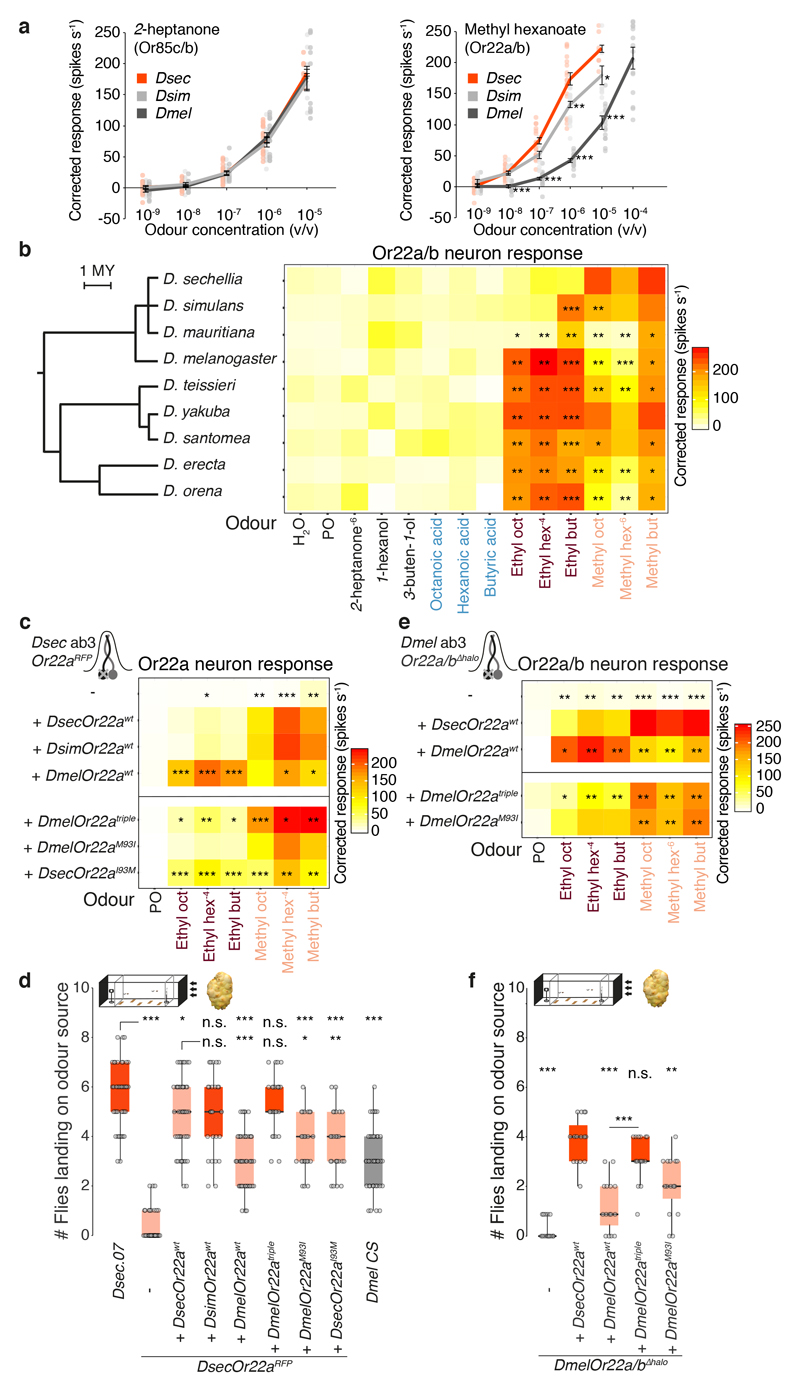
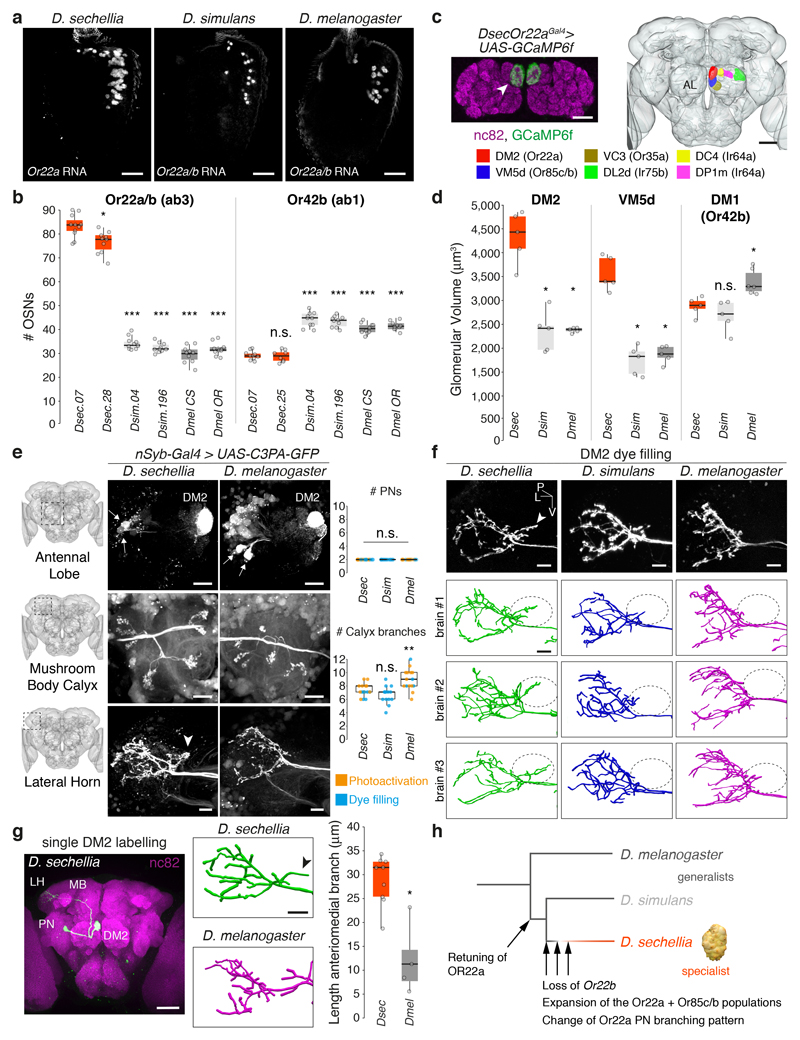
The evolution of animal behaviour is poorly understood1,2. Despite numerous correlations between interspecific divergence in behaviour and nervous system structure and function, demonstrations of the genetic basis of these behavioural differences remain rare3-5. Here we develop a neurogenetic model, Drosophila sechellia, a species that displays marked differences in behaviour compared to its close cousin Drosophila melanogaster6,7, which are linked to its extreme specialization on noni fruit (Morinda citrifolia)8-16. Using calcium imaging, we identify olfactory pathways in D. sechellia that detect volatiles emitted by the noni host. Our mutational analysis indicates roles for different olfactory receptors in long- and short-range attraction to noni, and our cross-species allele-transfer experiments demonstrate that the tuning of one of these receptors is important for species-specific host-seeking. We identify the molecular determinants of this functional change, and characterize their evolutionary origin and behavioural importance. We perform circuit tracing in the D. sechellia brain, and find that receptor adaptations are accompanied by increased sensory pooling onto interneurons as well as species-specific central projection patterns. This work reveals an accumulation of molecular, physiological and anatomical traits that are linked to behavioural divergence between species, and defines a model for investigating speciation and the evolution of the nervous system.


Conflict of interest statement

Competing interests

The authors declare no competing interests.

Figures

Extended Data Fig. 1
Extended Data Fig. 1. Species-specific short- and long-range behavioural responses to diverse fruit stimuli.
a, Data reproduced from Fig. 1c. Behavioural responses in a trap assay testing preferences between noni and grape, or between noni juice and grape juice (n = 15-27 experiments; 22-25 females/experiment). Comparisons to Dsec.07 responses to noni juice are shown (a-d and h (right): pairwise Wilcoxon rank-sum test and P values adjusted for multiple comparisons using the B&H method): *** P < 0.001; n.s. P > 0.05. b, Proportion of flies (mean ± SEM) in each stimulus trap for the assays shown in a. Comparisons to Dsec.07 responses are shown. c, Behavioural responses in a trap assay testing preferences between noni juice and diverse fruit juices or fruits for D. sechellia (DSSC 14021-0248.07), D. simulans (DSSC 14021-0251.004) and D. melanogaster (Canton-S) (n = 10-11 experiments; 22-25 females/experiment). Comparisons to Dsec.07 responses are shown. d, Proportion of flies (mean ± SEM) in each stimulus trap for the assays shown in c. Comparisons to Dsec.07 responses are shown. e, Radar plot showing the mean percentage of flies per trap in a multiple choice trap assay with eight different stimuli for D. sechellia (DSSC 14021-0248.07), D. simulans (DSSC 14021-0251.004) and D. melanogaster (Canton-S) (n = 11 experiments; 22-25 females/experiment). ACV = Apple cider vinegar. f, Left: Behavioural responses to noni juice in a wind tunnel assay of D. sechellia (DSSC 14021-0248.07) reared on standard food with (+) and without (-) noni supplement (Kruskal-Wallis test: n.s. P > 0.05). Right: Behavioural responses in a trap assay testing preferences between noni juice and grape juice for D. sechellia (DSSC 14021-0248.07) reared on standard food with (+) and without (-) noni supplement (pairwise Wilcoxon rank-sum test: n.s. P > 0.05). g, Behavioural responses to apple cider vinegar, mango juice, pineapple or fig in a wind tunnel assay of D. sechellia (DSSC 14021-0248.07), D. simulans (DSSC 14021-0251.004) and D. melanogaster (Canton-S) (n = 10-12 experiments; 10 females/experiment). Comparisons to Dsec.07 responses are shown (g and h (left): Kruskal-Wallis test with Dunn’s post-hoc correction): * P < 0.05; n.s. P > 0.05. h, Behavioural responses in a wind tunnel assay testing preference between noni fruit and apple cider vinegar of D. sechellia (DSSC 14021-0248.07), D. simulans (DSSC 14021-0251.004) and D. melanogaster (Canton-S) (n = 15 experiments; 10 females/experiment). Left: total number of flies landing on an odour source. Comparisons to Dsec.07 responses are shown. Right: attraction index calculated as: (flies landing on apple cider vinegar – flies landing on noni)/flies landing on either source. Comparisons to Dsec.07 responses are shown.
Extended Data Fig. 2
Extended Data Fig. 2. Chemicals emitted by natural odour sources and odour bouquet changes in behavioural assays.
a, Principal constituents of the odour bouquet of noni fruit at different ripening stages and commercial noni juice, as determined by gas chromatography/mass spectrometry. AU = arbitrary units. b, Chemical composition of the odour bouquet of noni fruit at different stages of ripening, noni juice, grape juice and apple cider vinegar. Representative gas chromatograms are shown on the right. Numbers correspond to compounds as listed in Supplementary Table 1 (not all identified peaks are shown). c, Dose-dependent electrophysiological responses of Or22a, Or85c/b and Ir75b neurons in wild-type D. sechellia (DSSC 14021-0248.07) to their best odour agonists (mean ± SEM and individual data points, n = 7-20, females). The contribution of Or35a neurons (whose spiking is difficult to separate from Ir75b neurons in ac3I) to hexanoic acid responses is likely to be minimal (Fig. 2b). D. sechellia Or22a and Or85c/b dose response data are replotted from Fig. 3a. d, Chemical profile of odours collected by SPME at the release and landing platforms in the wind tunnel assay within the first 10 min after noni juice application. e, Chemical profile of odours collected by SPME in the trap assay arena within 5 min after placement of a trap (i.e., t = 0 h), and after 5 h and 10 h, using noni juice as stimulus. “0%” indicates only trace proportions of the compound were detected.
Extended Data Fig. 3
Extended Data Fig. 3. Olfactory sensory neuron Gal4 driver lines in D. sechellia.
a, Schematic of the Gal4 reporter allele generation strategy, through CRISPR/Cas9-mediated integration of an attP site (marked by 3xP3:DsRed) into the desired Or or Ir gene (see Extended Data Fig. 5-6 for details on specific alleles), followed by introduction of a Gal4 open reading frame via phiC31-mediated transgenesis. b, Co-expression of the indicated OrGal4-driven, IrGal4-driven or control background GCaMP6f signal (detected by α-GFP) with the corresponding receptor protein or RNA in whole-mount antennae. Arrowheads point to examples of co-labelled cells. Scale bars, 25 μm; inset scale bars, 5 μm. While Or22aGal4 and Ir64aGal4 completely recapitulate endogenous receptor expression, OrcoGal4 and Or85c/bGal4 lack expression in some receptor-expressing neurons. Or35aGal4 and Ir75bGal4 might be expressed in ectopic cells (see also c-d) or the protein/RNA signal for these receptor genes could be below the detection threshold. c, Expression of the indicated OrGal4-driven, IrGal4-driven or control background GCaMP6f signal (detected by α-GFP) in glomeruli of whole-mount antennal lobes. Three focal planes of the neuropil (visualised with nc82 (magenta)) are shown. Images were registered to a D. sechellia reference brain (see Methods) for better comparison of antennal lobe structure. Scale bar, 25 μm. d, Summary of the glomerular labelling by OrGal4 or IrGal4 drivers as characterised in c (dark blue indicates GCaMP6f signal was detected in at least 3/3 independent brains). Glomeruli are organised by the compartmentalisation of the corresponding OSN populations into different sensilla classes (based on data in D. melanogaster, ab: antennal basiconic; at: antennal trichoid; ai; antennal intermediate; ac: antennal coeloconic, pb = palp basiconic, sac = sacculus, ? = OSN population unknown). OrcoGal4 is expressed in most but not all (e.g., Or67d/DA1) expected OSN populations; Or35aGal4 and Or85c/bGal4 display some ectopic expression as inferred by their labelling of more than one glomerulus.
Extended Data Fig. 4
Extended Data Fig. 4. Comparative olfactory representations of noni in D. melanogaster and D. sechellia.
a, Representative odour-evoked calcium responses in the axon termini of Orco OSNs in the antennal lobes of D. melanogaster (Orco-Gal4/Orco-Gal4;UAS-GCaMP6f/UAS-GCaMP6f) and D. sechellia (UAS-GCaMP6f/UAS-GCaMP6f;;DsecOrcoGal4/+;), acquired by widefield imaging. Left images: raw fluorescence signals. Right images: relative increase in GCaMP6f fluorescence (ΔF/F%) after stimulation with the indicated complex stimuli and single odours. Diagnostic odours: methyl hexanoate (10-6 (v/v)) for Or22a/(b)/DM2, ethyl propionate (10-4) for Or42b/DM1, 2-heptanone (10-5) for Or85c/b/VM5d, 2,3-butanedione (10-4) for Or92a/VA2 and 1-hexanol (10-4) for Or35a/VC3. Glomerular boundaries, and the entire antennal lobe, are outlined. Scale bars, 50 μm. b, Quantification of odour-evoked calcium responses for the animals represented in a. Maximum calcium response amplitudes for each experiment are plotted (n = 5-8 females). Significantly different responses of species to the same stimulus are shown (Wilcoxon signed-rank test): ** P < 0.01; * P < 0.05. c, Combined electrophysiological responses of neurons in the ab3 sensillum in D. melanogaster (top) and D. sechellia (bottom) upon stimulation with increasing concentrations of noni juice or noni fruit extract (mean ± SEM and individual data points, n = 6, females). Significant differences in responses are shown (pairwise Wilcoxon rank-sum test): ** P < 0.01; * P < 0.05. Note that responses of D. sechellia are stronger to noni fruit than noni juice, which may reflect the lower abundance of relevant ligands in the juice. d, Representative odour-evoked calcium responses in the axon termini of Orco OSNs in the antennal lobe of D. sechellia (UAS-GCaMP6f/UAS-GCaMP6f;;DsecOrcoGal4/+) acquired by two-photon imaging. Three focal planes are shown, revealing different glomeruli along the dorsoventral axis. Left column: raw fluorescence images. Other columns: relative increase in GCaMP6f fluorescence (ΔF/F%) after stimulation with diagnostic odours. Scale bar, 25 μm. e, Electrophysiological responses in the antennal coeloconic (ac) sensilla classes to the indicated stimuli (n = 6-11 sensilla, females) in D. sechellia (DSSC 14021-0248.07) representing the summed, solvent-corrected activities of the two or three neurons they house. f, Representative odour-evoked calcium responses in the axon termini of Ir64a OSNs in the D. sechellia antennal lobe (genotype: UAS-GCaMP6f/UAS-GCaMP6f;;DsecIr64aGal4/+) acquired by widefield imaging. Left images: raw fluorescence signals. Right images: relative increase in GCaMP6f fluorescence (ΔF/F%) after stimulation with noni juice (10-2) or grape juice. Scale bar, 25 μm. g, Quantification of odour-evoked calcium responses for the animals represented in f. Maximum calcium response amplitudes for each experiment are plotted (n = 7-10, females). Comparisons of responses to noni (10-2) and grape juice are shown (Wilcoxon signed-rank test): * P < 0.05.
Extended Data Fig. 5
Extended Data Fig. 5. Generation and validation of loss-of-function alleles of D. sechellia Or genes.
a, Schematic of the strategy for generating olfactory receptor mutant alleles, through integration of an eye-expressed fluorescent marker (3xP3:DsRed or 3xP3:GFPnls) into the desired locus via CRISPR/Cas9-cleavage induced homologous recombination. Brown triangles: loxP sites for removal of the fluorescent marker via Cre recombination. b, Schematics depicting Or gene organisation, the structure of mutant alleles, and the location of the sequences encoding antibody epitopes. For DsecOrco1 the fluorescent marker was integrated into the first coding exon; for DsecOrco2 the marker replaces parts of exons 1 and 3 and the whole of exon 2. DsecOr22aRFP carries the fluorescent marker in the first coding exon close to the start codon. DsecOr35aRFP lacks most of exons 1 and 2. For DsecOr85bGFP the marker was integrated into exon 1; for DsecOr85c/bRFP the marker replaces most of the Or85c gene and part of exon 1 of Or85b. c, Immunofluorescence for ORCO and IR25a (as internal staining control) on whole-mount antennae from wild-type and DsecOrco2 animals. c-g: Scale bars, 25 μm; inset scale bars, 5 μm. d, RNA FISH for Or22a and Or85b on whole-mount antennae from wild-type, DsecOr22aRFP and DsecOr85bGFP mutant animals. e, Immunofluorescence for IR75b and RNA FISH for Or35a on whole-mount antennae from wild-type and DsecOr35aRFP mutant animals. Arrowheads indicate Or35a-expressing cells. Note that Or35a neurons also pair with Ir75c neurons in ac3II sensilla, which is reflected in Or35a-positive cells that are not paired with IR75b-expressing cells in wild-type antennae. f, Immunofluorescence for OR22a on whole-mount antennae from wild-type and DsecOr22aRFP mutant animals. Arrowheads indicate sensilla housing Or22a neurons. g, Left panel: immunofluorescence for ORCO and IR25a (as internal staining control) on whole-mount antennae from wild-type (same picture as shown in c) and DsecOrco1 animals. Central panel: electrophysiological responses in the two neurons of the ab3 sensillum (see Fig. 2a) to odours present in noni in D. sechellia (DSSC 14021-0248.07) and DsecOrco1 mutants (n = 5-20, females). Representative response traces to methyl hexanoate (10-6) and 2-heptanone (10-6) are shown to the left. Data points represent the solvent-corrected activities per neuron. D. sechellia wild-type responses are replotted from Fig. 2a. Surprisingly, even though ORCO expression is undetectable by immunofluorescence, weak electrophysiological responses in ab3 sensilla (and other ORCO-dependent sensilla (data not shown)) can be detected. These observations suggest that trace levels of functional ORCO are produced from this allele, potentially through use of in-frame start codons downstream of the marker insertion site (see h). h, A schematic depicting the location of the Orco start codon, the fluorescent marker insertion site of the DsecOrco1 allele and downstream potential alternative in-frame start codons.
Extended Data Fig. 6
Extended Data Fig. 6. Generation and validation of loss-of-function alleles of D. sechellia Ir genes.
a, Schematics depicting Ir gene organisation, the structure of mutant alleles, and the sequences encoding antibody epitopes. For DsecIr8aRFP/GFP the fluorescent marker was integrated into the first coding exon. For DsecIr64aRFP the marker replaces parts of exon 2. DsecIr75bRFP lacks parts of exons 3 and 4, while for DsecIr75bGFP the marker was integrated into exon 3. For both alleles of Ir75b, the fluorophore was removed via Cre-mediated recombination to produce Ir75b1 and Ir75b2. b, Immunofluorescence for IR64a and IR8a (as internal staining control) on whole-mount antennae from wild-type and DsecIr64aRFP mutant animals. Arrowheads indicate the Ir64a neuron dendrites innervating sensilla in the sacculus (sac). Scale bars, 25 μm; inset scale bars, 5 μm. c, Left panel (top): immunofluorescence for IR8a and IR25a (as internal staining control) on whole-mount antennae from wild-type and DsecIr8aGFP animals. Left panel (bottom): immunofluorescence for IR75b and RNA FISH for Or35a on whole-mount antennae from DsecIr75b2 mutant animals. Scale bars, 25 μm; inset scale bars, 5 μm. Right panel: electrophysiological responses in the ac3I sensillum (neurons housed are indicated in the cartoon) to noni juice, grape juice and odours present in noni (n = 4-11, females) in D. sechellia (DSSC 14021-0248.07) and olfactory receptor mutants affecting the Ir75b neuron (DsecIr8aGFP, DsecIr75b2). Data points represent the summed, solvent-corrected activities of the sensillum. D. sechellia wild-type responses are replotted from Fig. 2b. Note that the Or35a neuron exhibits residual responses to hexanoic acid in the DsecIr8a and DsecIr75b olfactory receptor mutants (see also Fig. 2b). d, Left panel: immunofluorescence for IR8a and IR25a (as internal staining control) on whole-mount antennae from wild-type (same picture as shown in c) and DsecIr8aRFP and DsecIr8aGFP (same picture as shown in c) animals. Scale bars, 25 μm; inset scale bars, 5 μm. Right panel: electrophysiological responses in the ac2 sensillum (neurons housed are indicated in the cartoon) to noni juice, grape juice and odours present in noni (n = 3-11, females) in D. sechellia (DSSC 14021-0248.07) and receptor mutants affecting the Ir75a neuron (DsecIr8aRFP, DsecIr8aGFP). Data points represent the summed, solvent-corrected neuronal activities of the sensillum. D. sechellia wild-type responses to noni and grape juice are as shown in Extended Data Fig. 4e. e, Immunofluorescence for IR75b and RNA FISH for Or35a on whole-mount antennae from wild-type and DsecIr75b1 and DsecIr75b2 (same picture as shown in c) animals. Scale bars, 25 μm; inset scale bars, 5 μm.
Extended Data Fig. 7
Extended Data Fig. 7. Genetic and chemical contributions promoting attraction of D. sechellia to noni.
a, Data reproduced from Fig. 2d. Behavioural responses in a trap assay testing preference of the indicated genotypes for noni juice or grape juice (n = 13-25 experiments; 22-25 females/experiment). Comparisons to Dsec.07 responses are shown (a-d and f: pairwise Wilcoxon rank-sum test and P values adjusted for multiple comparisons using the B&H method): red bars, no significant difference; salmon bars, significantly different response; *** P < 0.001; ** P < 0.01; * P < 0.05; n.s. P > 0.05. b, Proportion of flies (mean ± SEM) in each stimulus trap for the assays shown in a. Comparisons to Dsec.07 responses are shown. c, Olfactory responses in a trap assay testing preferences between noni juice and grape juice of D. sechellia (DSSC 14021-0248.07), DsecOrco1/Ir8aGFP double mutants and D. sechellia (DSSC 14021-0248.07) whose third antennal segments were removed (antenna-less) (n = 9-15 experiments; 22-25 females or males, as indicated/experiment). These data represent the same experiments shown in Fig. 2e, but attraction indices were calculated here taking only alive flies into account. The percentages of flies alive at the end of the assay are indicated below, revealing the high mortality rate of antenna-less flies and DsecOrco1/Ir8aGFP double mutants (DsecOrco2/Ir8aGFP mutants appeared to be non-viable). Normally, trap assay experiments with >25% animal mortality were discarded; see Methods. Comparisons to Dsec.07 responses are shown. d, Proportion of flies (mean ± SEM) in each stimulus trap for the assays shown in c. Comparisons to Dsec.07 responses are shown. e, Behavioural responses in a trap assay testing preferences between noni fruit and grape juice of Dsec.07 and DsecOr22aRFP flies. Comparisons to Dsec.07 responses are shown (pairwise Wilcoxon rank-sum test): n.s. P > 0.05. f, Behavioural responses in a trap assay testing preferences of D. sechellia (DSSC 14021-0248.07) between grape juice and 10-2 dilutions of the indicated odours in grape juice of D. sechellia (DSSC 14021-0248.07), DsecOr22aRFP, D. simulans (DSSC 14021-0251.004) and D. melanogaster (Canton-S). Comparisons to Dsec.07 responses to methyl hexanoate are shown. g, Behavioural responses in a wind tunnel assay testing attraction of D. sechellia (DSSC 14021-0248.07) to three single noni odours (10-2 in water), a mix of all three in the approximate proportions of ripe noni fruit (1:0.04:1, methyl hexanoate:2-heptanone:hexanoic acid) and noni juice (n = 10 experiments; 10 females/experiment). Comparisons to Dsec.07 responses to noni juice are shown (Kruskal-Wallis test with Dunn’s post-hoc correction): *** P < 0.001.
Extended Data Fig. 8
Extended Data Fig. 8. Odour-tuning properties of drosophilid Or85c/b and Or22a/(b) neurons and genomic modifications of the Or22a/(b) loci.
a, Left: dose-dependent electrophysiological responses of Or85c/b neurons (ab3B) in wild-type D. sechellia (DSSC 14021-0248.07) to 2-heptanone and 1-hexanol (mean ± SEM and individual data points; n = 10-20, females). Right: dose-dependent electrophysiological responses of Or22a neurons (ab3A) in wild-type D. sechellia (DSSC 14021-0248.07) to methyl butanoate, methyl hexanoate and methyl octanoate (mean ± SEM and individual data points; n = 10-20, females). The dose response curves for 2-heptanone and methyl hexanoate are replotted from Fig. 3a. b, Schematics depicting the arrangement of wild-type, mutant and rescue allele versions of DsecOr22a (top) and DmelOr22a/Or22b (bottom). Asterisk = stop codon preventing read through from the endogenous Or22a open reading frame. c, Schematics depicting the arrangement of wild-type and mutant alleles of DsimOr22a/Or22b. d, RNA FISH for Or22a on whole-mount antennae from wild-type D. simulans (DSSC 14021-0251.195), DsimOr22aRFP and DsimOr22a/bRFP mutant animals. As Or22a shares 85% sequence similarity with Or22b, the Or22a probe hybridises with transcripts from both genes. Arrowheads indicate Or22b-expressing cells in DsimOr22aRFP. Scale bar, 25 μm; inset scale bar, 5 μm. e, Electrophysiological responses of Or22a/b neurons to different esters in wild-type D. simulans (DSSC 14021-0251.195) and receptor mutants (DsimOr22aRFP, DsimOr22a/bRFP) (n = 6-10, females). Representative response traces to methyl hexanoate (10-6) and ethyl butanoate (10-2) are shown to the left. f, Heat map representation of the data shown in e, together with the data of the DsimOr22awt response profile when expressed in DsecOr22aRFP (replotted from Fig. 3c). The receptors expressed in the analysed neurons are listed to the right. Significant differences to D. simulans wild-type responses are shown (pairwise Wilcoxon rank-sum test and P values adjusted for multiple comparisons using the B&H method): *** P < 0.001; ** P < 0.01; * P < 0.05; n.s. P > 0.05. The equivalent responses to ethyl butanoate of D. simulans wild-type and Or22a mutant neurons (but complete loss in Or22a/b mutant neurons) suggests that this odour is detected principally by OR22b. g, Boxplots with individual data points of the electrophysiological data presented in Fig. 3b. h, Boxplots with individual data points of the electrophysiological data presented in Fig. 3c. i, Boxplots with individual data points of the electrophysiological data presented in Fig. 3e.
Extended Data Fig. 9
Extended Data Fig. 9. Mapping of odour-specificity determinants of OR22a.
a, Electrophysiological responses of D. melanogaster Or22a/b mutant neurons expressing DsecOr22awt or DmelOr22awt upon stimulation with increasing concentrations of noni fruit extract (mean ± SEM and individual data points; n = 9, females). Significantly different values are indicated (pairwise Wilcoxon rank-sum test): *** P < 0.001. b, Protein sequence alignment of OR22a orthologues of six species within the D. melanogaster species subgroup. Red shading: amino acid differences between D. melanogaster and D. sechellia, D. simulans and D. mauritiana that were analysed by mutagenesis in this study; blue shading: all other sequence differences. Arrowheads: chimera breakpoints (see c). Predicted transmembrane (TM) domains are indicated with grey lines (location as in). c, Electrophysiological responses to a panel of noni odours conferred by chimeric OR22a proteins encoded by transgenes integrated at the Or22a/b locus of D. melanogaster (n = 5-6, females). Schematics on the left indicate the relative proportions of D. sechellia (red) and D. melanogaster (dark grey) sequences in each chimera (precise chimera breakpoints are shown in b). Significant differences to DmelOr22awt responses are shown (c, d and g: pairwise Wilcoxon rank-sum test and P values adjusted for multiple comparisons using the B&H method): *** P < 0.001; ** P < 0.01; * P < 0.05; n.s. P > 0.05. d, Electrophysiological responses of D. melanogaster Or22a/b mutant neurons expressing different OR22a variants (n = 5-7, females). The location of each mutated residue is indicated in b. Data for Or22a/b mutant and DmelOr22awt responses are replotted from c. Significant differences to DmelOr22awt responses are shown. e, Boxplots with individual data points showing the same data as in c. f, Boxplots with individual data points showing the same data as in d. g, Dose-dependent electrophysiological responses of D. sechellia Or22a neurons expressing the indicated transgenes to ethyl or methyl hexanoate (mean ± SEM and individual data points; n = 10, females). Significant comparisons to either the DmelOr22awt (left graphs) or the DsecOr22awt (right graphs) transgene responses are shown.
Extended Data Fig. 10
Extended Data Fig. 10. Peripheral and central olfactory circuit changes in D. sechellia.
a, Quantification of the number of OSNs expressing Or22a/(b) in antennae of wild-type D. sechellia (DSSC 14021-0248.07) and D. melanogaster (Canton-S) (data as shown in Fig. 4b), Or22a/(b) mutants in both species, and rescue lines expressing DsecOr22awt (n = 9-11, females). Comparisons of rescue and wild-type genotypes for each species are shown (pairwise Wilcoxon rank-sum test). n.s. P > 0.05. No significant differences in Or22a cell number were observed for different rescue transgenes (data not shown). b, Quantification of the number of OSNs expressing Or13a (ab6), Or98a (ab7) or Or35a (ac3I/II) in D. sechellia (DSSC 14021-0248.07), D. simulans (DSSC 14021-0251.004), and D. melanogaster (Canton-S) (n = 10-15, females). Comparisons to Dsec.07 cell number counts are shown (pairwise Wilcoxon rank-sum test and P values adjusted for multiple comparisons using the B&H method): *** P < 0.001; ** P < 0.01; n.s. P > 0.05. c, Immunofluorescence with nc82 (neuropil), α-Elav (neurons) and α-GFP in a DsecnSyb-Gal4/UAS-C3PA-GFP transgenic line, which expresses photoactivatable GFP pan-neuronally. The schematic on the left indicates the region of image acquisition. An anterior section through the antennal lobe (AL) is shown to reveal the position of the labelled projection neuron (PN) soma (circled in the right panel). Scale bar, 25 μm. d, Electrophysiological responses of the Or22a neuron to odours present in noni in homozygous DsecOr22aGal4 (mutant) transgenic animals (n = 6, females). Data points represent the solvent-corrected activities. Representative response traces to methyl hexanoate (10-6) in wild-type and transgenic animals are shown on top. e, Tracing of axonal branches in the lateral horn of dye-filled DM2 PNs in D. sechellia wild-type and homozygous DsecOr22aGal4 mutant flies. Three representative samples are shown. The circles depict the position of the D. sechellia-specific axonal branch. Scale bar, 10 μm. Samples could not be discriminated by genotype when presented to six independent researchers blindly.
Extended Data Fig. 11
Extended Data Fig. 11. Phylogenetic and functional analysis of odour-specificity determinants in OR22a.
a, Side view of the ORCO monomer structure (determined by cryo-electronic microscopy); the approximate location of the plasma membrane is indicated. The location of the residues corresponding to the odour-specificity determinants of OR22a analysed in this study (based on alignments generated in) are highlighted as spheres. b, Top view of a cross-section through the putative ligand-binding pocket of the ORCO structure shown in a. c, Partial protein sequence alignment of OR22a and OR59b. The equivalent residue to D. melanogaster OR22a M93 in OR59b is V91, which exhibits intraspecific sequence variation impacting odour sensitivity. d, Results of branch-based models of molecular evolution that tested for changes in the rates of protein evolution among OR22a and OR22b orthologues (see Methods and Supplementary Table 8): the rate of protein changes within the OR22a/OR22b phylogenetic tree highlights dN/dS ratios (ω) that differ from the “background rate” (ω = 0.1772). Most branches exhibited low ω, arguing for strong purifying selection to maintain protein function over much of the tree. The two ω values that are >1 indicate an excess of protein changes, consistent with positive selection. The branch leading to D. simulans and D. sechellia OR22a displays nearly equal rates of silent and replacement substitutions, consistent with relaxed constraint during this period. e, Allele frequencies within population datasets for D. melanogaster,, D. simulans, and D. sechellia at the three sites of OR22a that were functionally characterised in this study. The table displays amino acid (aa) positions 45, 67 and 93 of OR22a and the frequencies at which variants within the corresponding codons are segregating (number of alleles with respective variant/number of alleles analysed). “NA” (not applicable) indicates that positions within the codon are invariant. Datasets analysed are referenced on the right. Selected Or22a variants from the Drosophila melanogaster Genetic Reference Panel (DGRP) were confirmed by sequencing (f) and Or22a neuron physiology analysed (g,h). f, Protein sequence alignment of OR22a orthologues of D. melanogaster, three lines of the DGRP, D. mauritiana (DSSC 14021-0241.151) and D. sechellia (DSSC 14021-0248.07). Red shading: shared amino acid differences of DGRP #303, DGRP #304 and D. mauritiana (compared to other sequences) at position 59 and the key odour specificity-determinant at residue 93; blue shading: all other sequence differences. No line within the DGRP with a polymorphism only at position 93 was identified. g, Electrophysiological responses of the Or22a/b neuron to odours present in noni (n = 5-20, females) in the strains shown in f. The similarity between the response profiles of DGRP #303, DGRP #304 and D. mauritiana suggests that their only shared polymorphism (at position 59) modifies OR22a response properties in these strains. Comparisons to Dmel BER responses are shown (pairwise Wilcoxon rank-sum test and P values adjusted for multiple comparisons using the B&H method): *** P < 0.001; ** P < 0.01; n.s. P > 0.05. D. mauritiana and D. sechellia data are replotted from Fig. 3b. h, Boxplots with individual data points showing the same data as in g. D. mauritiana and D. sechellia data are replotted from Extended Data Fig. 8g. i, Protein sequence alignment of OR22a orthologues of the noni-specialised D. yakuba mayottensis (Dyak may.) and three other D. yakuba strains (DSSC 14021-0261.00, 14021-0261.40, 14021-0261.49). Blue shading: differences between these sequences. j, Collection sites of D. yakuba strains shown in i. k, Quantification of the number of OSNs expressing Or22a/(b) in D. sechellia (DSSC 14021-0248.07), D. simulans (DSSC 14021-0251.004), D. melanogaster (Canton-S) (data as shown in Fig. 4b), D. yakuba (DSSC 14021-0261.00, 14021-0261.49) and D. yakuba mayottensis (n = 10-12, females). Comparisons to Dsec.07 cell number counts are shown (k and l: pairwise Wilcoxon rank-sum test and P values adjusted for multiple comparisons using the B&H method): *** P < 0.001; ** P < 0.01; * P < 0.05; n.s. P > 0.05. l, Electrophysiological responses to odours present in noni of the Or22a/(b) neurons in D. sechellia (DSSC 14021-0248.07), D. melanogaster (Canton-S), D. yakuba mayottensis (n = 5-20, females) and D. yakuba (DSSC 14021-0261.00). Comparisons to Dsec.07 responses are shown. D. sechellia, D. melanogaster and D. yakuba.00 data are replotted from Fig. 3b. m, Boxplots with individual data points showing the same data as in l. D. sechellia, D. melanogaster and D. yakuba.00 data are replotted from Extended Data Fig. 8g.
Extended Data Fig. 12
Extended Data Fig. 12. Protein sequence alignments of OR22a and IR75b.
a, OR22a orthologues of strains used for behavioural assays as well as genome-sequenced strains (“gen.”) of each species (version: D. sechellia (r1.3), D. simulans (r2.01), D. melanogaster (r6.28)). Blue/red shading: differences between species/strains. Green boxes: residues tested in this study for their role in defining ester tuning specificity. b, IR75b orthologues of same strains as in a. Blue/red shading: differences between species/strains. Black boxes: residues predicted to be located within the ligand-binding domain that contribute to odour tuning specificity. Note that the premature stop codon of the Canton-S strain (position 169, marked by an asterisk) does not impair receptor function, as shown in other strains.
Fig. 1
Fig. 1. Behavioural and physiological responses of D. sechellia to noni.
a, D. sechellia specialises on noni fruit (Morinda citrifolia) while D. simulans and D. melanogaster are food generalists (MYA = million years ago). b, Behavioural responses to noni fruit or juice in a wind tunnel assay of D. sechellia, D. simulans and D. melanogaster wild-type strains (n = 20 experiments (10 females/experiment)). In this and other panels, boxplots show the median, first and third quartile of the data, overlaid with individual data points. Comparisons to Dsec.07 noni juice responses are shown (Kruskal-Wallis test, Dunn’s post-hoc correction): *** P < 0.001; n.s. P > 0.05. c, Behavioural responses in a trap assay testing preferences between noni and grape, or between noni juice and grape juice (same strains as in b, n = 15-27 experiments, exact n in Source Data, (22-25 females/experiment)). Comparisons to Dsec.07 noni juice responses are shown (pairwise Wilcoxon rank-sum test, P values adjusted for multiple comparisons using the Benjamini and Hochberg (B&H) method): *** P < 0.001; n.s. P > 0.05. d, Odour bouquet of a ripe noni fruit determined by gas chromatography/mass spectrometry (see Methods, Extended Data Fig. 2, Supplementary Table 1). e, Representative odour-evoked calcium responses in the axon termini of Orco OSNs in the D. sechellia antennal lobe (genotype: UAS-GCaMP6f/UAS-GCaMP6f;;DsecOrcoGal4/+) acquired by two-photon imaging. Three focal planes are shown, revealing different glomeruli (outlined) along the dorsoventral axis. Left column: raw fluorescence images. Right columns: relative increase in GCaMP6f fluorescence (ΔF/F%) after stimulation with noni juice (10-2 in H2O) or grape juice. Scale bar, 25 μm. f, Quantification of responses for the animals represented in e. Maximum response amplitudes for each experiment are plotted (n = 7-10 females). Wilcoxon signed-rank test: ** P < 0.01; * P < 0.05; n.s. P > 0.05.
Fig. 2
Fig. 2. Olfactory receptors contribution to noni-sensing.
a, Electrophysiological responses of ab3 sensillum neurons to noni odours (n = 5-20, females, see Supplementary Table 7 for exact n and mean spike counts) in wild-type and receptor mutant D. sechellia (schematised in the cartoons), with representative traces for methyl hexanoate and 2-heptanone. Data points are the solvent-corrected activities of individual neurons (arrowheads in wild-type traces). Odours (oct, octanoate; hex, hexanoate; but, butanoate) are coloured according to chemical class: methyl esters (salmon), ethyl esters (dark red), acids (light blue), others (black), used at 10-2 v/v unless indicated otherwise. PO = paraffin oil. b, Responses of ac3I neurons to noni juice, grape juice and noni odours (n = 5-11, females) in wild-type and receptor mutant D. sechellia, with representative traces for hexanoic acid and 1-hexanol. Data points are the summed, solvent-corrected activities of both neurons. c, Behavioural responses to noni juice in the wind tunnel assay (n = 20 experiments). Comparisons to Dsec.07 responses are shown (Kruskal-Wallis test, Dunn’s post-hoc correction). c, d, e: red = no significant difference; salmon = significantly different response; *** P < 0.001; ** P < 0.01; * P < 0.05; n.s. P > 0.05. d, Behavioural responses in the trap assay testing preference for noni juice or grape juice (n = 13-25 experiments). Comparisons to Dsec.07 responses are shown (d and e, pairwise Wilcoxon rank-sum test, P values adjusted for multiple comparisons using the B&H method). e, Behavioural responses in the trap assay testing preference for noni juice or grape juice using wild-type D. sechellia, DsecOrco1/Ir8aGFP double mutants and antenna-less D. sechellia (n = 9-15 experiments (22-25 females or males, as indicated/experiment)). Average attraction indices for DsecOrco1/Ir8aGFP and antenna-less flies are not significantly different from zero (pairwise Wilcoxon rank-sum test).
Fig. 3
Fig. 3. Tuning of OR22a is important for noni attraction.
a, Dose-dependent responses of Or85c/b (left) and Or22a/(b) neurons (right) in the indicated species to 2-heptanone and methyl hexanoate, respectively (mean ± SEM and individual data points, n = 7-20, females). Significant differences to D. sechellia responses are shown (a, b, c and e: pairwise Wilcoxon rank-sum test, P values adjusted for multiple comparisons using the B&H method): *** P < 0.001; ** P < 0.01; * P < 0.05. b, Responses of Or22a/(b) neurons to noni odours across the D. melanogaster species subgroup; MY = million years (n = 5-20, females). D. sechellia responses as in Fig. 2a. Significant differences to D. sechellia ester responses are shown. c, Responses of D. sechellia Or22a neurons expressing wild-type (top) or mutant (bottom) versions of Or22a at the Or22a locus (n = 10-11, females). Significant differences to DsecOR22awt responses are shown (c and e). Responses to methyl hexanoate at 10-4 here compared to 10-6 in b and e. d, Behavioural responses to noni fruit in the wind tunnel assay (n = 25-45 experiments). Comparisons to Dsec.07 (top) and DsecOR22awt (below) responses are shown (d and f, Kruskal-Wallis test, Dunn’s post-hoc correction). Salmon = D. sechellia genotypes with significantly different response to Dsec.07; *** P < 0.001; ** P < 0.01; * P < 0.05. e, Responses of D. melanogaster Or22a/b mutant neurons expressing wild-type (top) or mutant (bottom) versions of Or22a (n = 5-7, females). Boxplot representations of b, c and e are shown in Extended Data Fig. 8g, h and i, respectively. f, Behavioural responses to noni fruit in the wind tunnel assay (n = 20 experiments). Comparisons to DsecOr22awt (top) and DmelOR22awt (below) responses are shown. Salmon = genotypes with significantly different responses.
Fig. 4
Fig. 4. Neuroanatomy of noni-sensing olfactory pathways.
a, Antennal Or22a/b RNA expression in different species. Scale bars, 25 μm. b, Quantification of Or22a/(b) or Or42b OSNs (n = 8-11, females). Comparisons to Dsec.07 are shown (pairwise Wilcoxon rank-sum test, P values adjusted for multiple comparisons using the B&H method, b, d, e): *** P < 0.001; ** P < 0.01; * P < 0.05; n.s. P > 0.05. c, Left: Or22aGal4-driven GCaMP6f expression in DM2 (arrowhead); neuropil visualised with nc82 (magenta). Scale bar, 25 μm. Right: Antennal lobe (AL) glomerular segmentation in D. sechellia (Extended Data Fig. 3). Scale bar, 50 μm. d, Quantification of DM2, VM5d and DM1 volumes (n = 5 females). e, DM2 projection neurons (PNs) labelled via photoactivation in D. sechellia (DsecnSyb-Gal4/UAS-C3PA-GFP) and D. melanogaster (UAS-SPA-GFP/UAS-C3PA-GFP;nSyb-Gal4/UAS-C3PA-GFP). Left: Image acquisition site. Top: AL with labelled PNs (arrows) and DM2 glomerulus; scale bar, 20 μm. Middle and bottom: PN innervation of mushroom body calyx and lateral horn (LH); scale bars, 10 μm. Arrowhead (e, f, g): extra anterio-medial branch in D. sechellia. Right: quantification of DM2 PNs (top) and calyx branches (bottom) (n = 14-17 females). f, LH arbours of dye-filled DM2 PNs. Genotypes: D. sechellia, D. melanogaster as in e, D. simulans: DsimOr22aGFP. Below: representative LH DM2 arbour traces. Ovals: location of D. sechellia-specific branch. P, posterior; L, lateral; V, ventral. Scale bars, 10 μm. g, Left: single dye-filled DM2 PN in D. sechellia; scale bar, 50 μm. Middle: representative LH arbour traces of DM2 PNs in D. sechellia and D. melanogaster; scale bar, 10 μm. Right: quantification of anteriomedial branch length (n = 4-9 females) (pairwise Wilcoxon rank-sum test): * P < 0.05. h, Evolution of structural and physiological changes in the Or22a pathway.

Comment in

References

    1. Arguello JR, Benton R. Open questions: Tackling Darwin's "instincts": the genetic basis of behavioural evolution. BMC Biol. 2017;15:26. - PMC - PubMed
    1. Bendesky A, Bargmann CI. Genetic contributions to behavioural diversity at the gene-environment interface. Nat Rev Genet. 2011;12:809–820. - PubMed
    1. Bendesky A, et al. The genetic basis of parental care evolution in monogamous mice. Nature. 2017;544:434–439. - PMC - PubMed
    1. Ding Y, Berrocal A, Morita T, Longden KD, Stern DL. Natural courtship song variation caused by an intronic retroelement in an ion channel gene. Nature. 2016;536:329–332. - PubMed
    1. Weber JN, Peterson BK, Hoekstra HE. Discrete genetic modules are responsible for complex burrow evolution in Peromyscus mice. Nature. 2013;493:402–405. - PubMed

Publication types

MeSH terms

LinkOut - more resources