

Are the poorest poor being left behind? Estimating global inequalities in reproductive, maternal, newborn and child health
- PMID: 32133180
- PMCID: PMC7042578
- DOI: 10.1136/bmjgh-2019-002229
Are the poorest poor being left behind? Estimating global inequalities in reproductive, maternal, newborn and child health
Abstract
Introduction: Wealth-related inequalities in reproductive, maternal, neonatal and child health have been widely studied by dividing the population into quintiles. We present a comprehensive analysis of wealth inequalities for the composite coverage index (CCI) using national health surveys carried out since 2010, using wealth deciles and absolute income estimates as stratification variables, and show how these new approaches expand on traditional equity analyses.
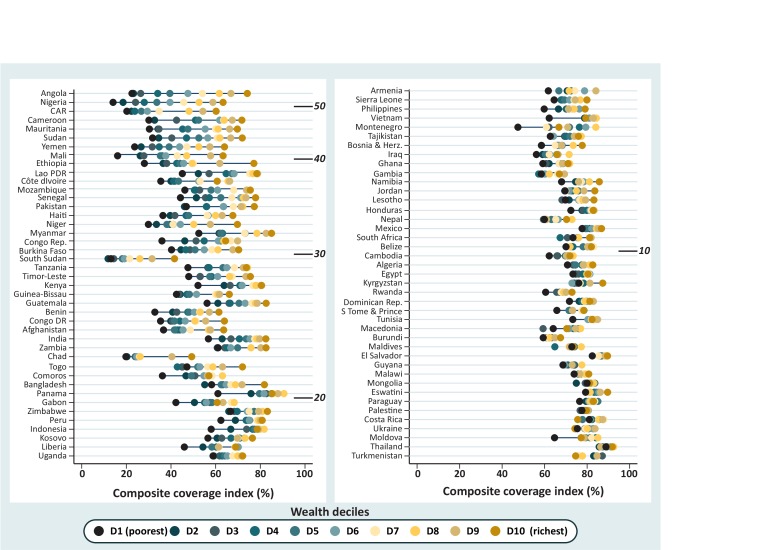
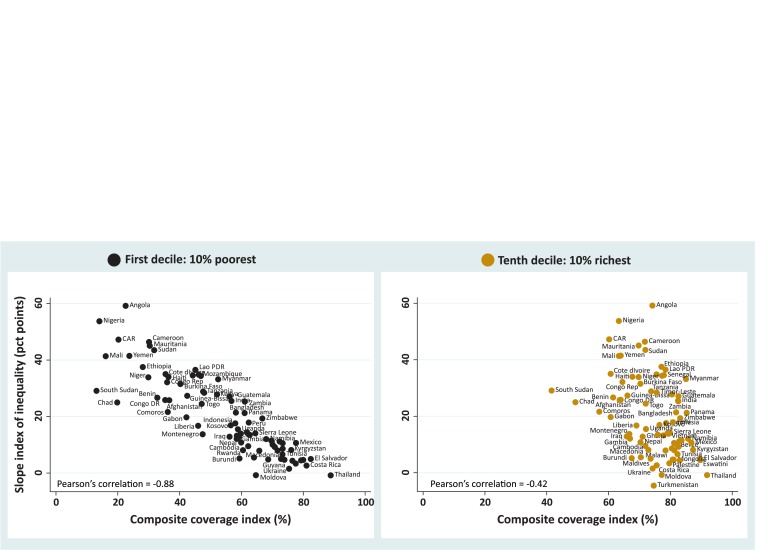
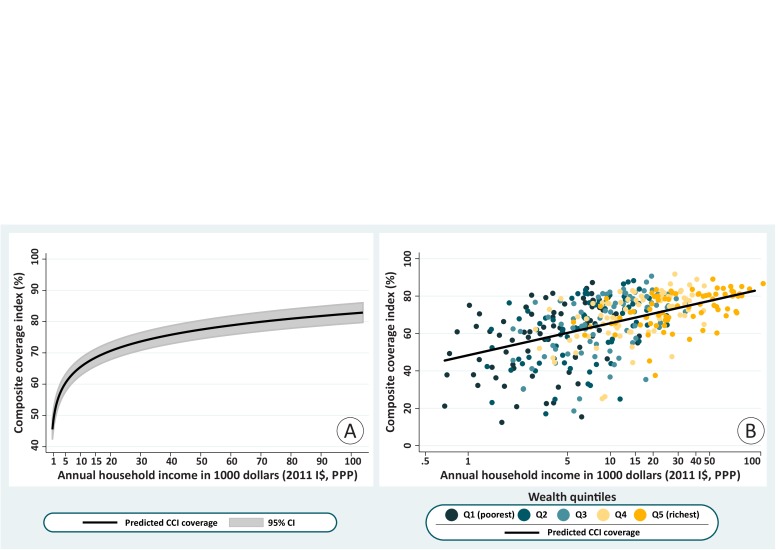
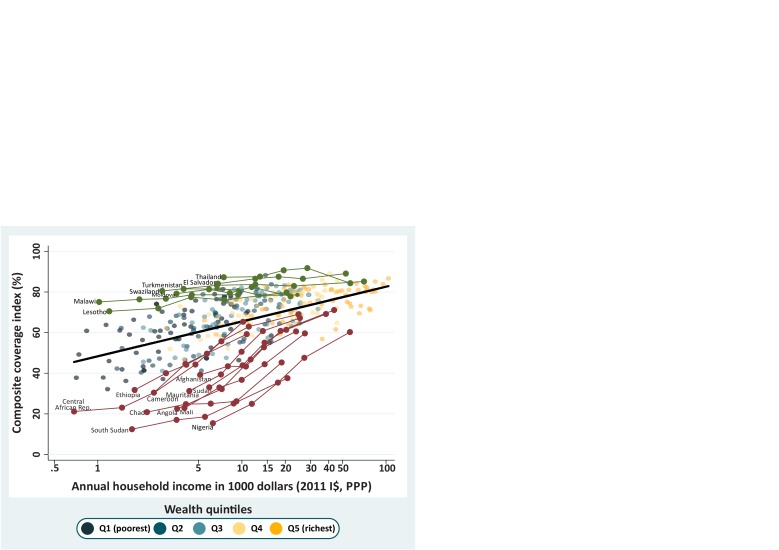
Methods: 83 low-income and middle-income countries were studied. The CCI is a combined measure of coverage with eight key reproductive, maternal, newborn and child health interventions. It was disaggregated by wealth deciles for visual inspection of inequalities, and the slope index of inequality (SII) was estimated. The correlation between coverage in the extreme deciles and SII was assessed. Finally, we used multilevel models to examine how the CCI varies according to the estimated absolute income for each wealth quintile in the surveys.
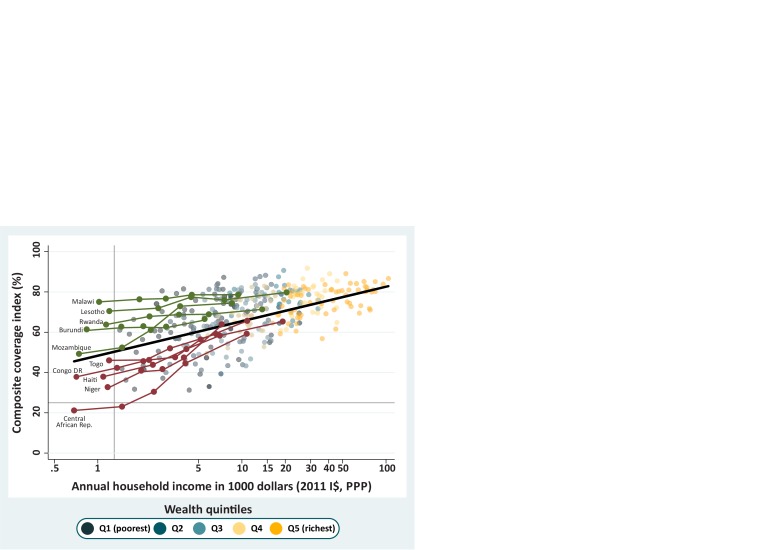
Results: The analyses of coverage by wealth deciles and by absolute income show that inequality is mostly driven by coverage among the poor, which is much more variable than coverage among the rich across countries. Regardless of national coverage, in 61 of the countries, the wealthiest decile achieved 70% or higher CCI coverage. Well-performing countries were particularly effective in achieving high coverage among the poor. In contrast, underperforming countries failed to reach the poorest, despite reaching the better-off.
Conclusion: There are huge inequalities between the richest and the poorest women and children in most countries. These inequalities are strongly driven by low coverage among the poorest given the wealthiest groups achieve high coverage irrespective of where they live, overcoming any barriers that are an impediment to others. Countries that 'punched above their weight' in coverage, given their level of absolute wealth, were those that best managed to reach their poorest women and children.
Keywords: child health; maternal health.
© Author(s) (or their employer(s)) 2020. Re-use permitted under CC BY. Published by BMJ.
Conflict of interest statement
Competing interests: None declared.
Figures
References
-
- Gwatkin DR, Rutstein S, Johnson K, et al. Socio-economic differences in health, nutrition, and population within developing countries : an overview. Washington, DC: World Bank, 2007. http://documents.worldbank.org/curated/en/962091468332070548/pdf/483610W... - PubMed
-
- Boerma JT, Bryce J, Kinfu Y, et al. Mind the gap: equity and trends in coverage of maternal, newborn, and child health services in 54 countdown countries. Lancet 2008;371:1259–67. - PubMed
Publication types
MeSH terms
Grants and funding
LinkOut - more resources
Full Text Sources
Medical