Review
. 2020 Feb 26;6(9):eaax1420.
doi: 10.1126/sciadv.aax1420. eCollection 2020 Feb.

The Archean atmosphere

Affiliations
Review

The Archean atmosphere

David C Catling et al. Sci Adv. .

Abstract

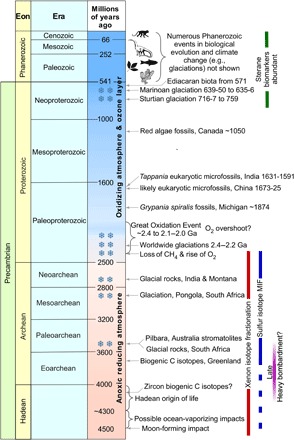
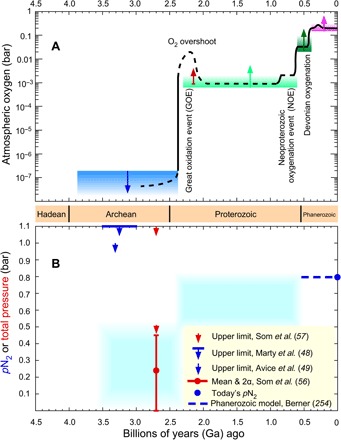
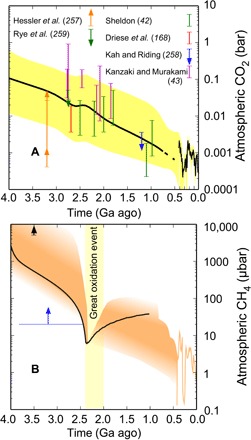
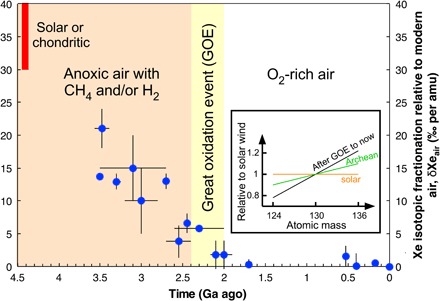
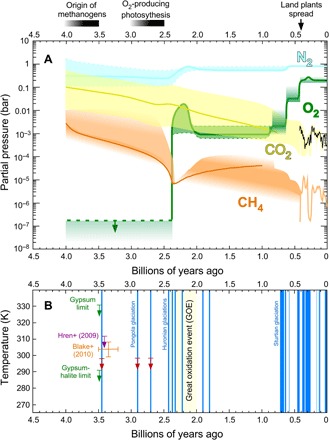
The atmosphere of the Archean eon-one-third of Earth's history-is important for understanding the evolution of our planet and Earth-like exoplanets. New geological proxies combined with models constrain atmospheric composition. They imply surface O2 levels <10-6 times present, N2 levels that were similar to today or possibly a few times lower, and CO2 and CH4 levels ranging ~10 to 2500 and 102 to 104 times modern amounts, respectively. The greenhouse gas concentrations were sufficient to offset a fainter Sun. Climate moderation by the carbon cycle suggests average surface temperatures between 0° and 40°C, consistent with occasional glaciations. Isotopic mass fractionation of atmospheric xenon through the Archean until atmospheric oxygenation is best explained by drag of xenon ions by hydrogen escaping rapidly into space. These data imply that substantial loss of hydrogen oxidized the Earth. Despite these advances, detailed understanding of the coevolving solid Earth, biosphere, and atmosphere remains elusive, however.


Figures

Fig. 1
Fig. 1. Precambrian events and atmospheric change.
For biological evolutionary dates, see (6). For a description of other events, see (64) and references therein.
Fig. 2
Fig. 2. Schematic histories of atmospheric O2 and surface barometric pressure or N2.
(A) Colored arrows faithfully represent known O2 constraints, but the black line is speculative. An Archean upper bound of <0.2-μbar O2 (blue) is for photochemistry that generates S8 aerosols, preserving observed mass-independent isotope fractionation in sulfur compounds (44). The size and shape of an O2 overshoot during the GOE are highly uncertain; a lower bound (red arrow) comes from iodine incorporation into carbonates (251). In the Proterozoic, a lower bound (light green) of 6 × 10⁻⁴ bar is required for an O2-rich atmosphere to be photochemically stable (44). However, O2 levels likely remained low for most of the Proterozoic (252). Neoproterozoic oxygenation began around ~800 Ma ago. From ~600 Ma ago, a lower bound of >0.02-bar O2 (dark green) is from plausible O2 demands of macroscopic Ediacaran and Cambrian biota (120). Charcoal since 0.4 Ga ago implies a lower bound of >0.15 bar (purple) (253). The post-Devonian black line for O2 evolution approximately represents curves from calculations of C and S isotopic mass balance (254, 255). (B) Constraints on surface atmospheric pressure (red) (56, 57) and the partial pressure of nitrogen, pN2 (blue) (48, 49, 140). Blue shading shows a schematic and speculative pN2 range in different time intervals consistent with very sparse proxy data.
Fig. 3
Fig. 3. History of CO2 and a CH4 schematic since the Archean.
(A) The black line is median CO2 from a carbonate-silicate climate model, and yellow shading indicates its 95% confidence interval (34); this curve merges with a fit to CO2 proxy estimates for 0.42 Ga ago to present from (256). Various Precambrian pCO2 proxy estimates are shown (, , , –259). (B) A very schematic history of CH4. Constraints include a lower limit (blue) required for Archean S-MIF (44) and a tentative lower limit of ~3.5 Ga ago from a preliminary interpretation of xenon isotopes (black) (187). The black curve is from a biogeochemical box model coupled to photochemistry (121). Orange shading is schematic but consistent with possible biological CH4 fluxes into atmospheres of rising O2 levels at the GOE and in the Neoproterozoic. Note that the suggestion that moderately high levels of methane may have contributed to greenhouse warming in the Proterozoic (260, 261) has been disputed (262, 263) and may depend on fluxes from sources on land (264). The curve for ~0.4 Ga ago to present is from (265).
Fig. 4
Fig. 4. Mass fractionation of nine atmospheric xenon isotopes over time relative to modern air per atomic mass unit showing relative enrichment in light isotopes in the past.
Data from (49). The vertical axis shows the fractionation per atomic mass unit (amu) of atmospheric xenon relative to modern air. To compute this average fractionation across the nine isotopes, Avice and co-workers (49) normalized the isotopic compositions to 130Xe and to the isotopic composition of the modern atmosphere using the delta notation. For a Xe isotope of mass i, δiXeair = 1000 × ((iXe/130Xe)sample/(iXe/130Xe)air − 1). The slope of a straight line fit to the normalized data provides the average fractionation per atomic mass per unit and its uncertainty, i.e., plotted points. Inset: A diagram showing schematically how the slope of the fractionation of the nine isotopes changed over time relative to the initial solar composition, where the graph is normalized to atomic mass 130.
Fig. 5
Fig. 5. An overview of post-Archean atmospheric evolution in the context of biological evolution and constraints on mean global temperature in the Archean (see text) in the context of the glacial record.
(A) Uncertainties on gas concentrations are a factor of a few or more as detailed in Table 1, the text, and the other figures. Dinitrogen may have tracked O2 levels due to an oxidative weathering and denitrification source of N2, but pN2 changes are debated. Methane was oxidized as O2 rose but could have been protected subsequently under an ozone layer, depending on post-Archean CH4 source fluxes. The secular decline of CO2 is a feedback effect in the geological carbon cycle induced by decreasing solar luminosity. (B) Constraints on Archean mean global temperature. Vertical blue bars denote that glacial rocks exist, noting that the durations of glaciations in the early Proterozoic and earlier are poorly known. Neoproterozoic and Phanerozoic glaciation ages are from (266, 267). A proposed Mesoproterozoic glaciation (268) is not plotted because its age is disputed and possibly Sturtian (269). Cenozoic glaciations only occur at a global mean temperature below ~20°C. Red arrows on the Archean glaciations are a more conservative 25°C upper limit, taking into account of the possible effects of different land configurations and lack of vegetation. Low CO2 during the Phanerozoic (A) correlates with glaciations (B), such as Carboniferous-Permian ones, 335 to 256 Ma ago. Precambrian greenhouse gases must also have fluctuated, but the amount is unknown and so not reflected in (A).

References

    1. Arney G., Domagal-Goldman S. D., Meadows V. S., Wolf E. T., Schwieterman E., Charnay B., Claire M., Hébrard E., Trainer M. G., The pale orange dot: The spectrum and habitability of hazy archean earth. Astrobiology 16, 873–899 (2016). - PMC - PubMed
    1. Krissansen-Totton J., Olson S., Catling D. C., Disequilibrium biosignatures over Earth history and implications for detecting exoplanet life. Sci. Adv. 4, eaao5747 (2018). - PMC - PubMed
    1. Schirrmeister B. E., Gugger M., Donoghue P. C. J., Cyanobacteria and the great oxidation event: Evidence from genes and fossils. Palaeontology 58, 769–785 (2015). - PMC - PubMed
    1. Catling D. C., Glein C. R., Zahnle K. J., McKay C. P., Why O2 is required by complex life on habitable planets and the concept of planetary “oxygenation time”. Astrobiology 5, 415–438 (2005). - PubMed
    1. Cloud P. E., A working model of the primitive Earth. Am. J. Sci. 272, 537–548 (1972).

LinkOut - more resources