. 2020 Apr 17;48(7):3692-3707.
doi: 10.1093/nar/gkaa150.

Mutation signatures specific to DNA alkylating agents in yeast and cancers

Affiliations

Mutation signatures specific to DNA alkylating agents in yeast and cancers

Natalie Saini et al. Nucleic Acids Res. .

Abstract

Alkylation is one of the most ubiquitous forms of DNA lesions. However, the motif preferences and substrates for the activity of the major types of alkylating agents defined by their nucleophilic substitution reactions (SN1 and SN2) are still unclear. Utilizing yeast strains engineered for large-scale production of single-stranded DNA (ssDNA), we probed the substrate specificity, mutation spectra and signatures associated with DNA alkylating agents. We determined that SN1-type agents preferably mutagenize double-stranded DNA (dsDNA), and the mutation signature characteristic of the activity of SN1-type agents was conserved across yeast, mice and human cancers. Conversely, SN2-type agents preferably mutagenize ssDNA in yeast. Moreover, the spectra and signatures derived from yeast were detectable in lung cancers, head and neck cancers and tumors from patients exposed to SN2-type alkylating chemicals. The estimates of mutation loads associated with the SN2-type alkylation signature were higher in lung tumors from smokers than never-smokers, pointing toward the mutagenic activity of the SN2-type alkylating carcinogens in cigarettes. In summary, our analysis of mutations in yeast strains treated with alkylating agents, as well as in whole-exome and whole-genome-sequenced tumors identified signatures highly specific to alkylation mutagenesis and indicate the pervasive nature of alkylation-induced mutagenesis in cancers.


Figures

Figure 1.
Figure 1.
Experimental system for identifying mutation signatures in yeast ssDNA and dsDNA. (A) The experimental design in yeast to obtain DNA damage-specific mutation spectra in ssDNA and dsDNA. The three mutation reporters URA3, ADE2 and CAN1 were placed in the subtelomeric region of ChrV. The yeast strains carried the ts cdc13-1 allele. Upon shift to 37°C, telomeres are uncapped and resection exposes ssDNA at the chromosome ends. Treatment with the mutagen results in lesion formation (solid black triangles) on exposed DNA bases either in ssDNA or in dsDNA (open circles with base annotated). An example of lesion formation in adenines is shown here. Resynthesis of the telomeres on shifting cultures to permissive temperature (23°C) results in mutations (solid circles with the base substitution annotated) in ssDNA due to the lack of repair in ssDNA. An example of A→G changes due to lesion bypass is shown here. On the other hand, damage in dsDNA can be repaired and results in a lower number of mutations. In ssDNA the mutagenic lesions can be unambiguously annotated to the intact strand during DNA end resection (open triangles), while in dsDNA the lesion may be formed on either strand making it difficult to identify the strand-specificity of the mutation. Mutations that inactivate CAN1 and ADE2 yield CanRAde- (red) yeast colonies, while mutations that only inactivate CAN1 result in formation of CanRAde+ (white) yeast colonies. Solid gray circles depict to capped telomeric ends. (B) CanRAde- mutation frequencies upon treatment with no mutagen, MMS, EMS, MNNG or MNU. For each strain tested, the mean mutation frequency and the standard error of the mean are depicted. Source data is presented in Supplementary Table S1.
Figure 2.
Figure 2.
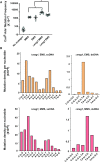
EMS and MMS-induced mutation density in yeast ssDNA and dsDNA. The mutation density for MMS, EMS, MNNG and MNU-induced mutations in (A) ssDNA in (B) dsDNA. Mutation density per nucleotide for ssDNA is calculated as the ratio of number of base substitutions in the DNA strand rendered single stranded per strain and the number of mutable bases in the subtelomeric regions. For dsDNA, the mutation density per base pair is calculated as the number of base substitutions in mid-chromosome regions per sequenced strain versus the number of mutable base pairs in mid-chromosome regions (Supplementary Table S3).
Figure 3.
Figure 3.
CanRAde- mutation frequencies and spectra in Δmag1 yeast strains. (A) CanRAde- mutation frequencies in wild-type or Δmag1 strains treated with MMS or EMS. * denotes P-values < 0.05 for an unpaired t-test comparing the mutation frequencies in the wild-type and Mag1-deficient strains. Data are presented in Supplementary Table S1. (B) The mutation density for MMS or EMS-induced mutations in ssDNA and dsDNA in Δmag1 strains. The source data for this figure is presented in Supplementary Table S3.
Figure 4.
Figure 4.
CanRAde- mutation frequencies, genome-wide mutation load and spectra in wild-type isolates and TLS mutant strains. (A) CanRAde- mutation frequencies in wild-type, and TLS mutant strains treated with no mutagen, MMS or EMS. The mean and standard error of the mean for the mutation frequencies is shown (Supplementary Table S1). An unpaired t-test was used to compare the mutation frequencies in wild-type strains and TLS-deficient strains. * denotes P-value < 0.05, ** denotes P-values < 0.001. (B) The mutation loads in subtelomeric (subtel) and mid-chromosome (mid-chr) regions of the genome in wild-type or rev1AA yeast strains treated with MMS or EMS (Supplementary Table S2). The median number of mutations in the strains are denoted with the black rectangle, and the error bars indicate the 95% confidence intervals. A Mann–Whitney U-test was performed to determine if the increase in mutation loads in rev1AA yeast strains were statistically relevant. For samples with statistically significant increase, the resulting P-value is depicted on the graph. (C) The spectra for base substitutions in cytosines and adenines in ssDNA are provided for WGS wild-type and rev1AA strains treated with MMS and for the reporter region sequenced in Δrad30 strains (Supplementary Table S3). A one-sided Fisher's exact test was performed to test the hypothesis that the ratio of C to G substitutions versus other substitutions in cytosines would be lower in rev1AA strains as compared to the wild-type strains and the ratio of A to G substitutions versus other substitutions in adenines would be lower in rev1AA strains than the wild-type strains treated with MMS. The resulting P-values for mutations in cytosines in rev1AA strains is 0.03 and for the mutations in adenines is 0.0011. The P-values for mutations in cytosines in the Δrad30 isolates is <0.0001 and for adenines is 0.178.
Figure 5.
Figure 5.
Mutation signatures associated with SN1-type alkylation in yeast, mice and cancers. (A) PLogo graphical output depicting the +1 and −1 base preference for mid-chromosome C→T changes in EMS-treated yeast strains. The red line at log odds of the binomial probability ±2.5 indicates P-value < 0.05. (B) The enrichment for C→T changes in the aCy motif or in the bCy motif, where ‘b’ denotes c, t or g. The enrichment values are provided for yeast strains treated with EMS (EMS yeast), MNNG (MNNG yeast), MNU (MNU yeast), hypermutated glioblastomas treated with temozolomide (TMZ GBM), mouse embryonic fibroblasts treated with MNNG (MNNG MEFs) and mouse lung tumors treated with MNU (MNU mouse lung tumors). * denotes P< 0.05 for a Breslow Day test for comparison of odds ratios for the two signatures in each cohort (Supplementary Tables S5 and 6). (C) Comparison between the enrichment values of the UV-specific mutation signature (yCn→yTn) and the temozolamide (SN1-type alkylation damage)-induced mutation signatures (nCy→nTy and aCy→aTy) in melanomas. The enrichment for the specified mutation signatures was obtained for each whole exome sequenced melanoma sample in The Cancer Genome Atlas (TCGA) (Supplementary Table S7). Correlation between the two signatures was determined by a two-sided Pearson correlation analysis.
Figure 6.
Figure 6.
Transcription associated strand-bias for A→T and A→G mutations. (A) A pictorial representation of transcription bubbles originating from a bidirectional promoter (black circle, BDP). The transcripts are portrayed as black lines originating from the RNA polymerase machinery (orange circles). Lesions accumulated in the non-transcribed strand are denoted as red stars. (B) The distribution of A→T or A→G changes around a BDP in cancers. The red dots indicated the number of A→T or A→G changes per kb. The blue dots indicate T→A or T→C changes per kb. The X-axis denotes the distance from the center of the BDP (denoted as 0). The number of mutations per kb are plotted up to 20 kb to the right (20000 on the X-axis) and up to 20 kb to the left (−20000 on the X-axis) of the BDP. The cancer cohorts shown here are—LUAD, LUSC and HNSC. The analysis for other TCGA whole exome and WGS samples are present in Supplementary Table S8. P-values are calculated using a Fisher's exact test predicting that mutations in thymines are more to the left of the BDP than to the right of the BDP, while mutation loads in adenines are higher to the right of the BDP than to the left. (C) Exome-wide transcriptional strand-bias for A→G and A→T mutations cancers. * denote P-values < 0.01 as determined by a binomial test to assess the prediction that mutations in adenines are prevalent on the non-transcribed strand. Only data from LUAD, LUSC and HNSC cohorts from TCGA and cholangiocarcinomas from individuals exposed to 1,2-DCP (Chol) are shown here. The analysis for other TCGA tumors is present in Supplementary Table S9.
Figure 7.
Figure 7.
Mutation signatures associated with SN2-type DNA alkylation in yeast, and cancers. (A) PLogo shows an overrepresentation of G in the +1 position of T→G changes (fixed position) induced by MMS in ssDNA in yeast. The red line at log odds of the binomial probability ±2.5 indicates P-value < 0.05. (B) Enrichment values for T→G changes in the hTg motif (h denotes a, t or c) in yeast strains treated with MMS, EMS, MNU, MNNG or no mutagen. The * denotes P-values < 0.05 (see ‘Materials and Methods’ section). (C) The enrichment and minimum mutation load for hTg→hGg changes in WGS cancers. Each pie chart represents WGS samples from a given TCGA cohort. The colors indicate hTg→hGg fold enrichment. Samples with hTg→hGg enrichment < 1 or with Benjamini-Hoechberg corrected P-values > 0.05 are represented in black and are excluded from the scatter graph below. The scatter graph depicts the minimum mutation loads for hTg→hGg base substitutions in each sample of the represented WGS cancers. In addition to the TCGA samples, the pie chart and scatter graph also depict whole exome sequenced cholangiocarcinoma samples from patients exposed to haloalkanes. (D) The hTg→hGg minimum mutation loads for WGS lung tumors obtained from never-smokers (blue circles) or smokers (red circles). The median values and the 95% confidence intervals are plotted as black lines on the graphs. P-value was calculated using a two-sided Mann–Whitney U test. The data for this figure is presented in Supplementary Table S10.

References

    1. Roberts S.A., Gordenin D.A.. Hypermutation in human cancer genomes: footprints and mechanisms. Nat. Rev. Cancer. 2014; 14:786–800. - PMC - PubMed
    1. Alexandrov L.B., Nik-Zainal S., Wedge D.C., Aparicio S.A., Behjati S., Biankin A.V., Bignell G.R., Bolli N., Borg A., Borresen-Dale A.L. et al. .. Signatures of mutational processes in human cancer. Nature. 2013; 500:415–421. - PMC - PubMed
    1. Saini N., Gordenin D.A.. Somatic mutation load and spectra: A record of DNA damage and repair in healthy human cells. Environ. Mol. Mutagen. 2018; 59:672–686. - PMC - PubMed
    1. Roberts S.A., Sterling J., Thompson C., Harris S., Mav D., Shah R., Klimczak L.J., Kryukov G.V., Malc E., Mieczkowski P.A. et al. .. Clustered mutations in yeast and in human cancers can arise from damaged long single-strand DNA regions. Mol. Cell. 2012; 46:424–435. - PMC - PubMed
    1. Sakofsky C.J., Roberts S.A., Malc E., Mieczkowski P.A., Resnick M.A., Gordenin D.A., Malkova A.. Break-induced replication is a source of mutation clusters underlying kataegis. Cell Rep. 2014; 7:1640–1648. - PMC - PubMed

Publication types