Review
. 2020 Jun;25(6):435-441.
doi: 10.1111/nep.13706. Epub 2020 Mar 27.

Where to look for the most frequent biases?

Affiliations
Review

Where to look for the most frequent biases?

Kitty J Jager et al. Nephrology (Carlton). 2020 Jun.

Abstract

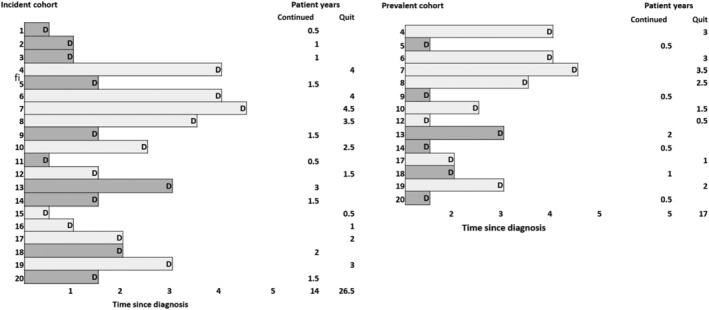
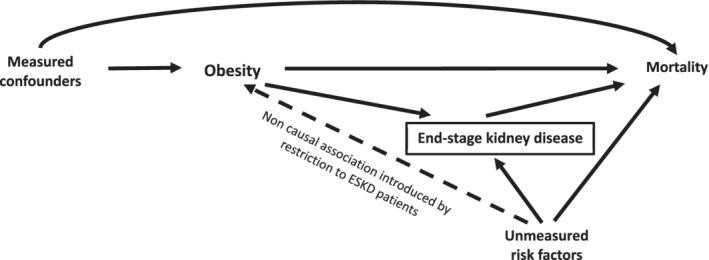
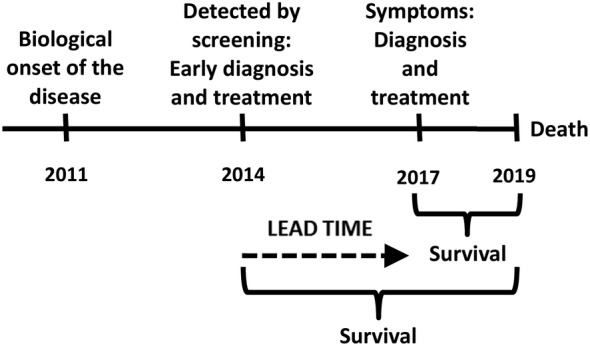
Study quality depends on a number of factors, one of them being internal validity. Such validity can be affected by random and systematic error, the latter also known as bias. Both make it more difficult to assess a correct frequency or the true relationship between exposure and outcome. Where random error can be addressed by increasing the sample size, a systematic error in the design, the conduct or the reporting of a study is more problematic. In this article, we will focus on bias, discuss different types of selection bias (sampling bias, confounding by indication, incidence-prevalence bias, attrition bias, collider stratification bias and publication bias) and information bias (recall bias, interviewer bias, observer bias and lead-time bias), indicate the type of studies where they most frequently occur and provide suggestions for their prevention.

Keywords: bias; epidemiologic methods; research design; research methodology.


Conflict of interest statement

We have no conflict of interest to report.

Figures

Figure 1
Figure 1
Incidence‐prevalence bias in assessing the mortality in patients diagnosed with severe emphysema in cohorts of incident and prevalent patients. The dark bars represent those who continued smoking after diagnosis and the light bars represent those who quit smoking after diagnosis. In the incident cohort, the observation period starts at diagnosis, whereas in the prevalent cohort it starts 1 year after diagnosis. D denotes death
Figure 2
Figure 2
Directed acyclic graph showing how the obesity paradox in patients with end‐stage kidney disease (ESKD) can possibly be explained by collider stratification bias. Measured confounders affecting mortality may include covariates like age and sex. Unmeasured risk factors may include risk factors that can be considered as a common cause for ESKD and mortality (eg, genetic or lifestyle factors) and that often go unmeasured. Restriction to ESKD patients induces collider stratification bias (ESKD being the collider) by introducing a non‐causal association between obesity and the unmeasured risk factors. This non‐causal pathway distorts the obesity‐mortality relationship by introducing confounding by the unmeasured risk factors and may be responsible for the seemingly protective effect of obesity in ESKD
Figure 3
Figure 3
Example of a funnel plot. The precision of each study is plotted against its effect estimate. Larger dots represent larger studies. The vertical line is drawn through the overall pooled estimate of effect to detect symmetry or asymmetry. In this plot the right lower side seems emptier which indicates that small studies are missing pointing to some degree of publication bias
Figure 4
Figure 4
Lead‐time bias. Often diseases are diagnosed at the onset of symptoms; sometimes they are diagnosed earlier at screening before causing any symptoms. Should this patient have been screened and diagnosed with the disease in 2014 when still asymptomatic, whereas otherwise he would be diagnosed in 2017 at the onset of symptoms, his survival would have appeared to be 5 years instead of 2 years. The difference of 3 years is called ‘lead‐time’

Similar articles

Cited by

References

    1. Porta M, Greenland S, Hernãn S. In: Silva dos SI, Last M, eds. A dictionary of epidemiology. 6th ed. New York: Oxford University Press; 2014.
    1. Rothman KJ. Epidemiology. An Introduction, New York: Oxford University Press; 2002:20‐21.
    1. Delgado‐Rodríguez M. Bias. J Epidemiol Community Health. 2004;58:635‐641. - PMC - PubMed
    1. Brück K, Jager KJ, Dounousi E, et al. European CKD burden consortium. Methodology used in studies reporting chronic kidney disease prevalence: a systematic literature review. Nephrol Dial Transplant. 2015;30(Suppl 4):iv6‐iv16. - PMC - PubMed
    1. Catalogue of Bias Collaboration , Aronson JK, Bankhead C, Mahtani KR, Nunan D. Confounding by indication. In Catalogue of Biases. 2018. https://catalogofbias.org/biases/confounding-by-indication