

Hippocampal CD39/ENTPD1 promotes mouse depression-like behavior through hydrolyzing extracellular ATP
- PMID: 32133764
- PMCID: PMC7132197
- DOI: 10.15252/embr.201947857
Hippocampal CD39/ENTPD1 promotes mouse depression-like behavior through hydrolyzing extracellular ATP
Abstract
Emerging evidence implicates that low levels of ATP in the extracellular space may contribute to the pathophysiology of major depressive disorder (MDD). The concentration of extracellular ATP is regulated by its hydrolase ectonucleotide tri(di)phosphohydrolase (ENTPD). However, the role of ENTPD in depression remains poorly understood. Here we examine the role of CD39 (known as ENTPD1) in mouse depression-like behavior induced by chronic social defeat stress (CSDS). We demonstrate that CSDS enhances the expression and activity of CD39 in hippocampus. The CD39 functional analog apyrase also induces depression-like behavior, which can be ameliorated by ATP replenishment. Pharmacological inhibition and genetic silencing of CD39 has an antidepressant-like effect via increasing hippocampal extracellular ATP concentration, accompanied with an increase in hippocampal neurogenesis and dendritic spine numbers in defeated mice. These results suggest that hippocampal CD39 contributes to CSDS-induced depression-like behavior via hydrolyzing extracellular ATP, indicating that CD39 may be a promising new target for the treatment of depression.
Keywords: ATP; CSDS; CD39; neurogenesis; spine.
© 2020 The Authors.
Conflict of interest statement
The authors declare that they have no conflict of interest.
Figures
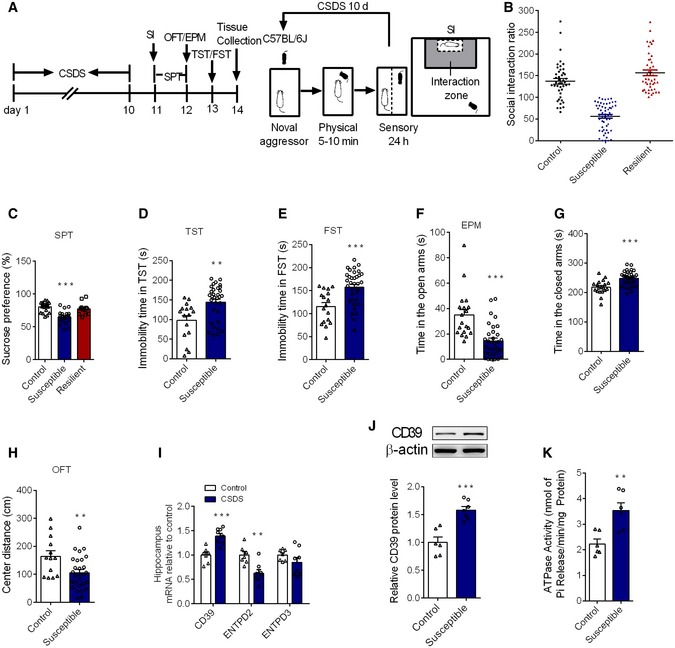
- A
Time‐line of experiment procedures in the chronic social defeat stress.
- B
Social interaction ratio in control, susceptible, and resilient mice following the CSDS protocol (n = 44, 55, 44 mice).
- C
Sucrose preference in control, susceptible, and resilient mice (n = 20, 20, 12 mice; Treatment F 2,49 = 16.05, P < 0.0001, one‐way ANOVA with Fisher's LSD test).
- D
The immobility time in TST in susceptible mice, compared to control mice (n = 16, 32 mice; susceptible versus control, P = 0.002, Student's t‐test).
- E
The immobility time in FST in susceptible mice, compared to control mice (n = 17, 35 mice; susceptible versus control, P = 0.0003, Student's t‐test).
- F, G
The time in the open arms (F) and closed arms (G) in the EPM in susceptible mice, compared to control mice (n = 19, 33 mice; susceptible versus control, for open arms, P < 0.0001; for closed time, P < 0.0001, Student's t‐test).
- H
The central distance in the OFT in susceptible mice, compared to control mice (n = 13, 28 mice; susceptible versus control, P = 0.0089, Student's t‐test).
- I
The mRNA level of CD39, ENTPD2, and ENTPD3 in the hippocampus of susceptible mice after CSDS (n = 7, 8 mice; CSDS versus control, CD39 P = 0.0002, ENTPD2 P = 0.0025, Student's t‐test).
- J
The CD39 protein expression in the hippocampus of susceptible mice induced by CSDS (n = 6, 7 mice; CSDS versus control, P = 0.0003, Student's t‐test).
- K
The ATPase activity in the hippocampus of stressed animals (n = 6 mice/group; CSDS versus control, P = 0.0041, Student's t‐test).

The CD39 mRNA level in the hippocampus of resilient mice exposure to CSDS (n = 5, 4 mice; resilient versus control, P = 0.1888, Student's t‐test).
The expression of CD39 protein in the hippocampus of resilient mice exposure to CSDS (n = 4 mice/group; resilient versus control, P = 0.4403, Student's t‐test).
The ATP level in the hippocampus of resilient mice exposure to CSDS (n = 4 mice/group; resilient versus control, P = 0.5084, Student's t‐test).
The CD39 mRNA level in the mPFC of susceptible mice after CSDS (n = 8 mice/group; CSDS versus control, P = 0.8592, Student's t‐test).
The expression of CD39 protein in the mPFC of susceptible mice induced by CSDS (n = 11 mice/group; CSDS versus control, P = 0.1194, Student's t‐test).
The ATPase activity in the mPFC of stressed mice (n = 5, 6 mice; CSDS versus control, P = 0.2827, Student's t‐test).
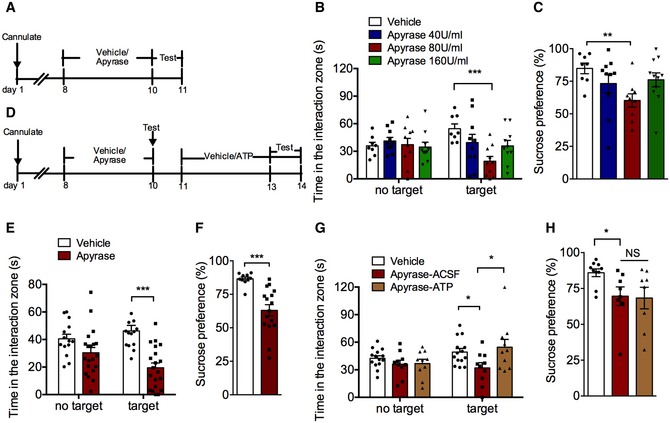
Experimental timelines for apyrase administration and behavioral study.
The effects of apyrase (40, 80, and 160 U/ml) infusion into cerebral ventricle on social interaction time (n = 8, 10, 10, 10 mice; Interaction F 3,34 = 3.917, P = 0.0167; Target F 1,34 = 0.0004, P = 0.9834; Drug F 3,34 = 2.295, P = 0.0954; for target, Apyrase 80 U/ml versus control, P = 0.0008, two‐way ANOVA with Tukey's post‐test).
The effects of apyrase (40, 80, and 160 U/ml) infusion into cerebral ventricle on sucrose preference (n = 8, 10, 9, 11 mice; Treatment F 3,34 = 2.87, P = 0.0505; Apyrase 80 U/ml versus control, P = 0.007, one‐way ANOVA with Fisher's LSD test).
Experimental timelines for apyrase/ATP administration and behavioral tests.
The effect of apyrase (40 U/ml) infusion into hippocampal on the social interaction time (n = 14, 20 mice; Interaction F 1,32 = 7.0754, P = 0.0121; Target F 1,32 = 0.68447, P = 0.4142; Drug F 1,32 = 18.211, P = 0.0002; Apyrase versus control, P < 0.0001, Student's t‐test).
The effect of apyrase (40 U/ml) infusion into hippocampal on the sucrose preference (n = 10, 16 mice; Apyrase versus control, P = 0.0003, Student's t‐test).
The social avoidance behavior in mice with ATP intra‐hippocampal infusion after apyrase exposure (n = 14, 10, 10 mice; Interaction F 2,31 = 2.051, P = 0.1457; Target F 1,31 = 2.666, P = 0.1127; Drug F 2,31 = 3.711, P = 0.0359; for Target, Apyrase‐ACSF versus Vehicle, P = 0.0387; Apyrase‐ATP versus Apyrase‐ACSF, P = 0.0099, two‐way ANOVA with Tukey's post‐test).
The sucrose preference in mice with ATP intra‐hippocampal infusion after apyrase exposure (n = 10, 8, 8 mice; Treatment F 2,23 = 3.32, P = 0.0540; Apyrase‐ACSF versus Vehicle, P = 0.0466, one‐way ANOVA with Fisher's LSD test).
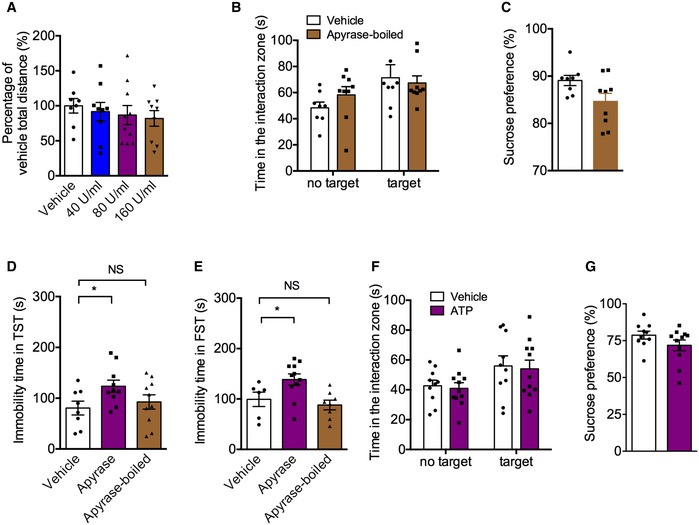
- A
The locomotor activity of mice with apyrase (40, 80, or 160 U/ml) infusion into lateral intracerebroventricular in the open field test (n = 8, 9, 10, 9 mice; Treatment F 3,32 = 0.37, P = 0.7757, one‐way ANOVA with Fisher's LSD test).
- B, C
Social interaction time (B) and sucrose preference (C) of mice with inactivated apyrase infusion into hippocampus (n = 8, 9 mice; for SI, Interaction F 1,30 = 1.039, P = 0.3162; Drug F 1,30 = 5.591, P = 0.0247; Target F 1,30 = 0.1890, P = 0.6669, two‐way ANOVA with Tukey's post‐test; for SPT, P = 0.0517, Student's t‐test).
- D, E
Immobility time in the TST (D) and FST (E) of mice with apyrase and boiled‐apyrase (for TST, n = 8, 10, 10 mice; Treatment F 2,25 = 2.766, P = 0.0822; Apyrase versus vehicle, P = 0.0348; Apyrase‐boiled versus vehicle, P = 0.5386; for FST, n = 6, 11, 8 mice; Treatment F 2,22 = 5.92, P = 0.0088; Apyrase versus vehicle, P = 0.0307; Apyrase‐boiled versus vehicle, P = 0.5414, one‐way ANOVA with Fisher's LSD test).
- F, G
Social interaction time (F) and sucrose preference (G) of normal mice with ATP (25 μM) infusion into hippocampus (n = 10, 11 mice; for SI, Interaction F 1,38 = 0.0005723, P = 0.9810; Drug F 1,38 = 6.520, P = 0.0148; Target F 1,38 = 0.1280, P = 0.7225, two‐way ANOVA with Tukey's post‐test; for SPT, P = 0.1484, Student's t‐test).
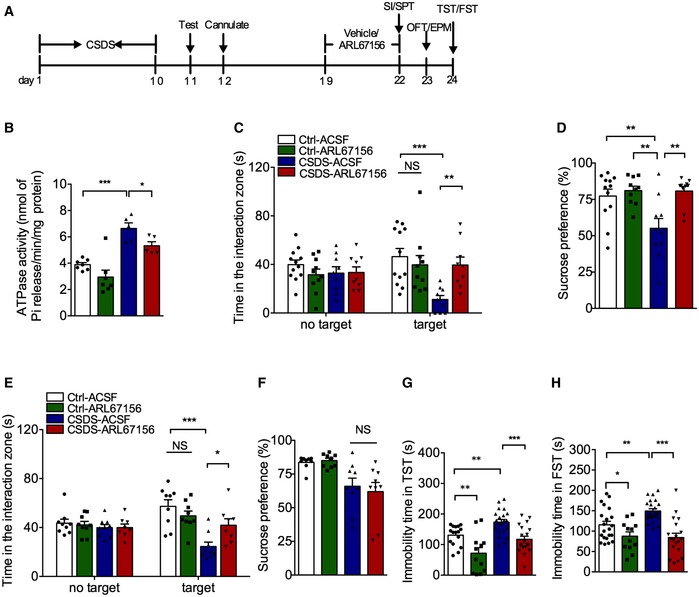
- A
Experimental timelines for CSDS, ARL67156 administration, and behavioral study.
- B
The ATPase activity of mice exposure to ARL67156 (n = 7, 7, 5, 5 mice; Treatment F 3,20 = 16.81, P < 0.0001; CSDS – ACSF versus Ctrl – ACSF, P < 0.0001; CSDS – ARL67156 versus CSDS – ACSF, P = 0.0405, one‐way ANOVA with Fisher's LSD test).
- C
The social avoidance behavior of susceptible mice with intracerebroventricular infusion of ARL67156 (n = 12, 10, 9, 9 mice; Interaction F 3,36 = 5.119, P = 0.0047; Target F 1,36 = 0.005, P = 0.9437; Drug F 3,36 = 3.626, P = 0.022; for Target, CSDS – ACSF versus Ctrl ‐ACSF, P = 0.0001; CSDS – ARL67156 versus CSDS – ACSF, P = 0.0054, two‐way ANOVA with Tukey's post‐test).
- D
The sucrose preference of susceptible mice with intracerebroventricular infusion of ARL67156 (n = 12, 10, 10, 10 mice; Interaction F 1,38 = 5.352, P = 0.0262; Group F 1,38 = 5.711, P = 0.0219; Drug F 1,38 = 9.703, P = 0.0035; CSDS – ACSF versus Ctrl – ACSF, P = 0.0083; Ctrl – ARL67156 versus CSDS – ACSF, P = 0.0027; CSDS – ARL67156 versus CSDS – ACSF, P = 0.0031, two‐way ANOVA with Tukey's post‐test).
- E, F
The social avoidance behavior (E) and sucrose preference (F) in mice with intra‐hippocampal infusion of ARL67156 after CSDS (n = 9, 9, 9, 8 mice; for social behavior, Interaction F 3,31 = 5.579, P = 0.0035; Target F 1,31 = 0.5121, P = 0.4796; Drug F 3,31 = 8.367, P = 0.0003; CSDS – ACSF versus Ctrl – ACSF, P < 0.0001; CSDS – ARL67156 versus CSDS – ACSF, P = 0.0131; sucrose, Interaction F 1,30 = 0.3342, P = 0.5675; Group F 1,30 = 17.22, P = 0.0003; Drug F 1,30 = 0.05903, P = 0.8097; CSDS‐ ACSF versus Ctrl – ACSF, P = 0.0761, two‐way ANOVA with Tukey's post‐test).
- G
The immobility time in the TST of mice with intra‐hippocampal infusion of ARL67156 after CSDS (n = 16, 12, 21, 19 mice; Treatment F 3,64 = 13.61, P < 0.0001; CSDS – ACSF versus Ctrl – ACSF, P = 0.0059; Ctrl – ARL67156 versus Ctrl – ACSF, P = 0.0011; CSDS – ARL67156 versus CSDS – ACSF, P = 0.0002, one‐way ANOVA with Fisher's LSD test).
- H
The immobility time in the FST with intra‐hippocampal infusion of ARL67156 after CSDS (n = 21, 12, 23, 19 mice; Treatment F 3,71 = 12.94, P < 0.0001; CSDS – ACSF versus Ctrl – ACSF, P = 0.0036; Ctrl – ARL67156 versus Ctrl – ACSF, P = 0.0428; CSDS – ARL67156 versus CSDS – ACSF, P < 0.0001, one‐way ANOVA with Fisher's LSD test).
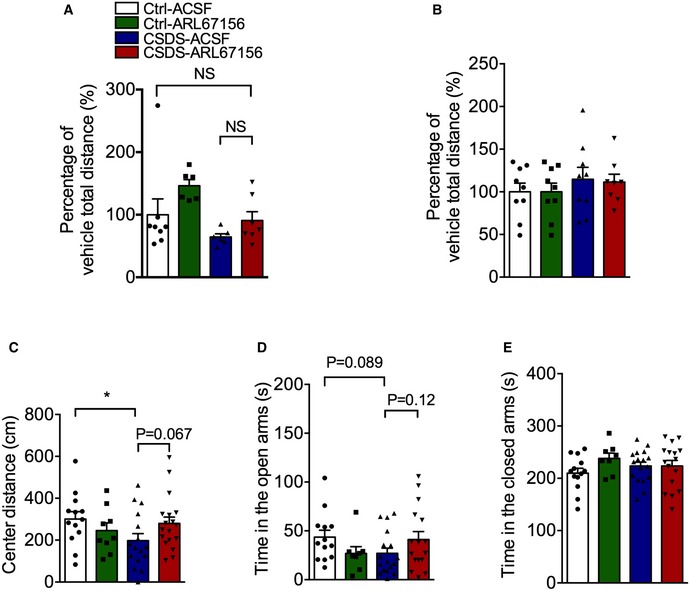
- A
The locomotor activity of susceptible mice with ARL67156 (100 μM) infusion into the right cerebral ventricle in the open field test (n = 8, 6, 6, 7 mice; Interaction F 1,23 = 0.3174, P = 0.5786; Group F 1,23 = 6.619, P = 0.0170; Drug F 1,23 = 4.226, P = 0.0513, two‐way ANOVA with Tukey's post‐test).
- B
The locomotor activity of mice with ARL67156 (100 μM) infusion into the hippocampus in the open field test (n = 9, 9, 9, 8 mice; Interaction F 1,31 = 0.1670, P = 0.6856; Group F 1,31 = 0.8477, P = 0.3643; Drug F 1,31 = 0.01314, P = 0.9095, two‐way ANOVA with Tukey's post‐test).
- C
The distance spent in center zone of stressed mice with ARL67156 (100 μM) in the OFT (n = 13, 9, 16, 18 mice; Treatment F 3,52 = 1.880, P = 0.1444; CSDS – ACSF versus Ctrl – ACSF, P = 0.0346; CSDS – ARL67156 versus CSDS – ACSF, P = 0.0671, one‐way ANOVA with Fisher's LSD test).
- D, E
The anxiety behaviors of stressed mice with ARL67156 (100 μM) accessing by the open arms (D) and the closed arms (E) in the EPM test (n = 13, 8, 17, 16 mice; for the open arms, Treatment F 3,50 = 1.569, P = 0.2086; CSDS – ACSF versus Ctrl – ACSF, P = 0.0891; CSDS – ARL67156 versus CSDS – ACSF, P = 0.1234; for the closed arms, Treatment F 3,50 = 1.063, P = 0.3731, one‐way ANOVA with Fisher's LSD test).
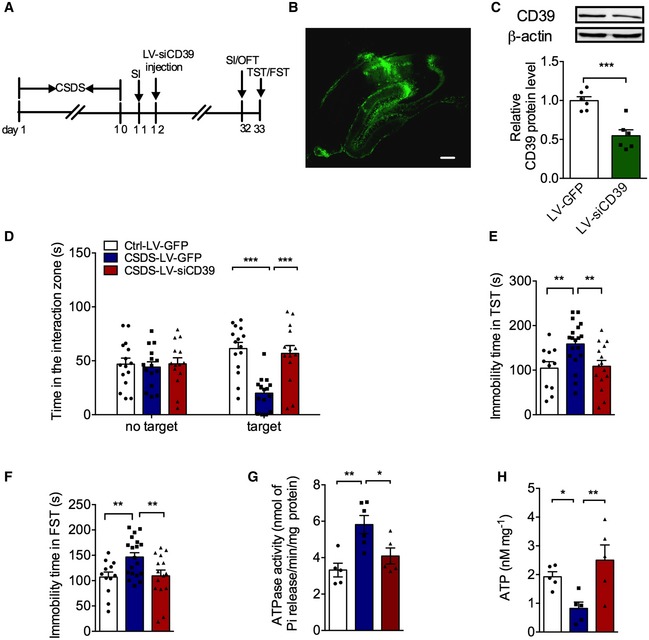
Experimental timelines for CSDS, virus stereotaxic injections, and behavioral study.
Imaging of GFP expression in the hippocampus 3 weeks after virus vector injection. Scale bar: 250 μm.
Expression of CD39 in the hippocampus of mice injected with LV‐siCD39 (n = 6 mice/group; LV‐siCD39 versus Control, P = 0.0006, Student's t‐test).
The social avoidance behavior for the stressed mice after knocking down CD39 (n = 15, 15, 14 mice; Interaction F 2,41 = 17.96, P < 0.0001; Target F 1,41 = 3.75e‐005, P = 0.9951; Drug F 2,41 = 6.099, P = 0.0048; for Target, CSDS – LV‐GFP versus Ctrl – LV‐GFP, P < 0.0001; CSDS – LV‐siCD39 versus CSDS – LV‐GFP, P < 0.0001, two‐way ANOVA with Tukey's post‐test).
The immobility time in the TST of mice injected with LV‐ siCD39 (n = 11, 19, 15 mice; Treatment F 2,42 = 5.807, P = 0.0059; CSDS – LV‐GFP versus Ctrl – LV‐GFP, P = 0.0069; CSDS – LV‐siCD39 versus CSDS – LV‐GFP, P = 0.0065, one‐way ANOVA with Fisher's LSD test).
The immobility time spent in the FST of mice treatment with LV‐siCD39 (n = 12, 19, 15 mice; Treatment F 2,43 = 5.237, P = 0.0092; CSDS – LV‐GFP versus Ctrl – LV‐GFP, P = 0.0095; CSDS – LV‐siCD39 versus CSDS – LV‐GFP, P = 0.0093, one‐way ANOVA with Fisher's LSD test).
The ATPase hyperactivity of mice after knocking down CD39 in the hippocampal (n = 5, 6, 5 mice; Treatment F 2,13 = 8.45, P = 0.0044; CSDS – LV‐GFP versus Ctrl – LV‐GFP, P = 0.0016; CSDS – LV‐CD39 versus CSDS – LV‐GFP, P = 0.0166, one‐way ANOVA with Fisher's LSD test).
The ATP level of mice after knocking down CD39 in the hippocampal (n = 5 mice/group; Treatment F 2,12 = 6.04, P = 0.0153; CSDS – LV‐GFP versus Ctrl – LV‐GFP, P = 0.0444; CSDS – LV‐CD39 versus CSDS – LV‐GFP, P = 0.0051, one‐way ANOVA with Fisher's LSD test).
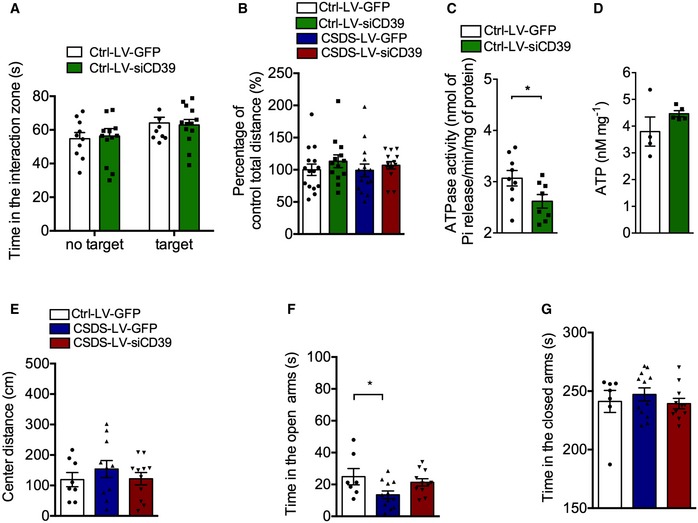
- A
The social interaction time of control mice after knocking down CD39 (n = 10, 13 mice; Interaction F 1,42 = 0.1334, P = 0.7167; Group F 1,42 = 4.366, P = 0.0428; Drug F 1,42 = 0.002565, P = 0.9598, two‐way ANOVA with Tukey's post‐test).
- B
The locomotor activity of mice with LV‐siCD39 infusion into hippocampus in the open field test (n = 15, 13, 15, 14 mice; Interaction F 1,53 = 0.09372, P = 0.7607; Group F 1,53 = 0.1669, P = 0.6845; Drug F 1,53 = 1.450, P = 0.2339, two‐way ANOVA with Tukey's post‐test).
- C
The ATPase activity of control mice with LV‐ siCD39 intra‐hippocampal infusion (n = 9, 8 mice; P = 0.043, Student's t‐test).
- D
The ATP level of control mice with LV‐siCD39 intra‐hippocampal infusion (n = 4, 5 mice; P = 0.2181, Student's t‐test).
- E
The center distance of stressed mice with LV‐siCD39 in the OFT (n = 8, 11, 11 mice; Treatment, F 2,27 = 0.6317, P = 0.5394, one‐way ANOVA with Fisher's LSD test).
- F, G
Time spent in the open arms (F) and closed arms (G) of stressed mice with LV‐siCD39 in EPM test (n = 7, 12, 11 mice; for open arms, Treatment, F 2,27 = 3.650, P = 0.0395; CSDS – LV‐GFP versus Ctrl – LV‐GFP, P = 0.0183; for closed arms, Treatment, F 2,27 = 0.5164, P = 0.6024, one‐way ANOVA with Fisher's LSD test).
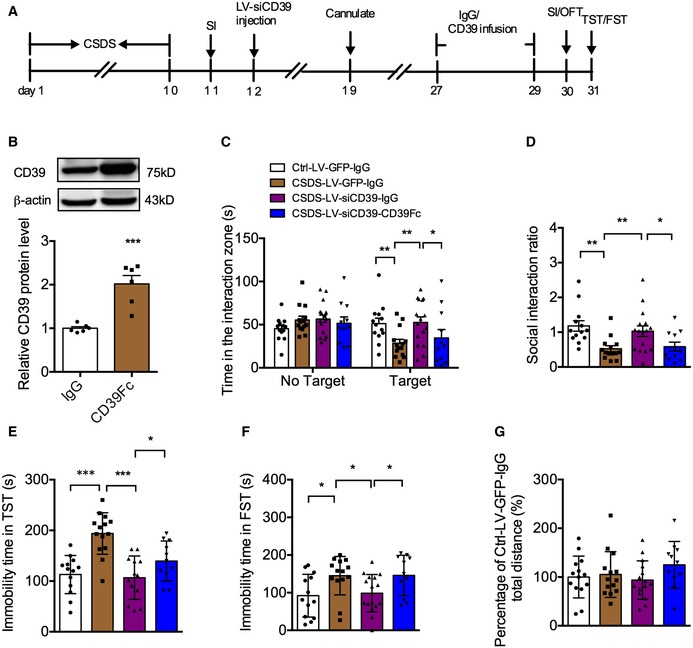
- A
Experimental timelines.
- B
Expression of CD39 in the hippocampus of mice injected with CD200Fc (n = 6 mice/group; CD39Fc versus IgG, P = 0.0004, Student's t‐test).
- C
Time in the interaction zone of mice infusion with CD39Fc after knockdown of CD39 in SI test (n = 13, 14, 16, 11 mice; Interaction, F 3,100 = 2.977, P = 0.0352; Target, F 1,100 = 6.175, P = 0.0146; Drug, F 3,100 = 2.028, P = 0.1148; for target, CSDS‐LV‐GFP‐IgG versus Ctrl‐LV‐GFP‐IgG, P = 0.0077; CSDS‐LV‐siCD39‐IgG versus CSDS‐LV‐GFP‐IgG, P = 0.0031; CSDS‐LV‐siCD39‐CD39Fc versus CSDS‐LV‐siCD39‐IgG, P = 0.0378, two‐way ANOVA with Tukey's post‐test).
- D
Social interaction ratio of mice infusion with CD39Fc after knockdown of CD39 in SI test (n = 13, 14, 16, 11 mice; Treatment, F 3,50 = 5.690, P = 0.0020; CSDS‐LV‐GFP‐IgG versus Ctrl‐LV‐GFP‐IgG, P = 0.0012; CSDS‐LV‐siCD39‐IgG versus CSDS‐LV‐GFP‐IgG, P = 0075; CSDS‐LV‐siCD39‐CD39Fc versus CSDS‐LV‐siCD39‐IgG, P = 0.0263, one‐way ANOVA with Fisher's LSD test).
- E, F
Infusion with CD39Fc into hippocampus abolished the decreased immobility time of stressed mice injection with LV‐siCD39 in the TST (E) and FST (F) (for TST, n = 13, 14, 13, 11; Treatment, F 3,47 = 13.22, P < 0.0001; CSDS‐LV‐GFP‐IgG versus Ctrl‐LV‐GFP‐IgG, P < 0.0001; CSDS‐LV‐siCD39‐IgG versus CSDS‐LV‐GFP‐IgG, P < 0001; CSDS‐LV‐siCD39‐CD39Fc versus CSDS‐LV‐siCD39‐IgG, P = 0.05; for FST, n = 13, 14, 16, 11; Treatment, F 3,50 = 4.047, P = 0.0119; CSDS‐LV‐GFP‐IgG versus Ctrl‐LV‐GFP‐IgG, P = 0.0116; CSDS‐LV‐siCD39‐IgG versus CSDS‐LV‐GFP‐IgG, P = 0191; CSDS‐LV‐siCD39‐CD39Fc versus CSDS‐LV‐siCD39‐IgG, P = 0.0261, one‐way ANOVA with Fisher's LSD test).
- G
Total distance of mice in the OFT (n = 14, 14, 15, 11 mice; Treatment, F 3,50 = 1.136, P = 0.3437, one‐way ANOVA with Fisher's LSD test).
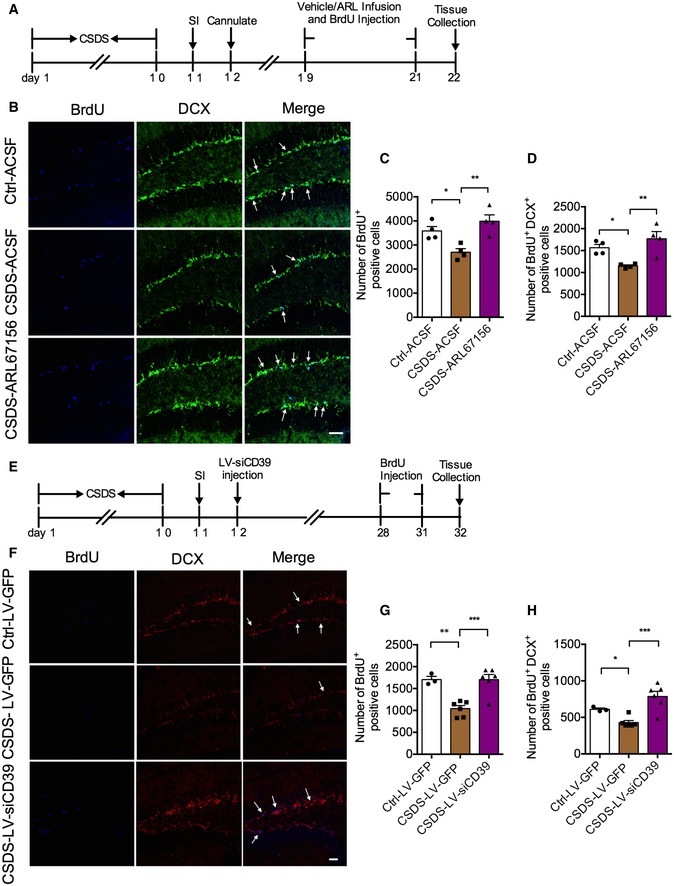
- A
Experimental timelines for CSDS, ARL67156 treatment, and immunostaining.
- B
Immunostaining for BrdU (blue) and DCX (green) in the DG region of control, susceptible, and ARL67156 treatment mice. Arrows indicate the BrdU+ DCX+ cells. Scale bar: 50 μm.
- C, D
Quantification of BrdU+ cells (C) and BrdU+ DCX+ cells (D) in the DG of susceptible mice with ARL67156 compared with vehicle treatment (n = 4 mice/group; for BrdU+ Treatment F 2,9 = 10.07, P = 0.0051; CSDS – ACSF versus Ctrl – ACSF, P = 0.0147; CSDS – ARL67156 versus CSDS – ACSF, P = 0.0018; BrdU+ DCX+ Treatment F 2,9 = 9.005, P = 0.0071; CSDS – ACSF versus Ctrl – ACSF, P = 0.0211; CSDS – ARL67156 versus CSDS – ACSF, P = 0.0024, one‐way ANOVA with Fisher's LSD test).
- E
Experimental timelines for neurogenesis examination with LV‐siCD39.
- F
Confocal images of BrdU (blue) and DCX (red) in mice treatment with LV‐siCD39 in the DG. Arrows indicate the BrdU+ DCX+ cells. Scale bar: 50 μm.
- G, H
Quantitative of BrdU+ (G) and BrdU+ DCX+ (H) cells in the DG of susceptible mice with LV‐siCD39 compared with LV‐GFP treatment (n = 3, 6, 6 mice; for BrdU+ Treatment F 2,12 = 15.79, P = 0.0004; CSDS – LV‐GFP versus Ctrl – LV‐GFP, P = 0.0012; CSDS – LV‐siCD39 versus CSDS – LV‐GFP, P = 0.0003; BrdU+ DCX+ Treatment F 2,12 = 12.79, P = 0.0011; CSDS – LV‐GFP versus Ctrl – LV‐GFP, P = 0.05; CSDS – LV‐siCD39 versus CSDS – LV‐GFP, P = 0.0003, one‐way ANOVA with Fisher's LSD test).

- A
Representative confocal z‐stack images of LV‐infected dendritic segments in the DG granule neurons from control and susceptible mice with different treatment. White arrows indicate stubby spines, yellow arrows indicate mushroom spines, and blue arrows indicate thin spines.
- B–E
Quantification of total (B), stubby (C), mushroom (D), and thin (E) spine density in DG from control and susceptible mice infected with LV‐GFP or LV‐siCD39 (n = 15 segments from 4 mice/group; for total density: Treatment F 2,42 = 3.12, P = 0.0544; Ctrl – LV‐GFP versus CSDS – LV‐siCD39, P = 0.0312; CSDS – LV‐siCD39 versus CSDS – LV‐GFP, P = 0.0425; stubby density: Treatment F 2,42 = 10.93, P = 0.0002; P = 0.0026; CSDS – LV‐CD39 versus CSDS – LV‐GFP, P < 0.0001; mushroom density: Treatment F 2,42 = 0.34, P = 0.7161; thin density: F 2,42 = 1.00, P = 0.3758, one‐way ANOVA with Fisher's LSD test).
- F
Representative confocal z‐stack images of LV‐infected dendritic segments in the DG granule neurons from control and susceptible mice with different treatment. White arrows indicate stubby spines, yellow arrows indicate mushroom spines, and blue arrows indicate thin spines.
- G–J
Quantification of total (G), stubby (H), mushroom (I), and thin (J) spine density in DG from control and susceptible mice treatment with ACSF or ARL67156 (n = 11, 13, 10 segments from 2, 4, 2 mice, respectively; for total density: Treatment F 2,31 = 4.474, P = 0.0196; CSDS – ASCF versus Ctrl – ACSF, P = 0.0366; CSDS – ARL67156 versus CSDS – ACSF, P = 0.0086; stubby density: Treatment F 2,31 = 3.327, P = 0.0491; CSDS – ASCF versus Ctrl – ACSF, P = 0.1026; CSDS – ARL67156 versus CSDS – ACSF, P = 0.0179; mushroom density: Treatment F 2,31 = 1.986, P = 0.1543; thin density: F 2,31 = 1.475, P = 0.2445, one‐way ANOVA with Fisher's LSD test).
Comment in
-
Depression: a new enzyme AT play.EMBO Rep. 2020 Apr 3;21(4):e49921. doi: 10.15252/embr.201949921. Epub 2020 Mar 5. EMBO Rep. 2020. PMID: 32133721 Free PMC article.
-
Comments on Cui Q-Q et al: "Hippocampal CD 39/ENTPD 1 promotes mouse depression-like behavior …".EMBO Rep. 2020 Sep 3;21(9):e50737. doi: 10.15252/embr.202050737. Epub 2020 Aug 12. EMBO Rep. 2020. PMID: 32789954 Free PMC article.
-
Response by the authors.EMBO Rep. 2020 Sep 3;21(9):e51235. doi: 10.15252/embr.202051235. Epub 2020 Aug 12. EMBO Rep. 2020. PMID: 32789986 Free PMC article.
Similar articles
-
Deletion of cd39/entpd1 results in hepatic insulin resistance.Diabetes. 2008 Sep;57(9):2311-20. doi: 10.2337/db07-1265. Epub 2008 Jun 20. Diabetes. 2008. PMID: 18567823 Free PMC article.
-
CD39 limits P2X7 receptor inflammatory signaling and attenuates sepsis-induced liver injury.J Hepatol. 2017 Oct;67(4):716-726. doi: 10.1016/j.jhep.2017.05.021. Epub 2017 May 26. J Hepatol. 2017. PMID: 28554875 Free PMC article.
-
Extracellular ATP inhibits IL-1-induced MMP-1 expression through the action of CD39/nucleotidase triphosphate dephosphorylase-1 on human gingival fibroblasts.Int Immunopharmacol. 2013 Nov;17(3):513-8. doi: 10.1016/j.intimp.2013.07.014. Epub 2013 Aug 11. Int Immunopharmacol. 2013. PMID: 23941770
-
The role of the CD39-CD73-adenosine pathway in liver disease.J Cell Physiol. 2021 Feb;236(2):851-862. doi: 10.1002/jcp.29932. Epub 2020 Jul 10. J Cell Physiol. 2021. PMID: 32648591 Review.
-
Regulatory T cells in transplantation: does extracellular adenosine triphosphate metabolism through CD39 play a crucial role?Transplant Rev (Orlando). 2010 Apr;24(2):52-66. doi: 10.1016/j.trre.2010.01.002. Epub 2010 Feb 11. Transplant Rev (Orlando). 2010. PMID: 20153159 Review.
Cited by
-
Neurodevelopmental Implications Underpinning Hereditary Spastic Paraplegia.CNS Neurosci Ther. 2025 Feb;31(2):e70260. doi: 10.1111/cns.70260. CNS Neurosci Ther. 2025. PMID: 39932116 Free PMC article. Review.
-
Adenosine transmission from hypothalamic tanycytes to AGRP/NPY neurons regulates energy homeostasis.Exp Mol Med. 2025 May;57(5):1047-1063. doi: 10.1038/s12276-025-01449-6. Epub 2025 May 2. Exp Mol Med. 2025. PMID: 40316705 Free PMC article.
-
Emerging roles of dysregulated adenosine homeostasis in brain disorders with a specific focus on neurodegenerative diseases.J Biomed Sci. 2021 Oct 11;28(1):70. doi: 10.1186/s12929-021-00766-y. J Biomed Sci. 2021. PMID: 34635103 Free PMC article. Review.
-
Deficiency of Tet3 in nucleus accumbens enhances fear generalization and anxiety-like behaviors in mice.Brain Pathol. 2022 Nov;32(6):e13080. doi: 10.1111/bpa.13080. Epub 2022 May 25. Brain Pathol. 2022. PMID: 35612904 Free PMC article.
-
Genetic and Pharmacological Inhibition of Astrocytic Mysm1 Alleviates Depressive-Like Disorders by Promoting ATP Production.Adv Sci (Weinh). 2022 Nov 22;10(1):e2204463. doi: 10.1002/advs.202204463. Online ahead of print. Adv Sci (Weinh). 2022. PMID: 36414403 Free PMC article.
References
-
- Trivedi M, Rush AJ, Wisniewski SR, Nierenberg AA, Warden D, Ritz L, Norquist G, Howland RH, Lebowitz B, McGrath PJ et al (2006) Evaluation of outcomes with citalopram for depression using measurement‐based care in STAR*D: implications for clinical practice. Am J Psychiatry 163: 28–40 - PubMed
-
- Cui Y, Yang Y, Ni Z, Dong Y, Cai G, Foncelle A, Ma S, Sang K, Tang S, Li Y et al (2018) Astroglial Kir4.1 in the lateral habenula drives neuronal bursts in depression. Nature 554: 323–327 - PubMed
-
- Nie X, Kitaoka S, Tanaka K, Segi‐Nishida E, Imoto Y, Ogawa A, Nakano F, Tomohiro A, Nakayama K, Taniguchi M et al (2018) The innate immune receptors TLR2/4 mediate repeated social defeat stress‐induced social avoidance through prefrontal microglial activation. Neuron 99: 464–479 - PubMed
-
- Culig L, Surget A, Bourdey M, Khemissi W, Le Guisquet AM, Vogel E, Sahay A, Hen R, Belzung C (2017) Increasing adult hippocampal neurogenesis in mice after exposure to unpredictable chronic mild stress may counteract some of the effects of stress. Neuropharmacology 126: 179–189 - PubMed
Publication types
MeSH terms
Substances
Grants and funding
- IRT13016/PCSIRT/International
- 2017QYTD17/Program for HUST Academic Frontier Youth Team/International
- Integrated Innovative Team for Major Human Diseases Program of Tongji Medical College, HUST/International
- 81721005/National Natural Science Foundation of China/International
- 81473199/National Natural Science Foundation of China/International
LinkOut - more resources
Full Text Sources
Research Materials
