. 2020 Mar;21(3):218-233.
doi: 10.1631/jzus.B1900468.

Inhibition of chemotherapy-related breast tumor EMT by application of redox-sensitive siRNA delivery system CSO-ss-SA/siRNA along with doxorubicin treatment

Affiliations

Inhibition of chemotherapy-related breast tumor EMT by application of redox-sensitive siRNA delivery system CSO-ss-SA/siRNA along with doxorubicin treatment

Xuan Liu et al. J Zhejiang Univ Sci B. 2020 Mar.

Erratum in

Abstract

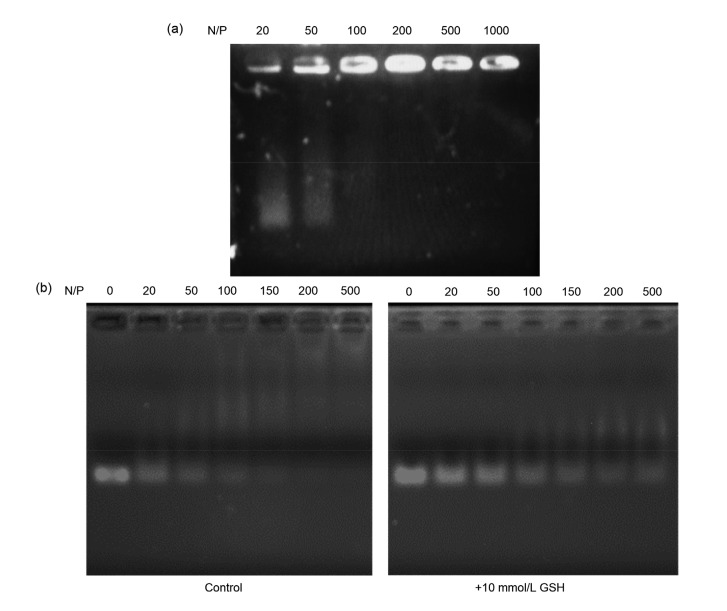
Metastasis is one of the main reasons causing death in cancer patients. It was reported that chemotherapy might induce metastasis. In order to uncover the mechanism of chemotherapy-induced metastasis and find solutions to inhibit treatment-induced metastasis, the relationship between epithelial-mesenchymal transition (EMT) and doxorubicin (DOX) treatment was investigated and a redox-sensitive small interfering RNA (siRNA) delivery system was designed. DOX-related reactive oxygen species (ROS) were found to be responsible for the invasiveness of tumor cells in vitro, causing enhanced EMT and cytoskeleton reconstruction regulated by Ras-related C3 botulinum toxin substrate 1 (RAC1). In order to decrease RAC1, a redox-sensitive glycolipid drug delivery system (chitosan-ss-stearylamine conjugate (CSO-ss-SA)) was designed to carry siRNA, forming a gene delivery system (CSO-ss-SA/siRNA) downregulating RAC1. CSO-ss-SA/siRNA exhibited an enhanced redox sensitivity compared to nonresponsive complexes in 10 mmol/L glutathione (GSH) and showed a significant safety. CSO-ss-SA/siRNA could effectively transmit siRNA into tumor cells, reducing the expression of RAC1 protein by 38.2% and decreasing the number of tumor-induced invasion cells by 42.5%. When combined with DOX, CSO-ss-SA/siRNA remarkably inhibited the chemotherapy-induced EMT in vivo and enhanced therapeutic efficiency. The present study indicates that RAC1 protein is a key regulator of chemotherapy-induced EMT and CSO-ss-SA/siRNA silencing RAC1 could efficiently decrease the tumor metastasis risk after chemotherapy.

Keywords: Doxorubicin; Tumor metastasis; Ras-related C3 botulinum toxin substrate 1 (RAC1); Epithelial-mesenchymal transition (EMT); Chitosan micelles; Small interfering RNA (siRNA).


Conflict of interest statement

Compliance with ethics guidelines: Xuan LIU, Xue-qing ZHOU, Xu-wei SHANG, Li WANG, Yi LI, Hong YUAN, and Fu-qiang HU declare that they have no conflict of interest.

All institutional and national guidelines for the care and use of laboratory animals were followed.

Figures

Fig. 1
Fig. 1
DOX-induced tumor cell invasion and intracellular ROS production (a) Transwell assay of tumor cell invasiveness after DOX·HCl treatment. Scale bar: 200 μm. (b) Intracellular ROS observation of MCF-7 cells exposed to DOX·HCL. ROS is represented by green fluorescence. Scale bar: 50 μm. (c) Evaluation of intracellular ROS by flow cytometry. Values are expressed as mean±standard deviation (SD), n=3. Significant difference in respective groups is indicated at * P<0.05 and *** P<0.001. DOX: doxorubicin; HCl: hydrochloride; ROS: reactive oxygen species; Conc.: concentration
Fig. 2
Fig. 2
Influence of DOX and intracellular ROS on RAC1 expression RAC1 was immunofluorescence stained in MCF-7 cells exposed to DOX·HCl (a) or ROS regulators (b). Cell nucleus is stained blue, and RAC1 is represented in yellow. Scale bar: 50 μm. (c) Quantitative analysis of RAC1 expression level in MCF-7 cells by western blot assay. Values are expressed as mean±standard deviation (SD), n=3. Significant difference in respective groups is indicated at *** P<0.001. DOX: doxorubicin; HCl: hydrochloride; ROS: reactive oxygen species; NAC: N-acetyl-L-cysteine; RAC1: Ras-related C3 botulinum toxin substrate 1
Fig. 3
Fig. 3
Influence of DOX on cellular RAC1 expression and cytoskeleton (a) Regulation of RAC1 induced by a low concentration of DOX on the tumor cytoskeleton. (b) Effects of ROS on RAC1 and cytoskeleton. Cell nucleus is stained blue, RAC1 is represented in yellow, and cytoskeleton is labeled red. Yellow arrow: filopodia; Green arrow: stress fiber; White arrow: pseudopod. Scale bar: 30 μm. DOX: doxorubicin; HCl: hydrochloride; ROS: reactive oxygen species; RAC1: Ras-related C3 botulinum toxin substrate 1; NAC: N-acetyl-L-cysteine
Fig. 4
Fig. 4
Synthesis and structure verification of CSO-ss-SA (a) Synthesis route of CSO-ss-SA. (b) H1 NMR spectrum of CSO-ss-SA and synthetic materials. The peak with a chemical shift of 0.78 ppm (ellipses) was assigned to 0.93 ppm of ‒CH3 on ODA. The peak between 2.20 ppm and 2.80 ppm was attributed to DTPA (small rectangles). CSO-ss-SA: chitosan-ss-stearylamine conjugate; ODA: octadecylamine; DTPA: 2-carboxyethyl disulfide; DCC: N,N'-dicyclohexylcarbodiimide; DMAP: 4-dimethylaminepyridine; EDC: 1-ethyl-3-(3-dimethyl-aminopropyl) carbodiimide hydrochloride; NHS: N-hydroxy succinimide; DMSO: dimethyl sulfoxide; H1 NMR: nuclear magnetic resonance spectroscopy. 1 ppm=1×10⁻⁶
Fig. 5
Fig. 5
Gel electrophoresis assay and GSH-triggered siRNA release of CSO-ss-SA/siRNA complexes (a) Gel electrophoresis assay of CSO-ss-SA/siRNA with a series of N/P ratio. (b) GSH-triggered siRNA release evaluation. The siRNA complexes were pre-incubated with 10 mmol/L GSH for 30 min. CSO-ss-SA/siRNA was unable to retain siRNA in the wells in an environment containing 10 mmol/L GSH. This was significantly different from the control group. CSO-ss-SA/siRNA exhibited redox-sensitive release of siRNA under reducing conditions. N/P: nitrogen to phosphorus; CSO-ss-SA: chitosan-ss-stearylamine conjugate; GSH: glutathione
Fig. 6
Fig. 6
Cellular uptake of CSO-ss-SA/siRNA and regulation of RAC1 and cytoskeleton by CSO-ss-SA/siRNA (a) Cellular uptake of the siRNA complexes. siRNA is green fluorescence. Cell nucleus is blue. Scale bar: 50 μm. (b) Western blot assay for cellular RAC1 expression. (c) Quantitative analysis of (b). Values are expressed as mean±standard deviation (SD), n=3. Significant difference between groups is indicated as ** P<0.01. (d) The regulation of RAC1 and cytoskeleton by siRNA complexes represented by immunofluorescence staining. Cell nucleus is blue, RAC1 is yellow, and cytoskeleton is red. Yellow arrow: filopodia; White arrow: pseudopod. Scale bar: 30 μm. FAM/siRNA: FAM-labeled siRNA complexes; Lipo/FAM-siRNA: Lipofectamine™ 2000/FAM-siRNA complexes; Lipo/siRNA: Lipofectamine™ 2000/siRNA; CSO-ss-SA: chitosan-ss-stearylamine conjugate; RAC1: Ras-related C3 botulinum toxin substrate 1; DOX: doxorubicin; HCl: hydrochloride; n.s.: not significant
Fig. 7
Fig. 7
Cytotoxicity and invasiveness inhibition effect of CSO-ss-SA/siRNA (a) Cytotoxicity of Lipo/siRNA and CSO-ss-SA/siRNA. (b) Cytotoxicity of DOX·HCl combined with CSO-ss-SA/siRNA. (c) Transwell assay of MCF-7 cells exposed to DOX·HCl or DOX·HCl combined with siRNA complexes. Scale bar: 200 μm. (d) Quantitative analysis of results in (c). N: control group; D: DOX·HCl group; C+D: CSO-ss-SA/siRNA+DOX·HCl group; L+D: Lipo/siRNA+DOX·HCl group. Values are expressed as mean±standard deviation (SD), n=3. Significant difference in respective groups is indicated at *** P<0.001. CSO-ss-SA: chitosan-ss-stearylamine conjugate; Lipo/siRNA: Lipofectamine™ 2000/siRNA; DOX: doxorubicin; HCl: hydrochloride
Fig. 8
Fig. 8
Therapy efficiency of CSO-ss-SA/siRNA combined with DOX·HCl in vivo (a) Procedure of animal experiments. An animal model of Balb/c nude mice bearing in situ MCF-7 breast tumor was established (n=5). Drugs were injected via intravenous (i.v.) injection when the tumor volume reached 100 mm3. (b) Tumor inhibition rate calculated by tumor weight. (c) Body weight changing curve of mice during the experiments. (d) Tumor volume changing curve during the experiments. Values are expressed as mean±standard deviation (SD), n=3. Significant difference in respective groups is indicated at *** P<0.001. (e) IHC assay for EMT marker and H&E staining in the tumor tissues. Scale bar: 100 μm. EMT: epithelial-mesenchymal transition; CSO-ss-SA: chitosan-ss-stearylamine conjugate; DOX: doxorubicin; HCl: hydrochloride; IHC: immunohistochemical analysis; H&E: hematoxylin-eosin

Similar articles

Cited by

References

    1. Cadenas S. ROS and redox signaling in myocardial ischemia-reperfusion injury and cardioprotection. Free Radic Biol Med. 2018;117:76–89. doi: 10.1016/j.freeradbiomed.2018.01.024. - DOI - PubMed
    1. Chan TS, Hsu CC, Pai VC, et al. Metronomic chemotherapy prevents therapy-induced stromal activation and induction of tumor-initiating cells. J Exp Med. 2016;213(13):2967–2988. doi: 10.1084/jem.20151665. - DOI - PMC - PubMed
    1. De P, Aske JC, Dey N. RAC1 takes the lead in solid tumors. Cells. 2019;8(5):382. doi: 10.3390/cells8050382. - DOI - PMC - PubMed
    1. Ebos JML. Prodding the beast: assessing the impact of treatment-induced metastasis. Cancer Res. 2015;75(17):3427–3435. doi: 10.1158/0008-5472.can-15-0308. - DOI - PubMed
    1. Fu XD. Both sides of the same coin: Rac1 splicing regulation by EGF signaling. Cell Res. 2017;27(4):455–456. doi: 10.1038/cr.2017.19. - DOI - PMC - PubMed

MeSH terms