Comparative Study
. 2020 Mar 24;59(11):1202-1215.
doi: 10.1021/acs.biochem.0c00092. Epub 2020 Mar 10.

Comparative Analysis of CPI-Motif Regulation of Biochemical Functions of Actin Capping Protein

Affiliations
Comparative Study

Comparative Analysis of CPI-Motif Regulation of Biochemical Functions of Actin Capping Protein

Patrick McConnell et al. Biochemistry. .

Abstract

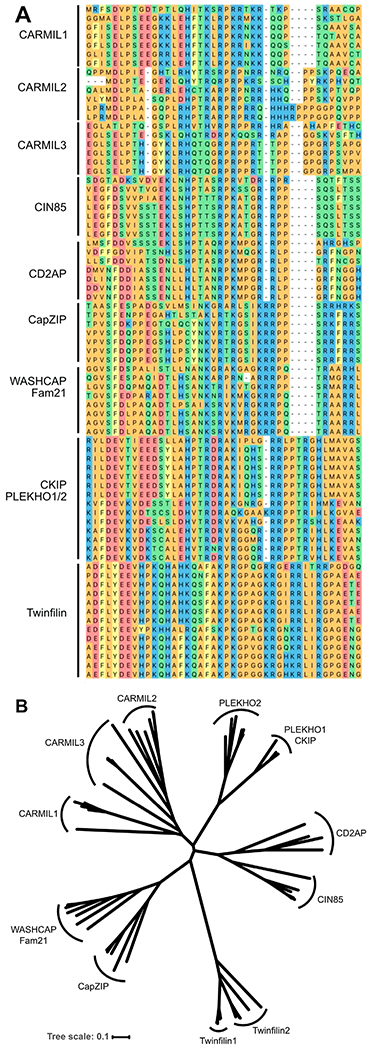
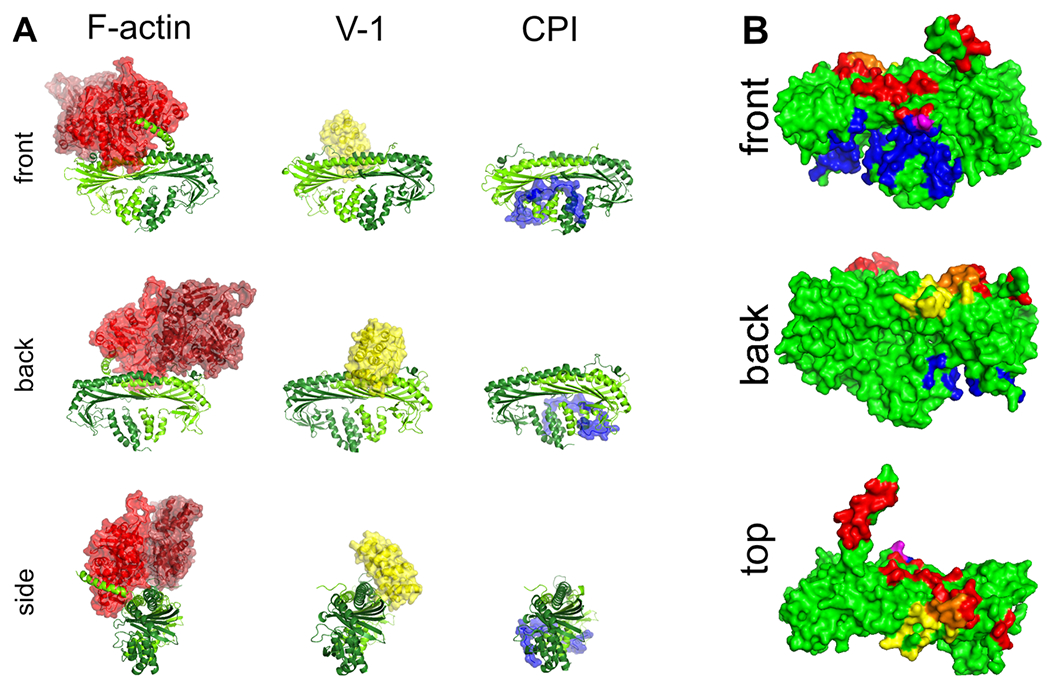
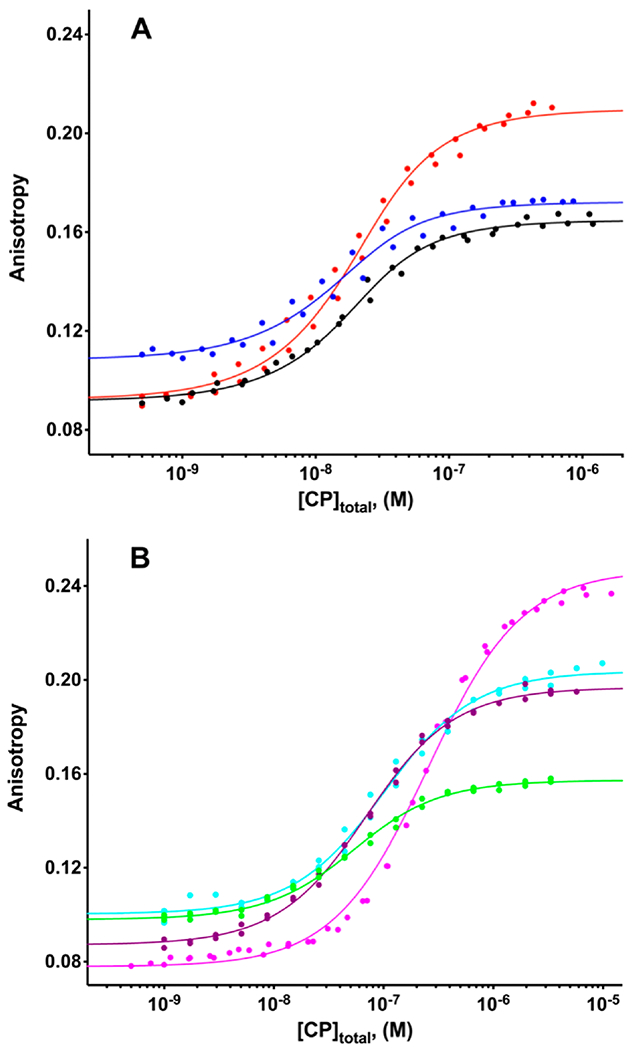
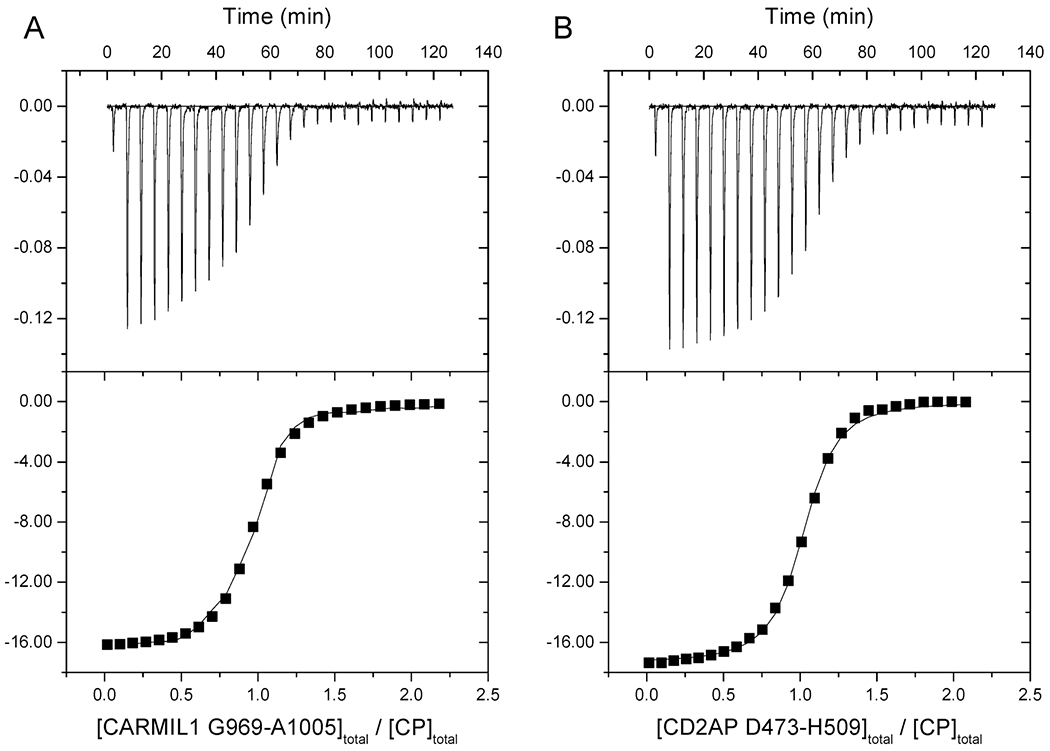
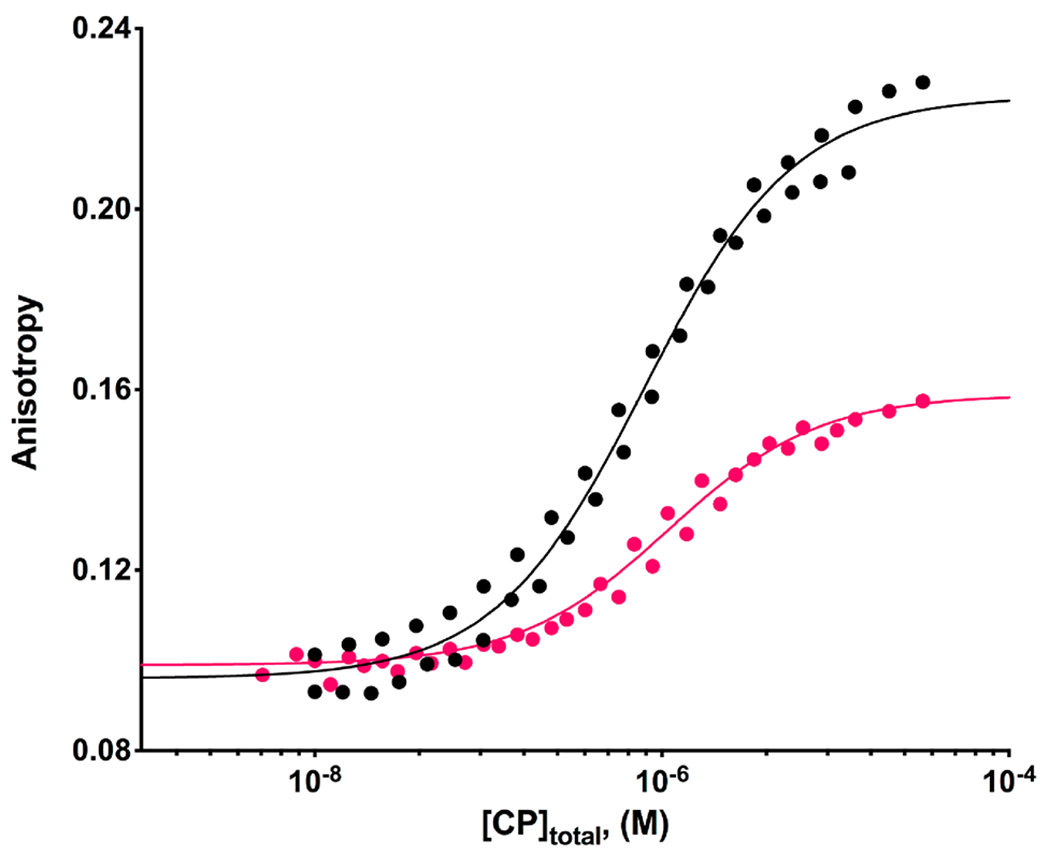
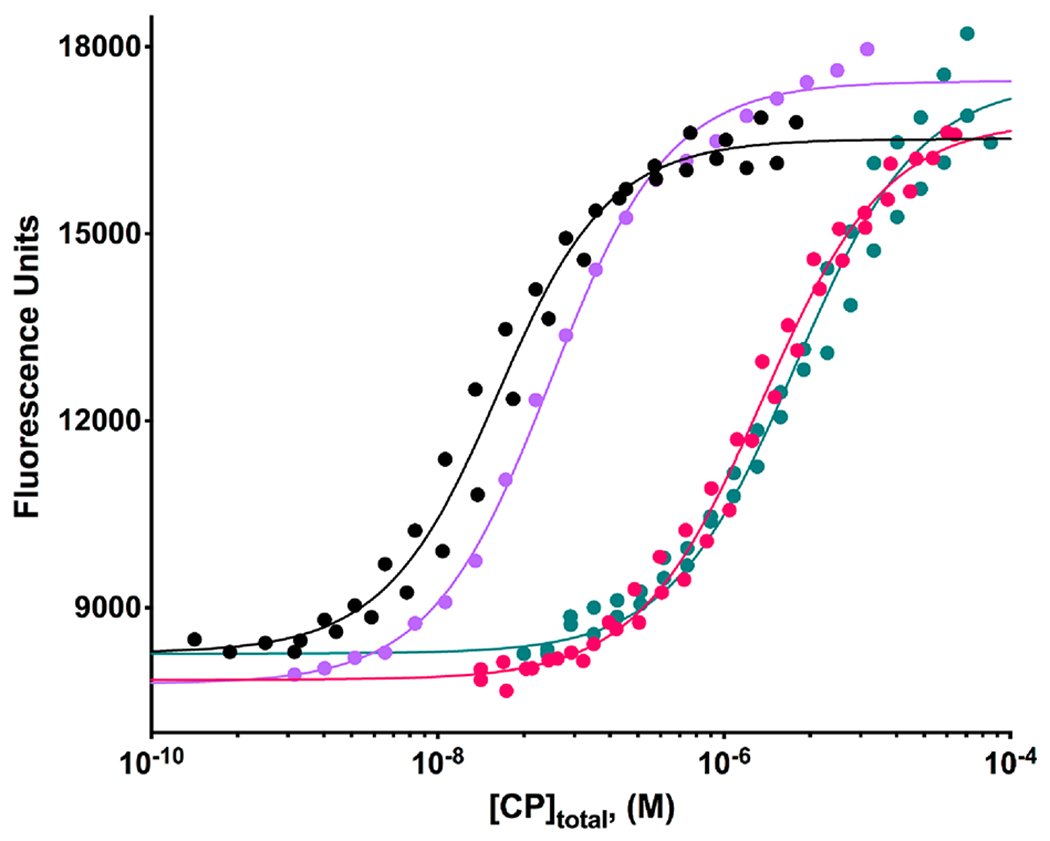
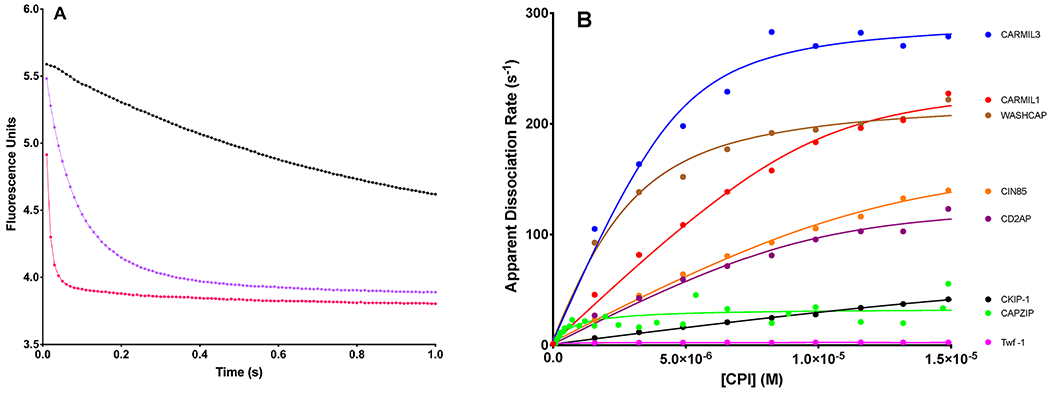
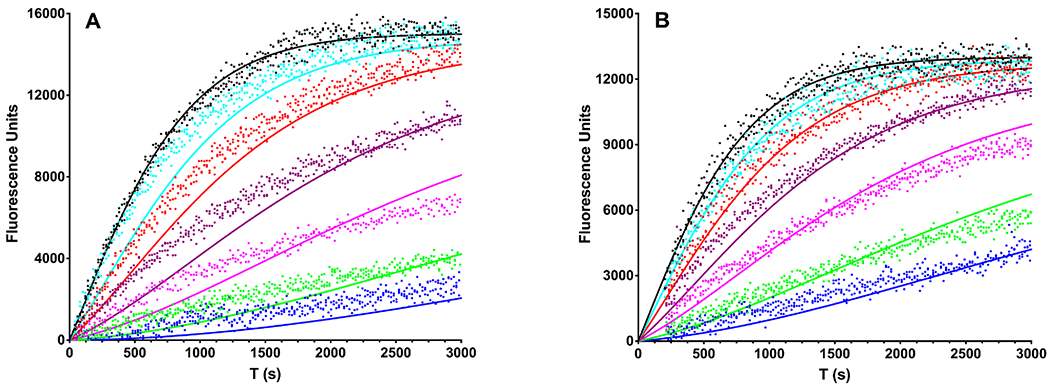
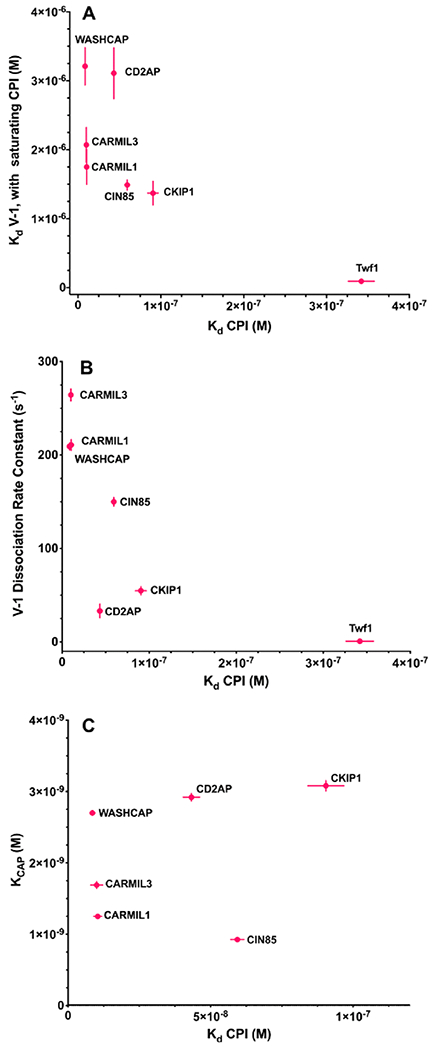
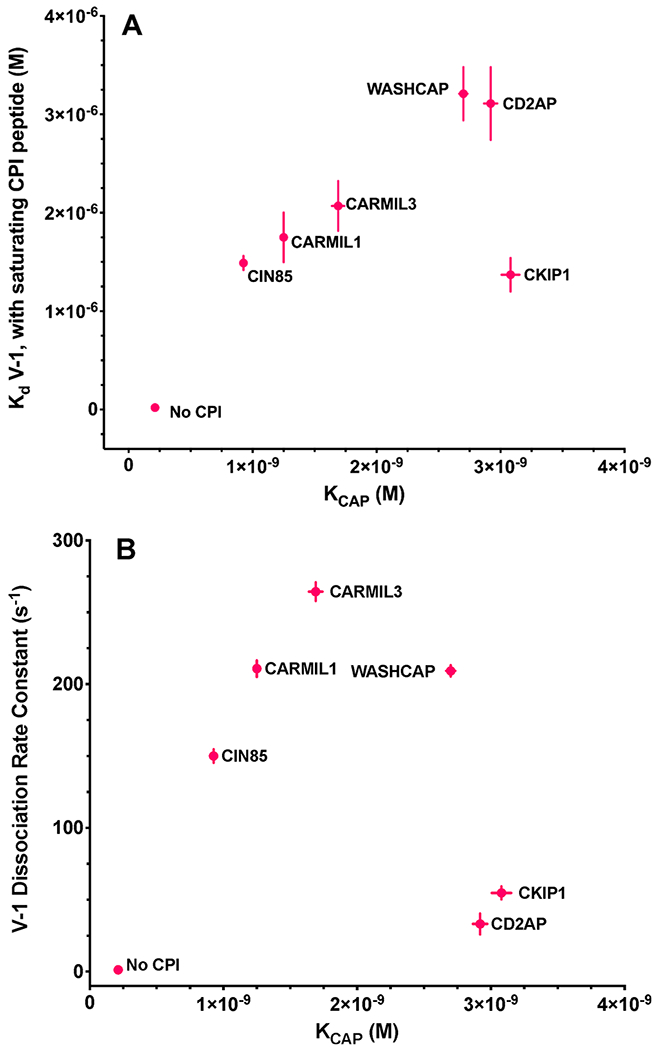
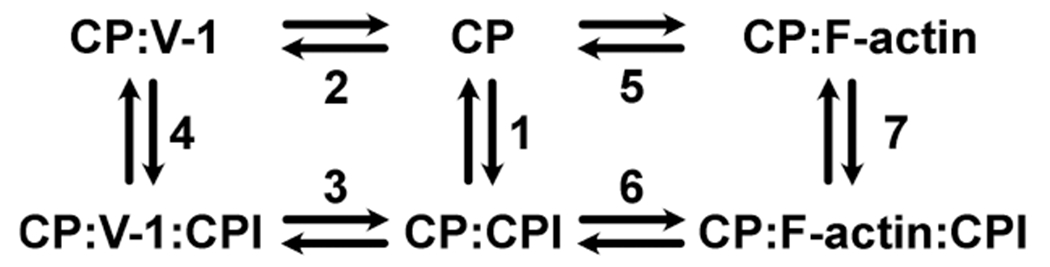
The heterodimeric actin capping protein (CP) is regulated by a set of proteins that contain CP-interacting (CPI) motifs. Outside of the CPI motif, the sequences of these proteins are unrelated and distinct. The CPI motif and surrounding sequences are conserved within a given protein family, when compared to those of other CPI-motif protein families. Using biochemical assays with purified proteins, we compared the ability of CPI-motif-containing peptides from different protein families (a) to bind to CP, (b) to allosterically inhibit barbed-end capping by CP, and (c) to allosterically inhibit interaction of CP with V-1, another regulator of CP. We found large differences in potency among the different CPI-motif-containing peptides, and the different functional assays showed different orders of potency. These biochemical differences among the CPI-motif peptides presumably reflect interactions between CP and CPI-motif peptides involving amino acid residues that are conserved but are not part of the strictly defined consensus, as it was originally identified in comparisons of sequences of CPI motifs across all protein families [Hernandez-Valladares, M., et al. (2010) Structural characterization of a capping protein interaction motif defines a family of actin filament regulators. Nat. Struct. Mol. Biol. 17, 497-503; Bruck, S., et al. (2006) Identification of a Novel Inhibitory Actin-capping Protein Binding Motif in CD2-associated Protein. J. Biol. Chem. 281, 19196-19203]. These biochemical differences may be important for conserved distinct functions of CPI-motif protein families in cells with respect to the regulation of CP activity and actin assembly near membranes.


Conflict of interest statement

The authors declare no competing financial interest.

Figures

Figure 1.
Figure 1.
Phylogenetic analysis of CPI-motif peptides. (A) Multiple-sequence alignment of CPI-motif peptides. ClustalW sequence alignment of CPI-motif peptides from representative vertebrates. Color scheme by chemistry, default in DNASTAR: yellow, aromatic; red, acidic; blue, basic; orange, nonpolar; green, polar. Detailed views and sequence logos are presented in panels a–k of Figure S1. Peptides were derived from the CPI-motif protein families with the following accession numbers: CARMIL1, zebrafish ALI93829, chicken NP_001152842, koala XP_020842531, camel XP_010978439, mouse NP_081101, human Q5VZK9; CARMIL2, zebrafish ALI93830, frog XP_004913561, chicken XP_015134656, koala XP_020844996, mouse NP_001344262, human NP_001013860; CARMIL3, zebrafish ALI93831, frog NP_001121429, koala XP_020822585, camel XP_010994108, mouse NP_001019816, human Q8ND23; CIN85, zebrafish XP_021326013, frog XP_002935234, chicken XP_015157987, koala XP_020845587, camel XP_010985735, mouse NP_001129199, human Q96B97; CD2AP, zebrafish NP_001008583, frog NP_001086432, chicken NP_001305332, koala XP_020849556, camel XP_010993738, mouse NP_033977, human NP_036252; CapZIP, zebrafish NP_001038887, frog BAR45528, chicken NP_001025960, koala XP_020830347, camel EPY73831, mouse NP_848708, human NP_443094; WASHCAP, zebrafish subunit 2C XP_005156762, frog subunit 2C XP_017951133, chicken subunit 2C NP_001012611, koala subunit 2C XP_020850229, camel subunit FAM21-like XP_010983602, mouse subunit 2C XP_006506277, human subunit 2C NP_001162577, human subunit 2A NP_001005751; CKIP-1, zebrafish BAF62166, frog XP_002938507, chicken NP_001026527, koala XP_020860003, camel XP_010995007, mouse NP_075809, human NP_057358; CKIP-2, zebrafish XP_002662798, frog NP_001106552, chicken XP_025009763, koala XP_020839263, camel XP_010991846, mouse NP_694759, human NP_079477; Twinfilin-1, zebrafish AAI53600, frog AAH88597, chicken NP_001265024, koala XP_020829343, camel XP_010987877, mouse NP_032997, human NP_002813; Twinfilin-2, zebrafish NP_001018486, frog NP_001123417, chicken NP_001025760, camel XP_014410799, mouse NP_036006, human NP_009215. (B) Phylogenetic analysis of CPI-motif peptide families. Unrooted phylogenetic tree of aligned CPI-motif peptides from panel A. Sequences are conserved within a family, and families are distinct from one another. Organism names are presented in an unrooted version of the tree in Figure S2. The tree scale represents the number of differences between sequences, 0.1 corresponding to a 10% difference between two sequences.
Figure 2.
Figure 2.
Structures of capping protein, binding partners, and contacts. (A) Structures of capping protein with binding partners. Capping protein (CP) bound to actin (red), V-1 (yellow), and the CARMIL1 CPI region (blue). V-1 sterically inhibits the binding of CP to actin, while CPI motifs allosterically alter the binding of CP to actin. The actin:CP structural model was prepared by R. Dominguez (University of Pennsylvania, Philadelphia, PA). The model combines the structure of CPα1β2 from a cryo-EM structure of dynactin (PDB entry 5ADX) with structures of two conventional actin protomers (PDB entry 6DJM) replacing the Arp1 subunits of dynactin. The CP:V-1 structure (PDB entry 3AAA) and the CP:CPI structure (PDB entry 3LK3) were generated from published X-ray crystal structures prepared using CP α1β1. (B) Contact surfaces for capping protein-binding partners. CP and binding partner surface contacts were analyzed using the structures in Figure 2A. Contact residues in CP within 3.9 Å of the ligand are indicated here. Contact surfaces for F-actin (red), V-1 (yellow), and CARMIL 1 CPI (blue) are shown. Overlapping contact residues on CP for actin and V-1 are colored orange. Several of the overlapping residues are important for actin binding, demonstrated by biochemical assays and structural models for the binding of CP to the barbed end of an actin filament., A single overlapping contact residue in CP for actin and CARMIL 1 CPI is colored purple, while the majority of the contact surface for CPI binding is distal to the actin-binding site.
Figure 3.
Figure 3.
Binding affinity of CPI-motif peptides for CP determined by fluorescence anisotropy. Anisotropy of TAMRA-labeled CPI-motif peptides plotted vs the total concentration of CP: (A) WASHCAP (black), CARMIL3 (blue), and CARMIL1 (red) and (B) CD2AP (green), CIN85 (purple), CKIP-1 (cyan), and Twf-1 (magenta). The points represent data from experiments performed in duplicate, and the lines are the best fits to a single-site binding model. The fitted values of the Kd for CPI-motif peptides binding to CP are listed in Table 1.
Figure 4.
Figure 4.
ITC of CPI-motif peptides binding to CP. Two representative examples are shown. The top panels show titration of CPI-motif peptides into CP with raw data plotted as the heat signal vs time. In the bottom panels, smooth curves show the best fit of the data to a single-site binding model. (A) Titration of CARMIL1 into CP: N = 0.946 ± 0.006, Kd = 27 ± 1 nM, ΔH° = −16.4 ± 0.2 kcal/mol, and TΔS° = −6.1 kcal/mol. (B) Titration of CD2AP into CP: N = 0.993 ± 0.004, Kd = 23 ± 2 nM, ΔH° = −17.4 ± 0.1 kcal/mol, and TΔS° = −6.9 kcal/mol.
Figure 5.
Figure 5.
Effect of V-1 on the binding affinity of CPI-motif peptides for CP determined by fluorescence anisotropy. Two representative examples are shown. Anisotropy of TAMRA-labeled CARMIL1 in the presence of 20 and 50 μM V-1 (black) and CD2AP in the presence of 50 μM V-1 (red) is plotted vs the total concentration of CP. The data points are from individual duplicate experiments, and the lines are the best fits to a single-site binding model. Fitted values of the Kd for the binding of CPI-motif peptides to CP in the presence of V-1 are listed in Table 2.
Figure 6.
Figure 6.
Effect of CPI-motif peptides on the binding affinity of V-1 for CP determined by fluorescence spectroscopy. Representative examples are shown. The fluorescence intensity of TAMRA-labeled V-1 is plotted vs the total concentration of CP. Experiments performed in the absence of any CPI-motif peptide (black) or in the presence of saturating concentrations of CARMIL1 (red), mutant CARMIL1 (K987A R989A) (lavender), or CD2AP (teal). The CPI-motif peptides were present at a concentration of 50 μM, at least 150-fold greater than the Kd for each CPI-motif peptide binding to CP in the absence of V-1. The points represent data from experiments performed in duplicate, except for one replicate for CARMIL1 (K987A R989A). The lines are the best fits to a single-site binding model. The fitted values of the Kd for binding of V-1 to CP in the presence of CPI-motif peptides are listed in Table 2.
Figure 7.
Figure 7.
Effect of CPI-motif peptides on the rate of dissociation of V-1 from CP determined by stopped-flow fluorescence spectroscopy. (A) Fluorescence intensity plotted vs time, for fluorescently labeled V-1 dissociating from CP upon addition of unlabeled V-1 at time zero. Three representative examples are shown: control with only unlabeled V-1 (black) and CARMIL1 peptide at 0.5 μM (lavender) and 5 μM (red). The points represent experimental data, and the lines are the best fits to a double-exponential decay model. The value of the smaller-amplitude step of the double exponential was 90–1700-fold less than the value of the larger-amplitude step, and it showed little dependence on the concentration of the CPI motif. Thus, we report only the fitted values for the rate of the larger-amplitude process here. The apparent rates of dissociation of V-1 from CP in these examples were as follows: 1.23 ± 0.03 s−1 in the absence of the CPI-motif peptide, 13.6 ± 0.1 s−1 in the presence of 0.5 μM CARMIL1, and 92 ± 1 s−1 in the presence of 5 μM CARMIL1. (B) Apparent rates of dissociation of V-1 from CP, obtained from experiments such as those in panel A, plotted vs the concentration of the CPI-motif peptide. Shown are the following: CARMIL3, blue; CARMIL1, red; WASHCAP, brown; CIN85, orange; CD2AP, purple; CKIP-1, black; CapZIP, green; Twf-1, magenta. The points are values from experiments, and the solid lines are simulations of best fits to a kinetic model. V-1 dissociation rate constants in the absence and presence of CPI-motif peptides are listed in Table 2, under reactions 2 and 3.
Figure 8.
Figure 8.
Effect of CPI-motif peptides on the affinity of CP for the barbed end determined by pyrene actin fluorescence spectroscopy. Pyrene-actin fluorescence is plotted vs time. The points represent data from experiments performed in triplicate, and the lines are the best simultaneous (global) fits to an actin polymerization model. (A) Experiments were performed in the presence of saturating (20 μM) CARMIL1 and the following concentrations of CP: 0 (black), 0.75 (cyan), 2 (red), 5 (purple), 10 (magenta), 25 (green), and 50 nM (blue). The fitted value for the Kd for binding of CP to the barbed end (KCAP) in the presence of CARMIL1 was 1.3 ± 0.1 nM. (B) Experiments as in panel A with saturating (20 μM) CD2AP. The KCAP in the presence of CD2AP was 2.9 ± 0.1 nM.
Figure 9.
Figure 9.
Comparison of CP:V-1 and CP:actin interactions with CP:CPI binding affinity. Three plots comparing allosteric effects on the actin- and V-1-binding upper surface of CP (mushroom cap) with binding of a CPI-motif peptide to the lower portion (mushroom stalk) of CP. Plotted points are values listed in Tables 1 and 2. CPI motifs are labeled on the graphs. The error bars are derived from the experimental data, and when error bars are not visible, the error was less than the radius of the symbol. (A) Binding affinity of V-1 for CP:CPI (CP in the presence of saturating CPI) plotted vs the binding affinity of CP for the CPI motif. (B) Rates of dissociation of V-1 from the CP:CPI:V-1 complex plotted vs the binding affinity of CP for the CPI motif. (C) Binding affinity of actin (F-actin barbed end) for CP plotted vs the binding affinity of CP for the CPI motif.
Figure 10.
Figure 10.
Comparison of CP:V-1 interactions with CP:actin binding affinity. Two plots comparing allosteric effects of CPI motifs on the binding of CP to actin with effects on the interaction of V-1 with CP. Data points are values listed in Tables 1 and 2. CPI motifs are labeled on the graph. The error bars are derived from the experimental data. When error bars are not visible, the error was less than the radius of the symbol. (A) Binding constant of V-1 for CP:CPI (CP in the presence of saturating CPI) plotted vs KCAP, the binding constant of CP for the F-actin barbed end. (B) Rate of dissociation of V-1 from the CP:CPI:V-1 complex plotted vs KCAP.
Figure 11.
Figure 11.
Diagram of the thermodynamic cycle for the binding of CP to CPI motifs, V-1, and F-actin. Kd values in reactions 1–4 were determined directly by experiments: fluorescence intensity and anisotropy titrations. Values for reaction 1 are listed in Table 1. Binding constants determined by fluorescence titrations and rate constants for dissociation of V-1 determined by stopped-flow fluorescence experiments in reactions 2 and 3 are listed in Table 2. Kd values for reactions 5 and 6 (KCAP) determined by kinetic modeling of pyrene-actin polymerization assays are listed in Table 2. For reaction 7, Kd valuess were calculated from the values for reactions 1, 5, and 6; these values are also listed in Table 2.

References

    1. Hernandez-Valladares M, Kim T, Kannan B, Tung A, a AH, Larsson M, Cooper JA, and Robinson RC (2010) Structural characterization of a capping protein interaction motif defines a family of actin filament regulators. Nat. Struct. Mol. Biol 17, 497–503. - PMC - PubMed
    1. Bruck S, Huber TB, Ingham RJ, Kim K, Niederstrasser H, Allen PM, Pawson T, Cooper JA, and Shaw AS (2006) Identification of a Novel Inhibitory Actin-capping Protein Binding Motif in CD2-associated Protein. J. Biol. Chem 281, 19196–19203. - PMC - PubMed
    1. Svitkina TM (2018) Ultrastructure of the actin cytoskeleton. Curr. Opin. Cell Biol 54, 1–8. - PMC - PubMed
    1. Mullins RD, Bieling P, and Fletcher DA (2018) From solution to surface to filament: actin flux into branched networks. Biophys. Rev 10, 1537–1551. - PMC - PubMed
    1. Pollard TD (2016) Actin and Actin-Binding Proteins. Cold Spring Harbor Perspect. Biol 8, No a018226. - PMC - PubMed

Publication types

MeSH terms