. 2020 Mar 26;5(6):e129034.
doi: 10.1172/jci.insight.129034.

Renal protective effects of empagliflozin via inhibition of EMT and aberrant glycolysis in proximal tubules

Affiliations

Renal protective effects of empagliflozin via inhibition of EMT and aberrant glycolysis in proximal tubules

Jinpeng Li et al. JCI Insight. .

Abstract

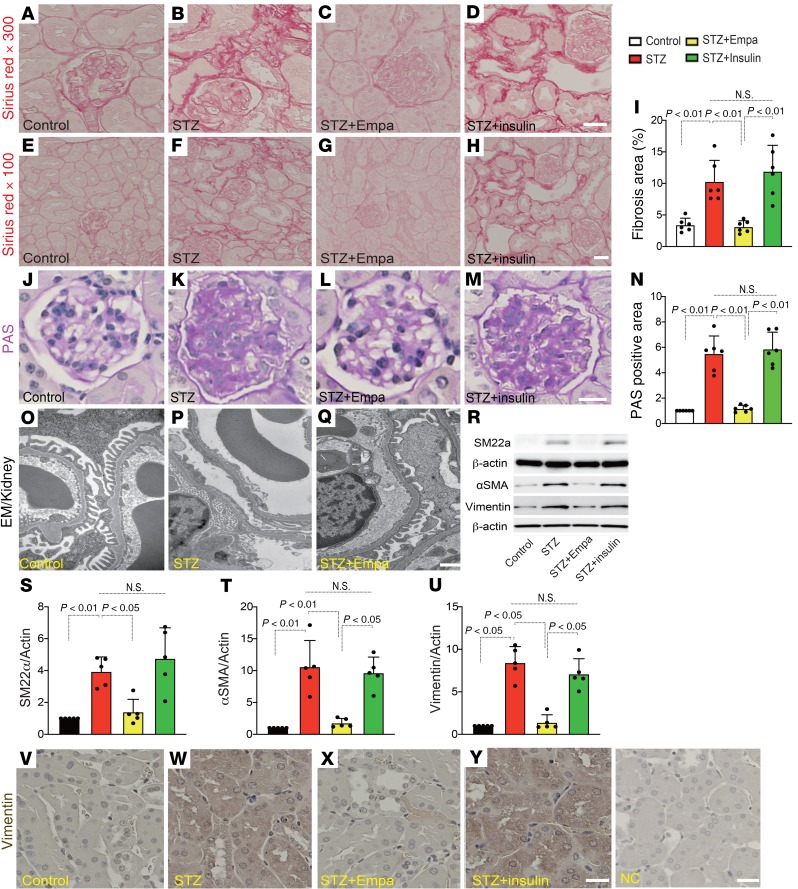
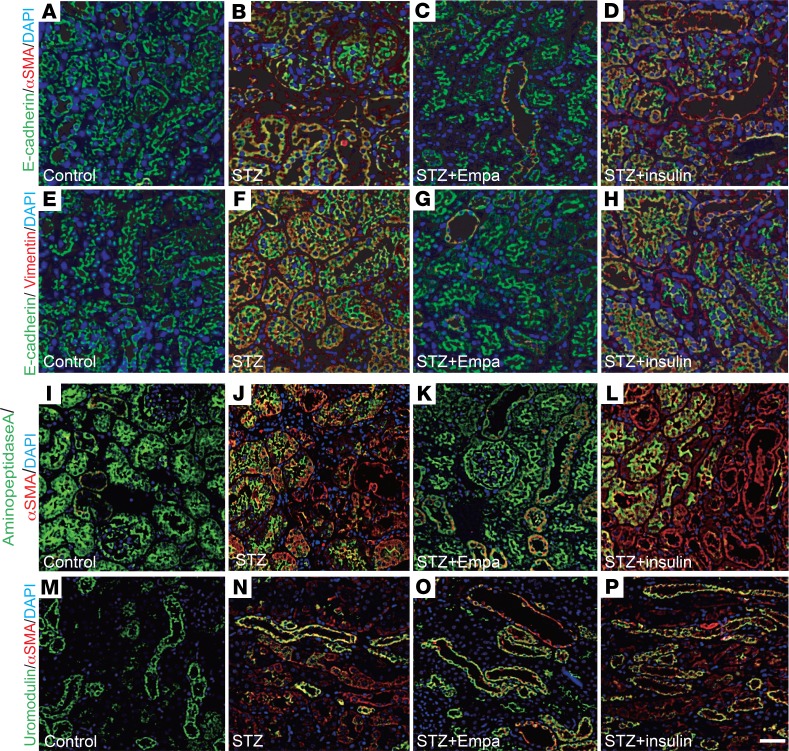
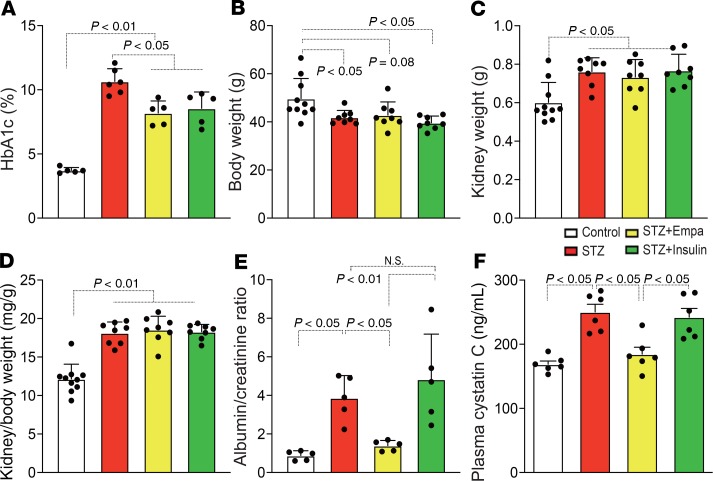
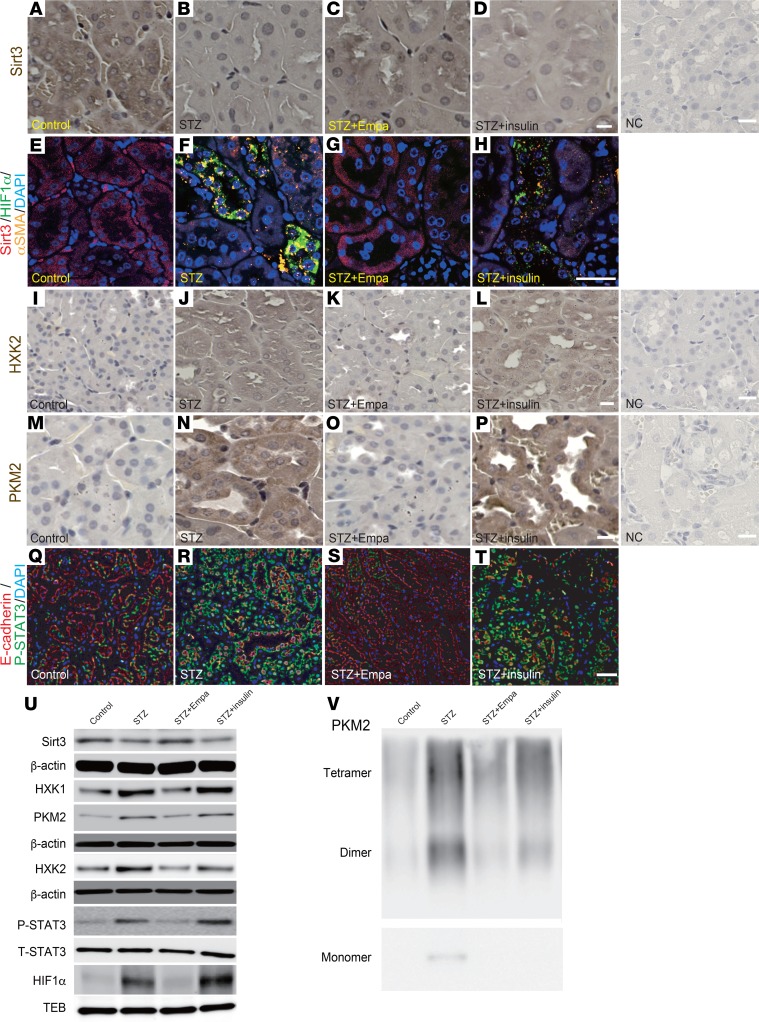
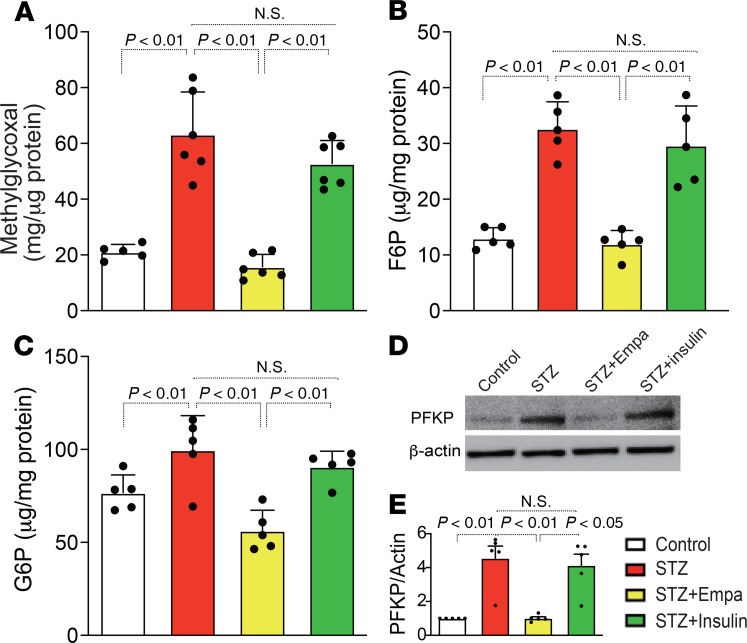
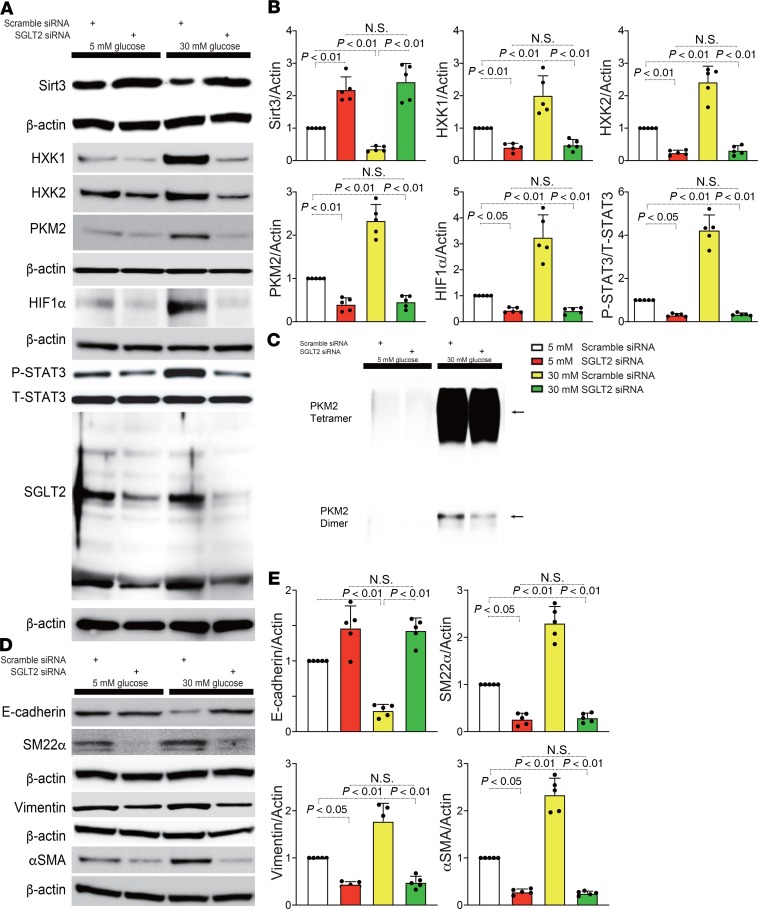
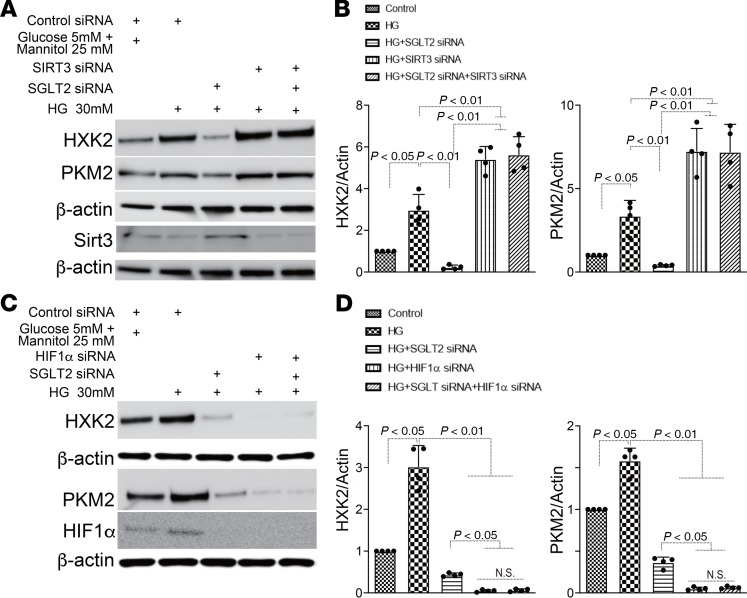
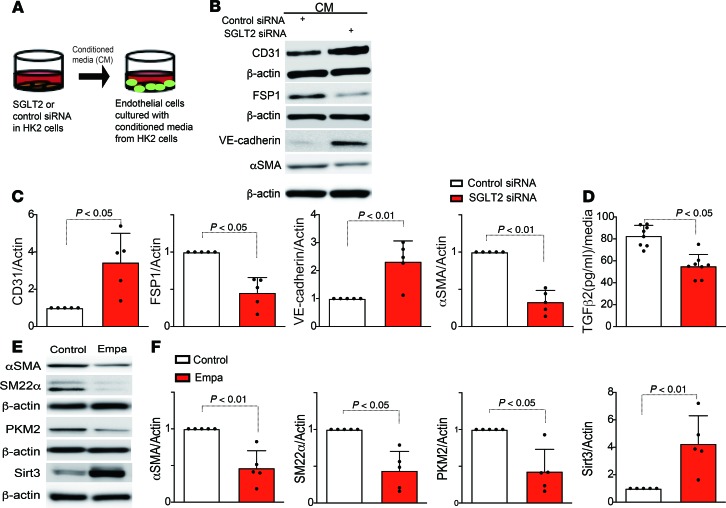
Sodium glucose cotransporter 2 (SGLT2) inhibitors are beneficial in halting diabetic kidney disease; however, the complete mechanisms have not yet been elucidated. The epithelial-mesenchymal transition (EMT) is associated with the suppression of sirtuin 3 (Sirt3) and aberrant glycolysis. Here, we hypothesized that the SGLT2 inhibitor empagliflozin restores normal kidney histology and function in association with the inhibition of aberrant glycolysis in diabetic kidneys. CD-1 mice with streptozotocin-induced diabetes displayed kidney fibrosis that was associated with the EMT at 4 months after diabetes induction. Empagliflozin intervention for 1 month restored all pathological changes; however, adjustment of blood glucose by insulin did not. Empagliflozin normalized the suppressed Sirt3 levels and aberrant glycolysis that was characterized by HIF-1α accumulation, hexokinase 2 induction, and pyruvate kinase isozyme M2 dimer formation in diabetic kidneys. Empagliflozin also suppressed the accumulation of glycolysis byproducts in diabetic kidneys. Another SGLT2 inhibitor, canagliflozin, demonstrated similar in vivo effects. High-glucose media induced the EMT, which was associated with Sirt3 suppression and aberrant glycolysis induction, in the HK2 proximal tubule cell line; SGLT2 knockdown suppressed the EMT, with restoration of all aberrant functions. SGLT2 suppression in tubular cells also inhibited the mesenchymal transition of neighboring endothelial cells. Taken together, SGLT2 inhibitors exhibit renoprotective potential that is partially dependent on the inhibition of glucose reabsorption and subsequent aberrant glycolysis in kidney tubules.

Keywords: Diabetes; Drug therapy; Endocrinology; Fibrosis; Metabolism.


Conflict of interest statement

Conflict of interest: KK and DK received lecture honoraria from Boehringer Ingelheim and Eli Lilly. KK is under a consultancy agreement with Boehringer Ingelheim.

Figures

Figure 1
Figure 1. Empagliflozin suppressed kidney fibrosis in association with inhibition of the EMT in kidneys from diabetic CD-1 mice.
Higher-magnification (original magnification, ×300) (A–D) and lower-magnification (original magnification, ×100) (E–H) images of Sirius Red staining for fibrosis. Scale bar: 60 μm (A–D); 20 μm (E–H). (I) Relative fibrosis areas were calculated using ImageJ software. Six independent high-magnification images of the staining were analyzed. n = 6. (J–N) PAS staining was performed in kidney paraffin sections. Six independent images of the staining were analyzed. n = 6 in each group. Scale bar: 80 μm. (N) Quantification of the relative surface area of glomeruli by ImageJ software. (O–Q) Electron microscopy (EM) was performed to evaluate glomerular damage. Representative images are presented. n = 2. Scale bar: 1 μm. (R) Representative Western blotting images of mesenchymal markers in kidney samples. β-Actin from same gel is shown under the corresponding blots as loading control. (S–U) Densitometric analysis of the Western blotting results normalized to β-actin. n = 5 in each group. (V–Y) Immunohistochemical analysis for vimentin. Deparaffinized sections were analyzed from each group of mice. n = 5. Scale bar: 50 μm. Representative data are shown. The data are expressed as mean ± SD. One-way ANOVA followed by Tukey’s multiple comparison test was used to determine significance, which was defined as P < 0.05. Empa, empagliflozin; NC, negative control.
Figure 2
Figure 2. Empagliflozin suppressed the mesenchymal phenotypes in the proximal tubules in diabetic mice.
(A–H) EMT analysis. E-cadherin–positive/αSMA-positive cells (A–D) and E-cadherin–positive/vimentin-positive cells (E–H) were recognized as cells undergoing the EMT. For each group of mice. n = 5. Scale bar: 50 μm. (I–P) Immunofluorescence for aminopeptidase A/αSMA and uromodulin/αSMA in kidney sections. Deparaffinized sections were analyzed from each group of mice. n = 5. Scale bar: 50 μm. Empa, empagliflozin.
Figure 3
Figure 3. Characteristics of each group of mice.
The HbA1c level (A), body weight (B), kidney weight (C), kidney/body weight (D), albumin-creatinine ratio (E), and plasma cystatin C (F) are shown. For A, n = 5–6; for B–D, n = 8–10; for E and F, n = 6. The data are expressed as mean ± SD. One-way ANOVA followed by Tukey’s multiple comparison test was used to determine significance, which was defined as P < 0.05. Empa, empagliflozin.
Figure 4
Figure 4. Empagliflozin restored Sirt3 expression and inhibited aberrant glycolysis in the diabetic kidney.
(A–D) Immunohistochemical analysis of Sirt3 levels. (E–H) Multiplex opal in situ analysis for Sirt3/HIF-1α/αSMA expression. (I–P) Immunohistochemical analysis of HXK2 (I–L) and PKM2 expression (M–P). A representative analysis is shown for 4 independent experiments. Scale bar: 60 μm (A–D and M–P); 30 μm (I–L); 80 μm (E–H). (Q–T) Immunofluorescence microscopic analysis of E-cadherin/P-STAT3 in kidney tissues from each group of mice. Scale bar: 50 μm. (U) Western blotting analysis to detect the expression of Sirt3, P-STAT3, and molecules related to aberrant glycolysis. Representative data from 5 independent analyses are shown. The quantification data are shown in Supplemental Figure 5. (V) β-Actin or TEB from same gel are shown under the corresponding blots as loading control. T-STAT3 was analyzed in different gels using same biological samples as P-STAT3. Chemical crosslinking analysis of PKM2. Kidney lysates were treated with glutaraldehyde and separated in gels. Representative analysis from 5 independent experiments is shown. Empa, empagliflozin; NC, negative control.
Figure 5
Figure 5. Empagliflozin suppressed glycolysis intermediates in diabetic kidneys.
(A) Methylglyoxal in the kidneys of the indicated groups was measured and quantified. n = 5 in all groups. (B and C) The kidney glycolysis intermediates (F6P and G6P) were analyzed. n = 5. (D) Representative Western blotting images of PFKP in kidney tissues. β-Actin from same gel is shown under the corresponding blots as loading control. (E) Densitometric analysis of the Western blotting results was normalized to β-actin. n = 5 in each group. The data are expressed as mean ± SD. One-way ANOVA followed by Tukey’s multiple comparison test was used to determine significance, which was defined as P < 0.05. Empa, empagliflozin.
Figure 6
Figure 6. SGLT2 knockdown protected HK2 cells against high-glucose–induced EMT in association with suppression of aberrant glycolysis.
(A) Representative Western blotting data for Sirt3, P-STAT3, and the molecules related to aberrant glycolysis from 5 independent experiments. β-Actin from same gel are shown under the corresponding blots as loading control, except for Sirt3, for which β-actin was run in different gel using same samples. T-STAT3 was analyzed in different gels using same samples as P-STAT3. (B) Densitometric analysis of the indicated molecules. n = 5. (C) Chemical crosslinking analysis for PKM2. HK2 cell lysates were treated with glutaraldehyde and separated in a gel. A representative analysis from 5 independent experiments is shown. (D) Representative Western blot data for the EMT from 5 independent experiments. E-cadherin is blotted on the same membrane as Sirt3 in A. β-Actin was analyzed in same membrane with E-cadherin or Sirt3 and is shown under the corresponding blots as loading control. SM22α, vimentin, and αSMA were analyzed on a different gel using the same biological samples. (E) Densitometric analyses of the indicated molecules. The data are expressed as mean ± SD. One-way ANOVA followed by Tukey’s multiple comparison test was used to determine significance, which was defined as P < 0.05. Empa, empagliflozin.
Figure 7
Figure 7. SGLT2 knockdown suppressed aberrant glycolysis in a Sirt3 pathway–dependent manner.
SGLT2 siRNA with or without Sirt3 or HIF-1α siRNA were transfected into HK2 cells, and after 6 hours, the medium was changed to fresh medium with high glucose and incubated for 48 hours. Western blotting analysis of glycolysis markers (A and C). Representative analysis from 5 independent experiments is shown (B and D). α-Actin from same gel is shown under the corresponding blots as loading control (A, same gels; C, same biological samples).The data were normalized to α-actin and are shown as mean ± SD. One-way ANOVA followed by Tukey’s multiple comparison test was used to determine significance, which was defined as P < 0.05.
Figure 8
Figure 8. SGLT2-mediated uptake of glucose induced neighboring endothelial cells to transition into mesenchymal cells.
(A) Design of the conditioned media experiment. HK2 cells were transfected with scramble or SGLT2 siRNA, and after 6 hours, the medium was changed to fresh medium and incubated for 48 hours. The subsequently harvested media were transferred to HMVEC cultures. (B) Representative Western blotting images of the indicated molecules from 5 independent experiments are shown. β-Actin from same gel is shown under the corresponding blots as loading control. (C) Densitometric analysis of the levels relative to β-actin are shown. (D) ELISA analysis of TGF-β2 levels from conditioned medium. (E) Representative Western blotting images of αSMA, SM22α, PKM2, and Sirt3 from 5 independent experiments. β-Actin is shown under the corresponding blots as loading control (run in different gels using same biological samples). (F) Densitometric analysis of the levels relative to β-actin are shown. The data are expressed as mean ± SD. One-way ANOVA followed by Tukey’s multiple comparison test was used to determine significance, which was defined as P < 0.05. Empa, empagliflozin.

References

    1. Tuttle KR, et al. Diabetic kidney disease: a report from an ADA Consensus Conference. Diabetes Care. 2014;37(10):2864–2883. - PMC - PubMed
    1. Lewis EJ, Hunsicker LG, Bain RP, Rohde RD. The effect of angiotensin-converting-enzyme inhibition on diabetic nephropathy. The Collaborative Study Group. N Engl J Med. 1993;329(20):1456–1462. doi: 10.1056/NEJM199311113292004. - DOI - PubMed
    1. Brenner BM, et al. Effects of losartan on renal and cardiovascular outcomes in patients with type 2 diabetes and nephropathy. N Engl J Med. 2001;345(12):861–869. doi: 10.1056/NEJMoa011161. - DOI - PubMed
    1. Raskin P. Sodium-glucose cotransporter inhibition: therapeutic potential for the treatment of type 2 diabetes mellitus. Diabetes Metab Res Rev. 2013;29(5):347–356. doi: 10.1002/dmrr.2403. - DOI - PubMed
    1. Zinman B, et al. Empagliflozin, cardiovascular outcomes, and mortality in type 2 diabetes. N Engl J Med. 2015;373(22):2117–2128. doi: 10.1056/NEJMoa1504720. - DOI - PubMed

Publication types

MeSH terms