. 2020 May;10(5):789-801.
doi: 10.1002/2211-5463.12830. Epub 2020 Apr 14.

Hypoxia potentiates the capacity of melanoma cells to evade cisplatin and doxorubicin cytotoxicity via glycolytic shift

Affiliations

Hypoxia potentiates the capacity of melanoma cells to evade cisplatin and doxorubicin cytotoxicity via glycolytic shift

Ming Zhuo et al. FEBS Open Bio. 2020 May.

Abstract

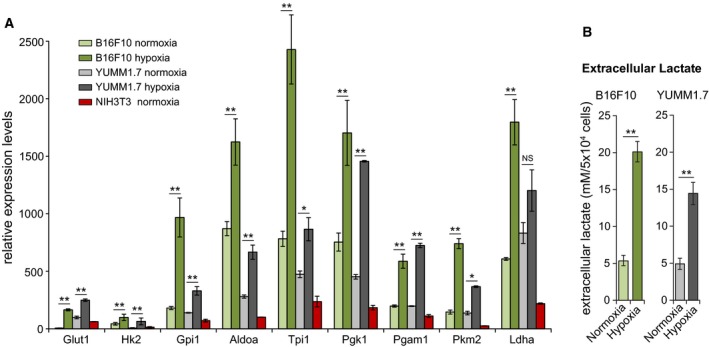
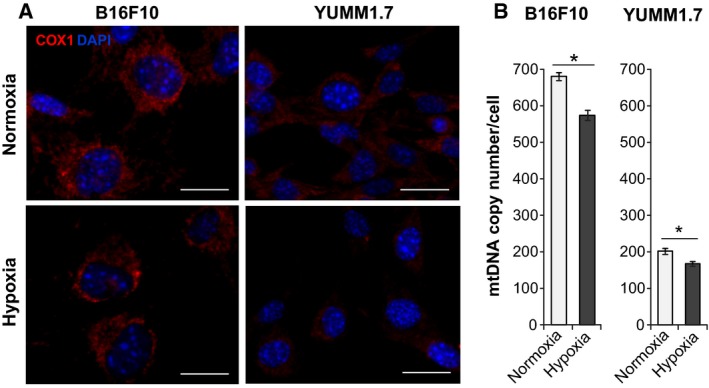
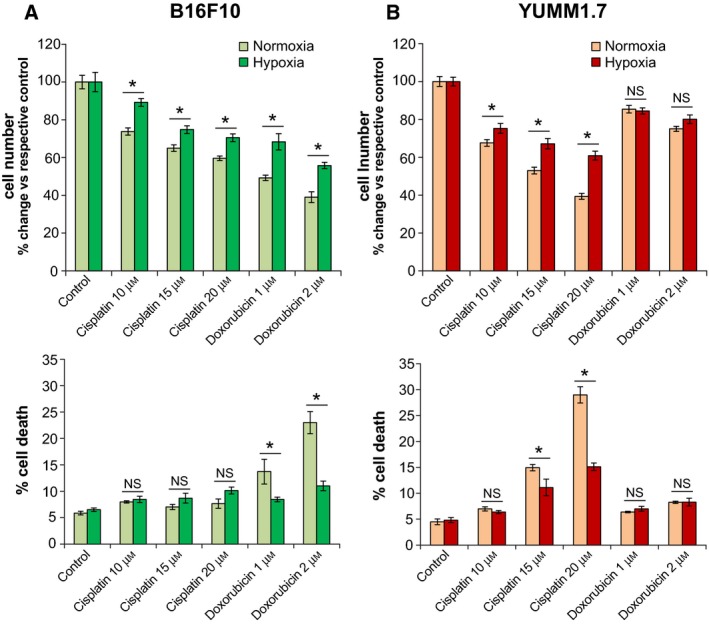
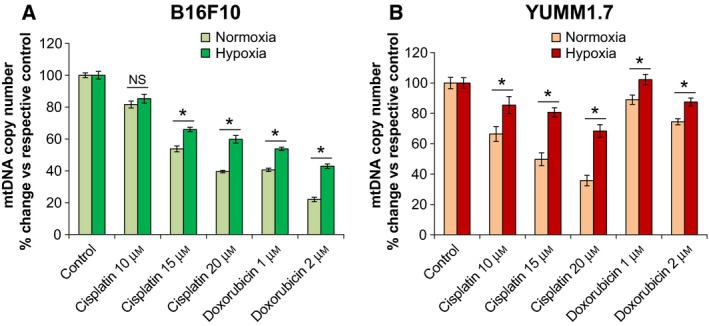
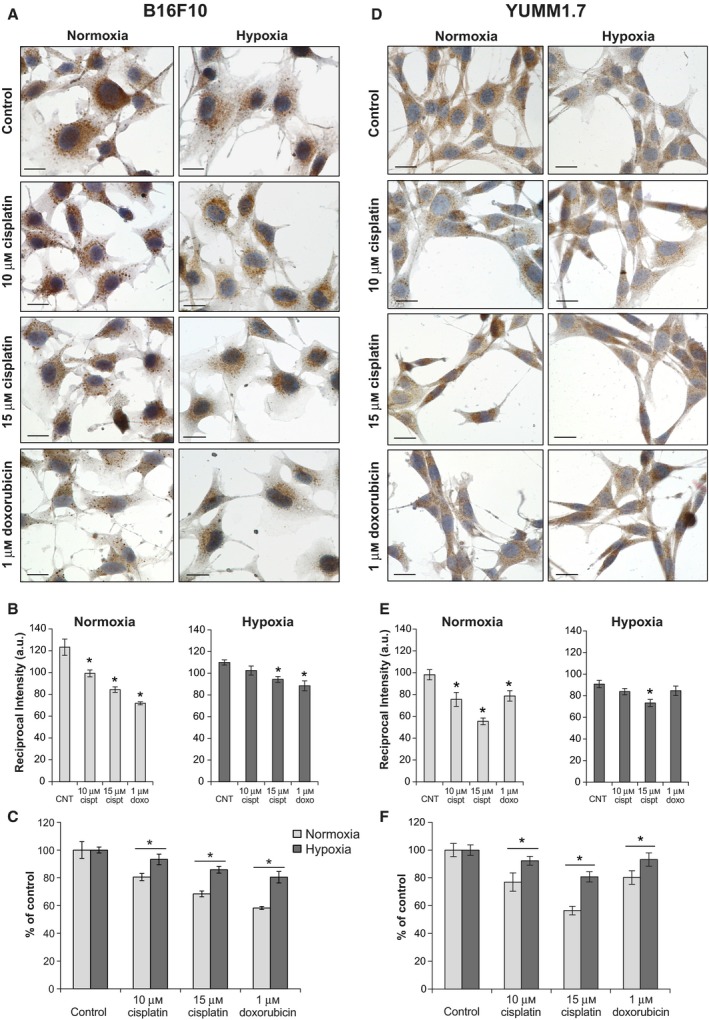
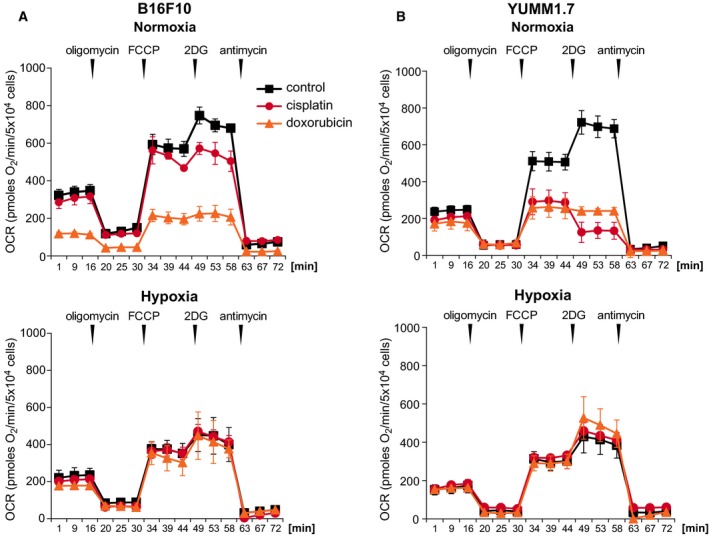
The hypoxic environment within solid tumors impedes the efficacy of chemotherapeutic treatments. Here, we demonstrate that hypoxia augments the capacity of melanoma cells to withstand cisplatin and doxorubicin cytotoxicity. We show that B16F10 cells derived from spontaneously formed melanoma and YUMM1.7 cells, engineered to recapitulate human-relevant melanoma driver mutations, profoundly differ in their vulnerabilities to cisplatin and doxorubicin. The differences are manifested in magnitude of proliferative arrest and cell death rates, extent of mtDNA depletion, and impairment of mitochondrial respiration. In both models, cytotoxicity is mitigated by hypoxia, which augments glycolytic metabolism. Collectively, the findings implicate metabolic reprogramming in drug evasion and suggest that melanoma tumors with distinct genetic makeup may have differential drug vulnerabilities, highlighting the importance of precision anticancer treatments.

Keywords: cisplatin; doxorubicin; glycolysis; hypoxia; melanoma; mitochondrial respiration.


Conflict of interest statement

The authors declare no conflict of interest.

Figures

Fig. 1
Fig. 1
High baseline and upregulation by hypoxia of glycolytic gene expression in B16F10 and YUMM1.7 melanoma cells. (A) Glycolytic gene expression profiles in normoxia and hypoxia of B16F10 (green) and YUMM1.7 (gray) cells; mouse NIH3T3 fibroblast baseline expression pattern is shown for comparison (red). (B) Extracellular lactate levels in B16F10 and YUMM1.7 culture media measured following incubation under normoxic and hypoxic conditions. Values from 4 biological experiments were used to obtain mean ± SEM; two‐tailed t‐test was used. *P < 0.05 and **P < 0.01 versus respective mean value in normoxia.
Fig. 2
Fig. 2
Cytochrome c oxidase subunit 1 (Cox1) immunoreactivity and mtDNA copy numbers decrease under hypoxic conditions in B16F10 and YUMM1.7 cells. (A) Representative images of Cox1 immunofluorescence patterns (red) observed under normoxic and hypoxic conditions; Intense Cox1 staining reflects high mitochondrial contents in B16F10 compared to YUMM1.7 cells. Staining intensity is reduced in hypoxia; nuclei stain blue with DAPI, scale bar = 20 µm. (B) RT‐qPCR analyses of mtDNA contents reveal reduction in mtDNA copy number under hypoxic conditions; data are presented as mean ± SEM copy number for 3‐4 experiments; two‐tailed t‐test was used. *indicates different from normoxia; P < 0.05.
Fig. 3
Fig. 3
Differential decreases in proliferation and increases in cell death rates in B16F10 (A) and YUMM1.7 (B) cells incubated with cisplatin or doxorubicin under normoxic and hypoxic conditions. (Top) graphs show percent change in cell number relative to respective control following each treatment; data are presented as mean ± SEM of percent change averaged for 3 biological experiments; *Indicates different from mean ± SEM percent change in normoxia; P < 0.05. (Bottom) percent cell death in cultures challenged with cisplatin or doxorubicin under normoxic or hypoxic conditions; data are presented as mean ± SEM from 3 experiments; *Indicates different from percent cell death in normoxia, NS, not significant; P < 0.05. Two‐tailed t‐test was used.
Fig. 4
Fig. 4
Differential decreases of mtDNA contents in B16F10 and YUMM1.7 cells following cisplatin and doxorubicin exposures under normoxic and hypoxic conditions. RT‐qPCR analyses of mtDNA copy number in B16F10 (A) and YUMM1.7 (B) cells; data are presented as mean ± SEM percent change in mtDNA copy number versus each respective control calculated from 3 biological experiments; two‐tailed t‐test was used, *indicates different from % change in normoxia, NS, not significant; P < 0.05.
Fig. 5
Fig. 5
Immunoreactivity patterns of the mtDNA binding transcription factor A (Tfam) are differentially modified following exposures to cisplatin and doxorubicin. (A‐C) Representative images and quantitation of staining intensity of nontreated and drug‐exposed B16F10 cells show changes in Tfam intensity and distribution, with discrete aggregated pattern following cisplatin and doxorubicin exposures. Reduced staining intensity is seen following hypoxia. Hypoxia lessens drug‐induced Tfam aggregation when compared to normoxic conditions. (D–F) Representative images and quantitation of Tfam immunoreactivity in control and drug‐exposed YUMM1.7 cells. Staining patterns are differentially modified by cisplatin and doxorubicin with aggregation and spindle‐shaped cell morphology. Hypoxia attenuates the steep decline in staining intensity observed after normoxic drug exposures with reduced aggregation and fewer spindle‐shaped stressed cells present. Tfam is observed in brown, counterstained with hematoxylin, and captured with 60x oil objective; scale bar = 20 µm. Staining intensity quantification is shown in panels B and E; bars represent intensity values of TFAM immunoreactivity (a.u.). Asterisk indicates different from nonexposed normoxic or hypoxic control, respectively. In panels C and F, intensity values are normalized and presented as percent change relatively to each respective control; asterisk indicates different from the change measured for each drug exposure under normoxic condition. Data are graphed as mean ± SEM of 3 biological replicates per condition, *p < 0.05. Two‐tailed t‐test was used.
Fig. 6
Fig. 6
Hypoxia protects B16F10 and YUMM1.7 cells from cisplatin and doxorubicin‐induced respiratory compromise. Respiratory assays were done on XF24 extracellular flux analyzer. Post‐treatment respiratory profiles of (A) B16F10 and (B) YUMM1.7 cells following incubation with vehicle, cisplatin, or doxorubicin under normoxic (top) and hypoxic (bottom) conditions. Additions of effectors are indicated by vertical arrowheads. The first segment of assay measures baseline respiration followed by the addition of oligomycin that reveals the portion of OCR coupled to ATP synthesis, followed by measurements of FCCP‐induced OCR and subsequent assessments of mitochondrial compromise revealed by the addition of 2DG that blocks glycolytic metabolism and stimulates compensatory mitochondrial oxygen consumption. Values are presented as mean ± SEM OCR for 4 biological experiments.

Similar articles

Cited by

References

    1. Kim J and DeBerardinis RJ (2019) Mechanisms and implications of metabolic heterogeneity in cancer. Cell Metab 30, 434–446. - PMC - PubMed
    1. Eastman A (1987) The formation, isolation and characterization of DNA adducts produced by anticancer platinum complexes. Pharmacol Ther 34, 155–66. - PubMed
    1. Podratz JL, Knight AM, Ta LE, Staff NP, Gass JM, Genelin K, Schlattau A, Lathroum L and Windebank AJ (2011) Cisplatin induced mitochondrial DNA damage in dorsal root ganglion neurons. Neurobiol Dis 41, 661–668. - PMC - PubMed
    1. Clayton DA, Doda JN and Friedberg EC (1974) The absence of a pyrimidine dimer repair mechanism in mammalian mitochondria. Proc Natl Acad Sci USA 71, 2777–2781. - PMC - PubMed
    1. Croteau DL, Stierum RH and Bohr VA (1999) Mitochondrial DNA repair pathways. Mutat Res 434, 137–148. - PubMed

Publication types

Associated data